
EPI’s Autopilot Economy Tracker provides a set of real-time benchmarks to help Americans gauge how well the public officials elected to serve them are performing as stewards of the U.S. economy. The benchmarking is provided by a set of charts that show changes in key indicators of economic health relative to how the indicators would have changed had the economy simply been on autopilot. By “autopilot” we mean how the indicators would have changed under a continuation of the trends already underway before the Trump administration took the wheel.
In each chart, the trajectory of the preexisting trend (the “autopilot projection”) constitutes the baseline against which to judge policymakers’ performance at any point in time. If the indicator measured is above or below the baseline, policy decisions likely had an effect and policymakers can claim credit—or shoulder blame. We focus on changes between now and 2019 because we think any projection of developments beyond 2019 are too unreliable to include. Our hope is that this tool helps people make fair and informed evaluations of economic policymakers’ decisions.
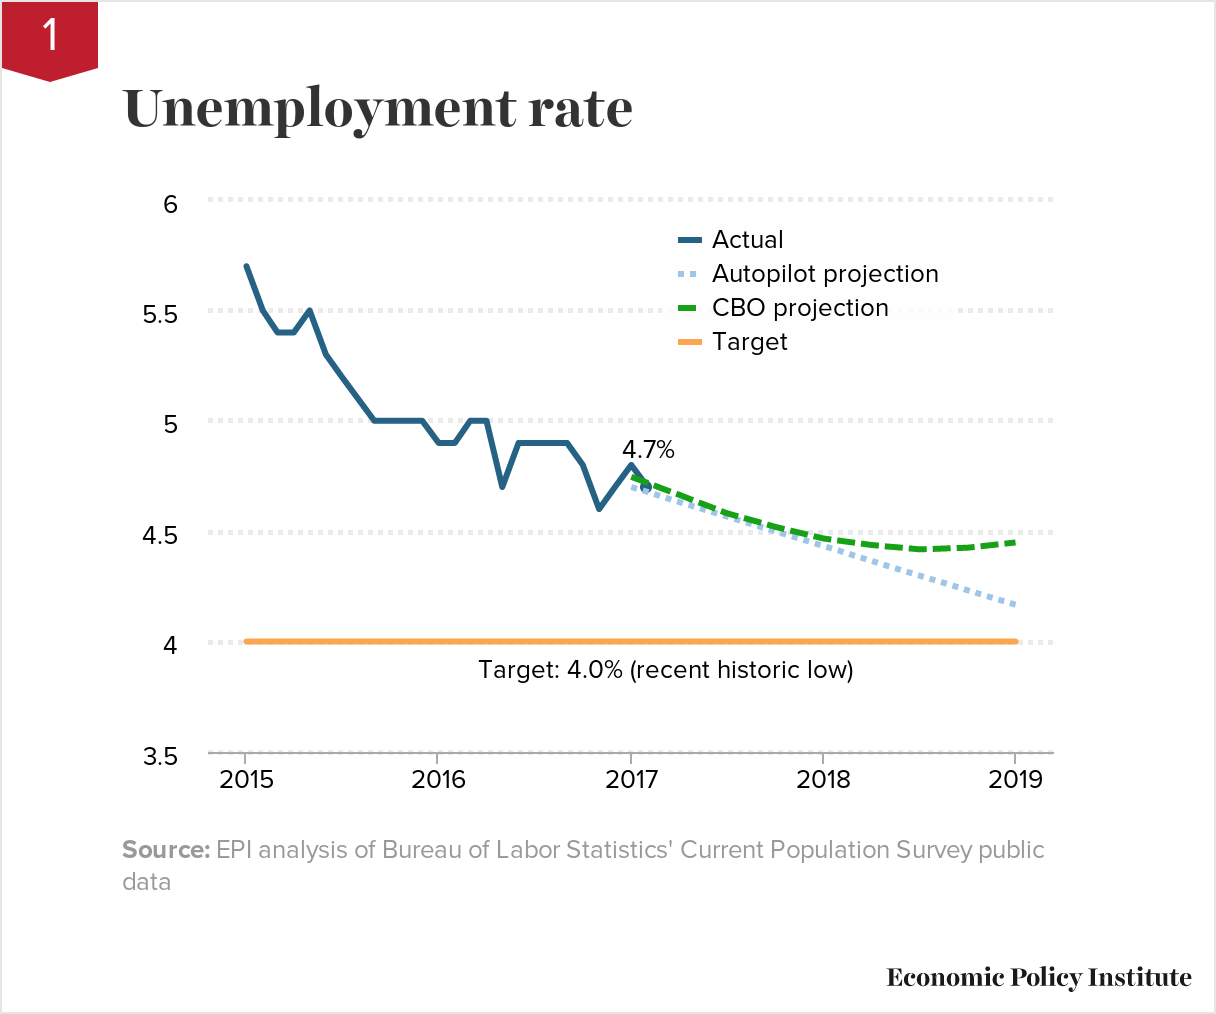
Unemployment rate
Current: 4.7%
Autopilot: 4.7%
Target: 4.0%
During the Great Recession, the unemployment rate shot up as millions of working people lost their jobs, but it has fallen steadily since late 2010. As the labor market has improved, the rate at which unemployment has fallen has gradually slowed, and this should continue. If the unemployment rate continued to fall at the current pace of improvement, it would hit 4.0 percent in 2019.
Most forecasters, including the Congressional Budget Office (CBO) think that unemployment cannot, or at least will not, fall much further from today’s level. The expectation behind this stalled downward march in projected unemployment is an assumption that the Federal Reserve will slow the economy by raising interest rates. And the Fed certainly could raise rates (regardless of whether it should raise rates). The CBO projection has the unemployment rate leveling off before reaching recent historical lows. However, we think it is important to compare performance on unemployment with EPI’s autopilot projection. Our projection shows that unemployment could hit its recent historic low of 4.0 percent by January 2019 if it continued to fall at the same rate it did from the end of 2015 to the end of 2016.
It is not obviously unrealistic to think that the unemployment rate could reach 4.0 percent. During the late 1990s and 2000s, the unemployment rate dipped below 4.0 percent for five months, and it averaged 4.0 percent in the full year 2000. During this period, inflation-adjusted wages rose across the board—for the only time in the last generation. This should be the type of labor market we aspire to have. Decisions by the Federal Reserve or by fiscal policymakers that thwart progress toward this goal would rob tens of millions of workers of the opportunity to be pulled back into the labor force or enjoy stronger wage growth.
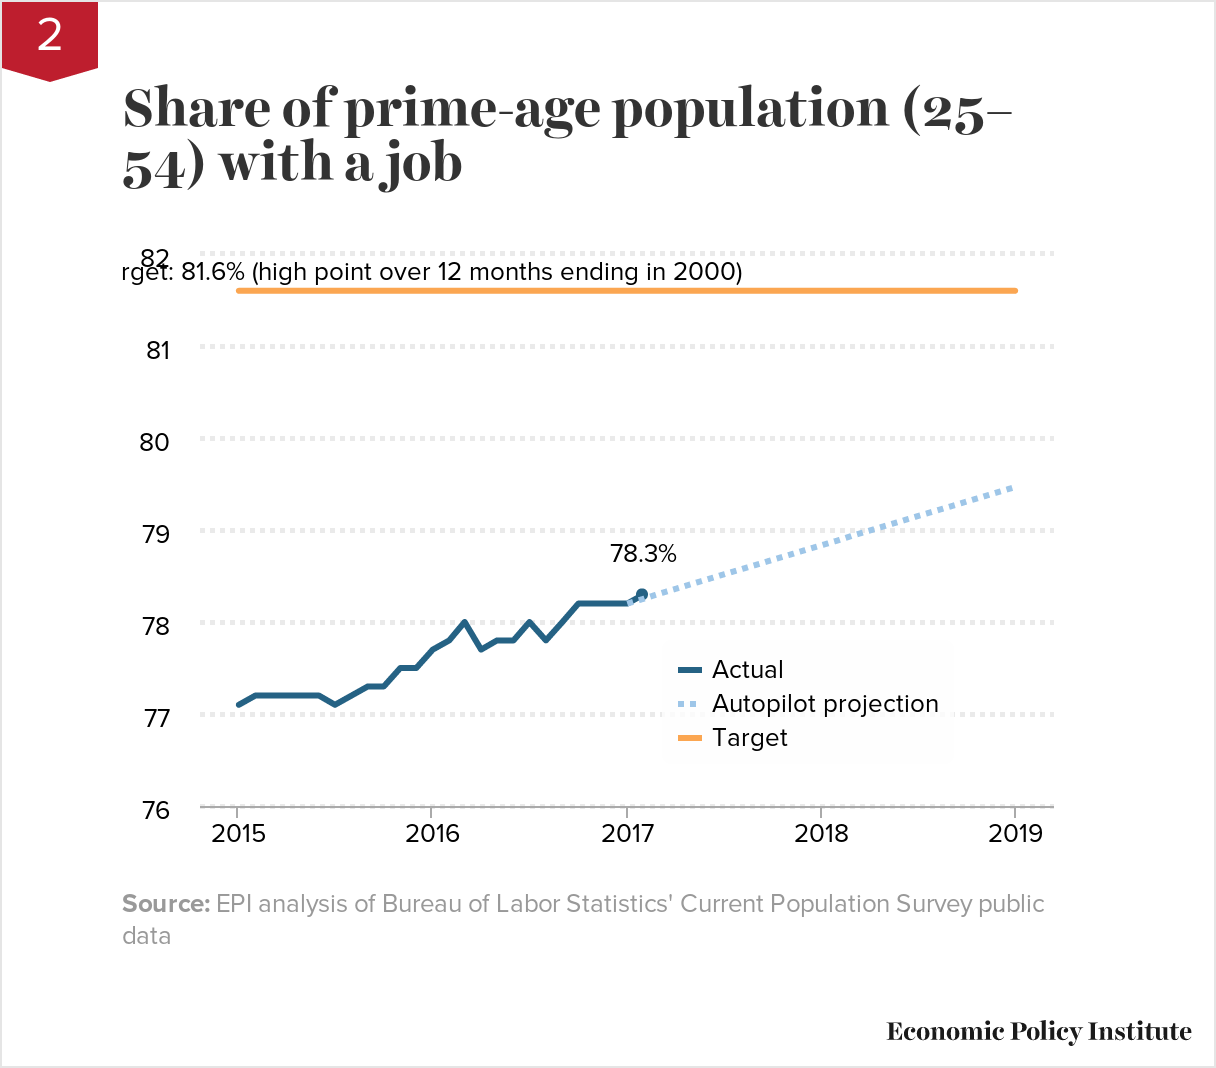
Prime-age employment-to-population ratio
Current: 78.3%Autopilot: 78.3%Target: 81.6%
After falling dramatically in the Great Recession, the share of the prime-age population with a job has been recovering steadily, since 2011. Preexisting trends would sustain this recovery and drive the share to 79.5 percent by 2019.
The prime-age employment-to-population ratio (EPOP), which shows the share of the population age 25 to 54 with a job, is a key indicator of labor market health. Our projection shows that if the prime-age EPOP continued on the same pace of recovery as it has over the last year, it would reach 79.5 percent in 2019. Ambitious policymakers should aim for further improvement, as the EPOP has averaged as high as 81.6 percent (as it did over the 12-month period ending in 2000). At the current rate of improvement, it will not hit that 81.6 percent benchmark until 2022.
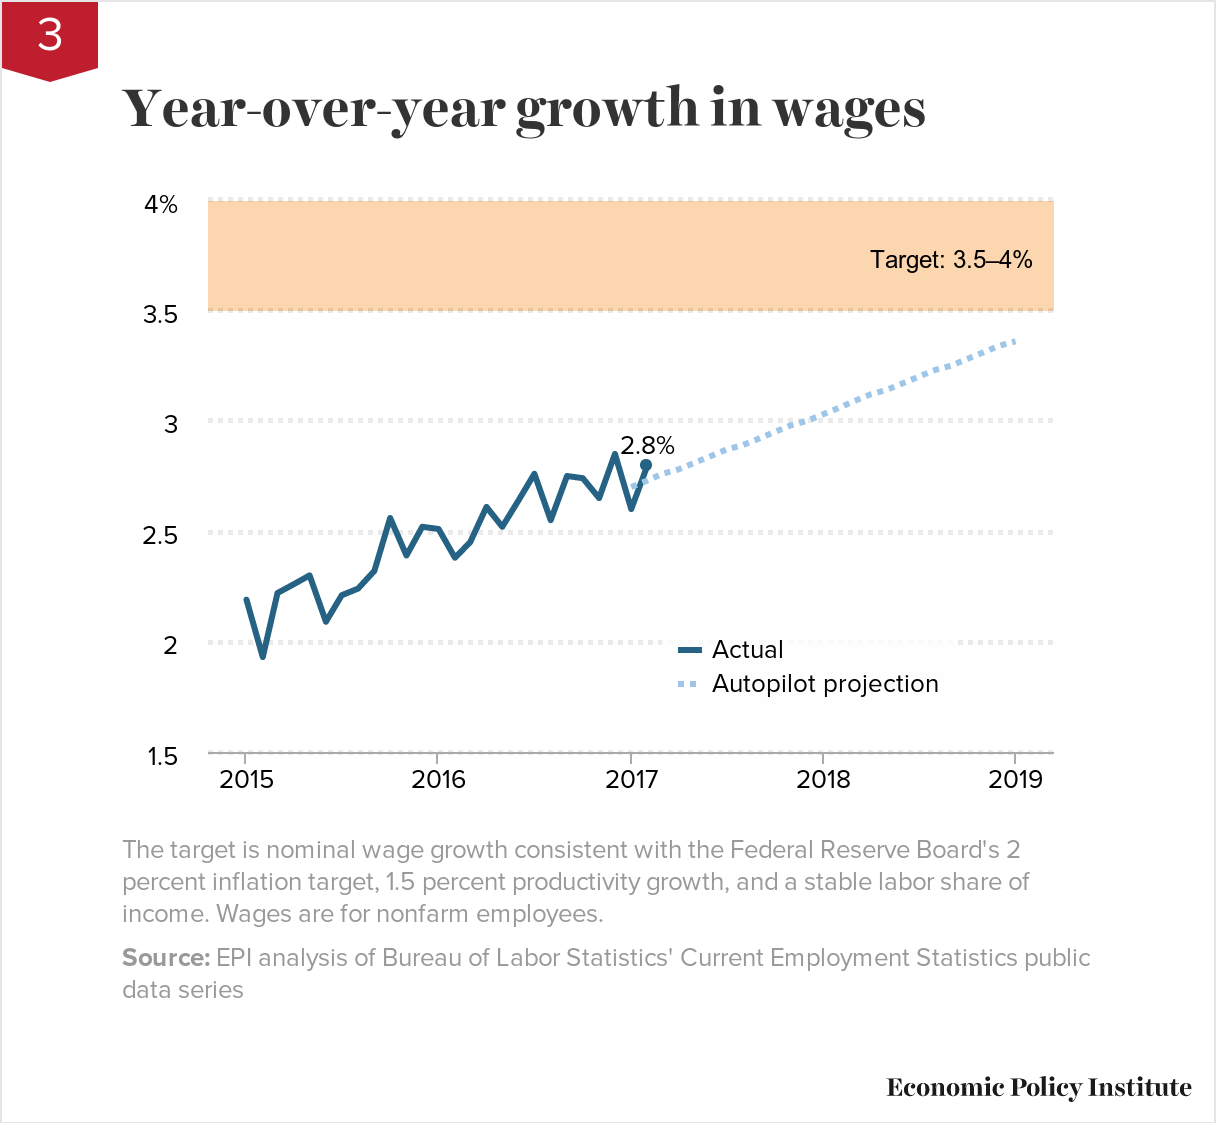
Nominal wage growth
Current: 2.8%Autopilot: 2.7%Target: 3.5–4%
Wage growth was sluggish and essentially unchanged for years following the Great Recession but has picked up slightly, to an average of 2.6 percent in 2016. As the economy continues to tighten, preexisting trends indicate that wage growth will continue to improve. At the current pace of improvement, by 2019 we should be significantly closer to the Fed’s wage-growth target of 3.5 to 4 percent.
The horizontal shaded area in the chart represents growth of 3.5 percent to 4 percent—nominal wage growth consistent with the Fed’s 2 percent inflation target and a labor share of income at historic norms (given 1.5 percent trend productivity growth). We would need to see consistent wage growth above this range before there is a hint of upward pressure on prices stemming from too-tight labor markets. Hence, as long as wage growth is below this healthy target, policymakers—including the Fed, President Trump, and Congress—should do nothing to slow economic growth.
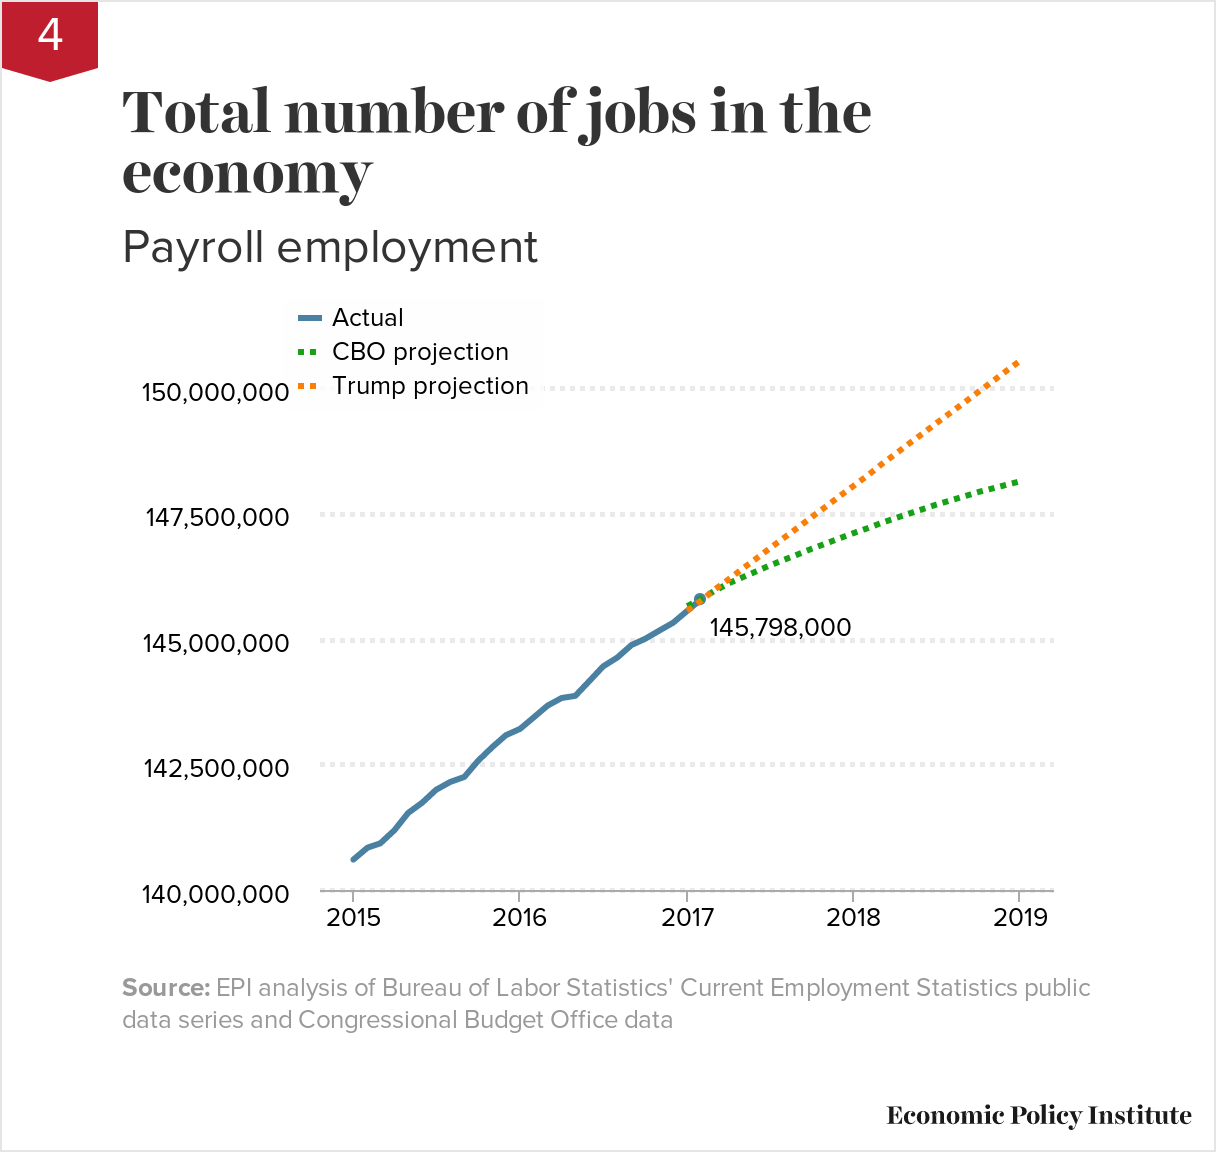
Monthly growth in payroll employment
Current: 235,000Target: 208,000
After shedding millions of jobs in the Great Recession, the economy has added jobs every month since 2010. Factoring in both a return to what it considers full employment as well as demographic trends, the CBO estimates the economy will have 148 million jobs by 2019.
On the graph, the green line represents CBO’s projection for payroll employment. In January 2017, President Trump announced a new goal to create 25 million new jobs in the next 10 years, as shown by the orange line. Creating 25 million new jobs in a decade would require adding an average of 208,000 every month. In the long run, this is clearly unrealistic. As explained by a January 2017 EPI blog post, Trump’s job goals would require massive immigration or forcing elderly Americans to work at unprecedented rates. For the next two years, however, adding 208,000 jobs a month would still leave the economy below historic peaks in employment. Because monthly new job numbers in Trump’s projected range are clearly possible in the next two years, the Trump projection line approximates the autopilot projection line against which to measure job growth.
*January 2017 monthly growth in payroll employment value represents 3-month average from November 2016 to January 2017.
Spread the word