
We’re (Not) Running Out of Water – A Better Way to Measure Water Scarcity
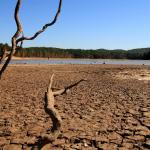
Water crises seem to be everywhere. In Flint, the water might kill us. In Syria, the worst drought in hundreds of years is exacerbating civil war. But plenty of dried-out places aren’t in conflict. For all the hoopla, even California hasn’t run out of water.
There’s a lot of water on the planet. Earth’s total renewable freshwater adds up to about 10 million cubic kilometers. That number is small, less than one percent, compared to all the water in oceans and ice caps, but it’s also large, something like four trillion Olympic-sized swimming pools. Then again, water isn’t available everywhere: across space, there are deserts and swamps; over time, seasons of rain and years of drought.
Also, a water crisis isn’t about how much water there is – a desert isn’t water-stressed if no one is using the water; it’s just an arid place. A water shortage happens when we want more water than we have in a specific place at a specific time.
So determining whether a given part of the world is water-stressed is complicated. But it’s also important: we need to manage risk and plan strategically. Is there a good way to measure water availability and, thereby, identify places that could be vulnerable to water shortages?
Because it measures whether we have enough, the ratio of water use to water availability is a good way to quantify water shortage. Working with a group of collaborators, some of whom run a state-of-the-art global water resources model and some of whom work on the ground in water-scarce places, I quantified just how much of our water we’re using on a global basis. It was less straightforward than it sounds.
Water consumption, water availability
We use water for drinking and cleaning and making clothes and cars. Mostly, however, we use water to grow food. Seventy percent of the water we pull from rivers, streams and aquifers, and nearly 90 percent of the water we “use up,” is for irrigation.
How much water we use hinges on what you mean by “use.” Tallying the water we withdraw from rivers, lakes and aquifers makes sense for homes and farms, because that’s how much water runs through our taps or sprinkles onto farm fields.
But an awful lot of that water flows down the drain. So it can be, and probably is, used again. In the U.S., wastewater from most homes flows to treatment plants. After it’s cleaned, it’s released to rivers or lakes that are likely someone else’s water source. My tap water in Minneapolis comes from the Mississippi River, and all the water I flush goes through a wastewater treatment plant and back into the Mississippi River, the drinking water source for cities all the way to New Orleans.
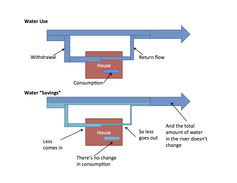
Water-saving products, such as low-flow faucets and appliances, reduce the amount of what that is used on site, most of which is sent back into watersheds. The water in a home consumed, through evaporation for instance, remains the same. Kate Brauman, Author provided
With most water “saving” technologies, less water is taken out of a river, but that also means that less water is put back into the river. It makes a difference to your water bill – you had to pump less water! However, your neighbor in the town downstream doesn’t care if that water ran through your tap before it got to her. She cares only about how much total water there is in the stream. If you took out less but also put back less so the total didn’t change, it doesn’t make a difference to her.
So in our analysis, we decided to count all the water that doesn’t flow downstream, called water consumption. Consumed water isn’t gone, but it’s not around for us to use again on this turn of the water cycle.
For example, when a farmer irrigates a field, some of the water evaporates or moves through plants into the atmosphere and is no longer available to be used by a farm downhill. We tallied that water, not the runoff (which might go to that town downstream, or to migrating birds!).
Our model calculated water consumption by people and agriculture all over the world. It turns out that if a lot of water is being consumed in a watershed, meaning that it’s used and can’t be immediately reused, it’s being used for irrigation. But irrigated agriculture is super-concentrated – 75 percent of water consumption by irrigation occurs in just 6 percent of all the watersheds in the world. So in many watersheds, not much water is consumed at all – often it’s fed back into the watershed after it’s used.
On the other side of the ledger, we had to keep track of how much water is available. Water availability fluctuates, with flood peaks and dry seasons, so we counted up available water each month, not just in average years but during wet and dry years as well. And we counted groundwater as well as surface water from rivers, lakes and wetlands.
In many places, rainfall and snowfall replenish groundwater each year. But in other places, like the High Plains aquifer in the central United States, groundwater reserves were formed long ago and effectively aren’t recharged. This fossil groundwater is a finite resource, so using it is fundamentally unsustainable; for our measure of water shortage, we considered only renewable groundwater and surface water.
Water shortage or water stress?
We analyzed how much of the available renewable water in a watershed we’re using up for over 15,000 watersheds worldwide for each month in wet and in dry years. With those data in hand, my colleagues and I started trying to interpret it. We wanted to identify parts of the world facing water stress all the time, during dry seasons, or only in drought years.
But it turns out that identifying and defining water stress is tough, too. Just because a place is using up a lot of its water – maybe a city pulls most of the water out of a river every summer – that doesn’t necessarily mean it is water-stressed. Culture, governance and infrastructure determine whether a limit on water availability is problematic. And this context influences whether consuming 55 percent of available water is demonstrably worse than using 50 percent, or whether two short months of water shortage is twice as bad as one. Demarcating water scarcity transforms water shortage into a value-laden evaluation of water stress.
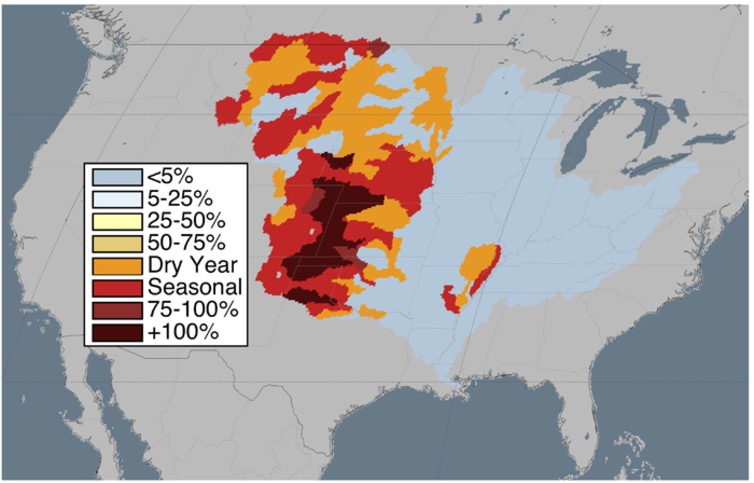
An example of a more detailed and localized measure of freshwater scarcity risk that uses data from dry seasons and dry years. Blue areas have the lowest areas of risk because they use less than five percent of their annually renewable water. The darkest areas use more than 100 percent of their renewable freshwater because they tap groundwater that isn’t replenished. Kate Braumen, Author provided
To evaluate whether a watershed is stressed, we considered the common use-to-availability thresholds of 20 percent and 40 percent to define moderate and severe water scarcity. Those levels are most often attributed to Malin Falkenmark, who did groundbreaking work assessing water for people. In doing our research, we did some digging and found Waclaw Balcerski, however. His 1964 study (published in a Hungarian water resources journal) of postwar Europe showed the cost of building water infrastructure increased in countries withdrawing more than 20 percent of their available water. Interesting, but hardly a universal definition of water stress.
A nuanced picture
In the end, we sidestepped definitions of stress and opted to be descriptive. In our study, we decided to report the fraction of renewable water used up by people annually, seasonally, and in dry years.
What does this metric reveal? You’re probably in trouble if you’re using up 100 percent of your water, or even 75 percent, since there’s no room for error in dry years and there’s no water in your river for fish or boats or swimmers. But only local context can illuminate that.
We found that globally, just two percent of watersheds use more than 75 percent of their total renewable water each year. Most of these places depend on fossil groundwater and irrigate heavily; they will run out of water.
More of the places we recognize as water-limited are seasonally depleted (nine percent of watersheds), facing regular periods of water shortage. Twenty-one percent of the world’s watersheds are depleted in dry years; these are the places where it’s easy to believe there’s plenty of water to do what we like, yet people struggle semi-regularly with periods of shortage.
We also found that 68 percent of watersheds have very low depletion; when those watersheds experience water stress, it is due to access, equality and governance.
To our surprise, we found that no watersheds were moderately depleted, defined as watersheds that in an average year are using up half their water. But it turns out that all of those watersheds are heavily depleted sometimes – they have months when nearly all the water is consumed and months when little is used.
Managing water to meet current and future demand is critical. Biophysical indicators, such as the ones we looked at, can’t tell us where a water shortage is stressful to society or ecosystems, but a good biophysical indicator can help us make useful comparisons, target interventions, evaluate risk and look globally to find management models that might work at home.
Kate Brauman is Lead Scientist at the Institute on the Environment, University of Minnesota