
State Unemployment Rates by Race and Ethnicity Show Recovery Expanding but Still Leaving Stubborn Pockets of High Unemployment
In March 2017, the national unemployment rate was 4.5 percent, a slight decrease from 4.7 percent at the end of the fourth quarter in December 2016. State unemployment rates in March ranged from a low of 2.6 percent in Colorado to a high of 6.7 percent in New Mexico.1 According to an earlier EPI analysis, from December 2016 to March 2017, 36 states and the District of Columbia saw their unemployment rates decline, 10 states saw unemployment rates rise, and 4 states saw no change. In the first quarter of 2017, African Americans had the highest unemployment rate nationally, at 8.0 percent, followed by Latinos (5.7 percent), whites (3.8 percent), and Asians (3.3 percent).
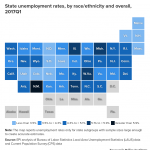
State unemployment rates, by race and ethnicity
This report provides unemployment rates, by race and ethnicity, and racial unemployment rate gaps, by state, for the first quarter of 2017. We provide this analysis on a quarterly basis to generate a sample size large enough to create reliable estimates of unemployment rates by race at the state level. We only report estimates for states where the sample size of these subgroups is large enough to create an accurate estimate.
Trends among whites
In the first quarter of 2017, the white unemployment rate was lowest in South Dakota (1.7 percent) and highest in New Mexico (5.2 percent), as shown in the interactive map and underlying data table, which present state unemployment rates by race and ethnicity. South Dakota has had the lowest white unemployment rate for seven quarters in a row, while New Mexico replaces West Virginia as the state with the highest white unemployment rate.
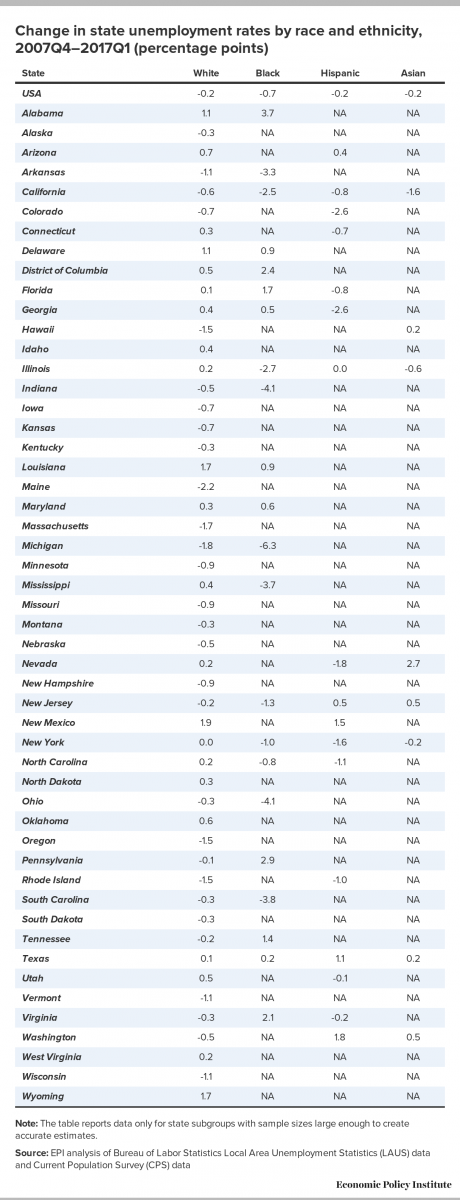
Table 1 displays changes in state unemployment rates by race and ethnicity from the fourth quarter of 2007 to the first quarter of 2017. New Mexico is the state where the white unemployment rate is most elevated above its pre-recession level, 1.9 percentage points higher than in the fourth quarter of 2007. The white unemployment rate is at or below its pre-recession level in 29 states, with the largest decreases since the fourth quarter of 2007 in Maine (-2.2 percentage points), Michigan (-1.8 percent), Massachusetts (-1.7 percentage points), Hawaii (-1.5 percentage points), Oregon (-1.5 percentage points), and Rhode Island (-1.5 percentage points). The white unemployment rate is above but within 0.5 percentage point of its pre-recession level in another 15 states.
Table 1 displays changes in state unemployment rates by race and ethnicity from the fourth quarter of 2007 to the first quarter of 2017. New Mexico is the state where the white unemployment rate is most elevated above its pre-recession level, 1.9 percentage points higher than in the fourth quarter of 2007. The white unemployment rate is at or below its pre-recession level in 29 states, with the largest decreases since the fourth quarter of 2007 in Maine (-2.2 percentage points), Michigan (-1.8 percent), Massachusetts (-1.7 percentage points), Hawaii (-1.5 percentage points), Oregon (-1.5 percentage points), and Rhode Island (-1.5 percentage points). The white unemployment rate is above but within 0.5 percentage point of its pre-recession level in another 15 states.
Trends among African Americans
During the first quarter of 2017, among states, the African American unemployment rate was lowest in Arkansas (5.6 percent) and highest in Tennessee (10.9 percent); in the District of Columbia, it was 12.2 percent. The District of Columbia also had the highest black unemployment rate during the previous quarter, though among states Illinois had the highest black unemployment rate (11.3 percent) in the fourth quarter of 2016.
In the first quarter of 2017, of the 22 states with African American estimates (23 counting the District of Columbia), 20 had African American unemployment rates at or below 10 percent; in 11 of these states, the rate was lower than the first quarter national average for African Americans (8.0 percent).
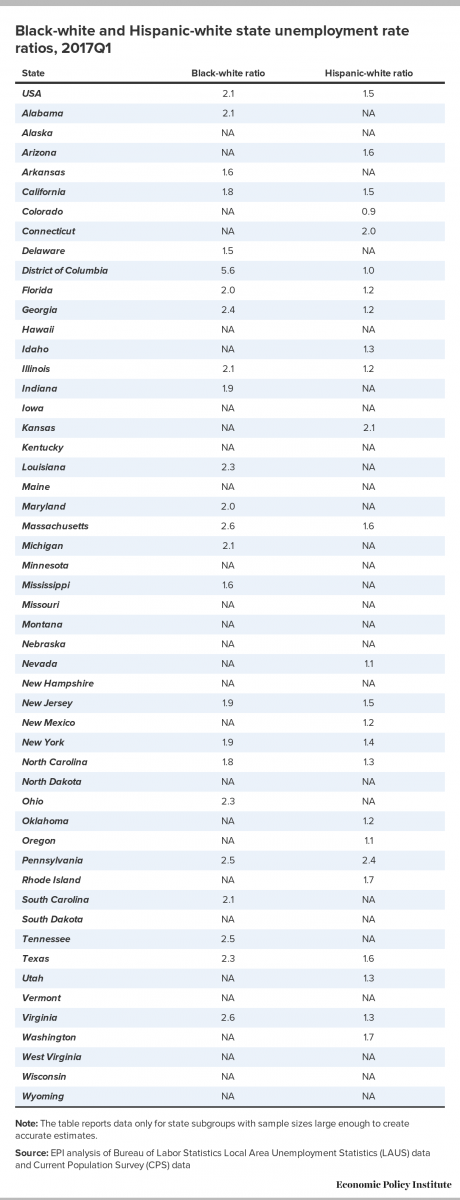
Table 2 displays the black-white and Hispanic-white unemployment rate ratios in the first quarter of 2017. Delaware’s black-white unemployment rate ratio was the smallest in the country (of the states with data). In Delaware, the black unemployment rate was 1.5 times the white rate, up from 1.4 times the white rate during the previous quarter. Delaware also had the smallest black-white unemployment rate ratio in the last quarter of 2016. As in the previous two quarters, the largest gap was in the District of Columbia, where the black unemployment rate was 5.6 times the white rate. The next highest black-white unemployment ratios were in Massachusetts and Virginia (both at 2.6 times the white rate).
With regard to recovery, the African American unemployment rate is at or below its pre-recession level in 11 states: Arkansas, California, Illinois, Indiana, Michigan, Mississippi, New Jersey, New York, North Carolina, Ohio, and South Carolina. However, a return to pre-recession levels in these states is barely a recovery: in all of these states, black unemployment rates were above 8.0 percent before the recession. Of the states where the black unemployment rate has recovered, Illinois, Michigan, and Ohio have black unemployment rates higher than the first quarter national average for African Americans (8.0 percent). The black unemployment rate is higher than but within 0.5 percentage point of its pre-recession level in Georgia and Texas. The black unemployment rate remains most elevated above its pre-recession level in Alabama (3.7 percentage points higher).
Trends among Hispanics
The Hispanic unemployment rate was highest in Pennsylvania (9.8 percent) and lowest in the District of Columbia (2.2 percent); among states it was lowest in Colorado (estimates are available for 23 states and the District of Columbia). Pennsylvania has had the highest Hispanic unemployment rate for three consecutive quarters and was the only state in the first quarter of 2017 with a Hispanic unemployment rate above 9 percent. Colorado replaces Utah as the state with the lowest Hispanic unemployment rate.
The Hispanic unemployment rate is at or below its pre-recession level in eleven states: California, Colorado, Connecticut, Florida, Georgia, Nevada, New York, North Carolina, Rhode Island, Utah, and Virginia. The Hispanic unemployment rate is above but within 0.5 percentage point of its pre-recession level in Arizona, Illinois, and New Jersey. The Hispanic unemployment rate was most elevated above its pre-recession level in Washington (1.8 percentage points), New Mexico (1.5 percentage points), and Texas (1.1 percentage points).
The Hispanic-white unemployment rate ratio is lowest in Colorado (0.9) and highest in Pennsylvania (2.4). This is the second consecutive quarter Pennsylvania has had the largest gap between Hispanic and white unemployment rates, despite a decrease in the Hispanic unemployment rate while the white rate was essentially unchanged from the previous quarter.
Trends among Asians
Asian unemployment estimates are available for 12 states. The Asian unemployment rate was lowest in Massachusetts (2.0 percent) and highest in Nevada (5.7 percent). Nevada has had the highest Asian unemployment rate for three consecutive quarters and was the only state with an Asian unemployment rate above 5 percent. The Asian unemployment rate was below its pre-recession level in California, Illinois, and New York. In Hawaii, New Jersey, Texas, and Washington, it was above but within 0.5 percentage point of its pre-recession level. The Asian unemployment rate was most elevated above its pre-recession level in Nevada (2.7 percentage points higher).
Methodology
The unemployment rate estimates in this issue brief are based on the Local Area Unemployment Statistics (LAUS) and the Current Population Survey (CPS) from the Bureau of Labor Statistics. The overall state unemployment rate is taken directly from the LAUS. CPS 6-month ratios are applied to LAUS data to calculate the rates by race and ethnicity. For each state subgroup, we calculate the unemployment rate using the past 6 months of CPS data. We then find the ratio of this subgroup rate to the state unemployment rate using the same period of CPS data. This gives us an estimate of how the subgroup compares with the state overall.
While this methodology allows us to calculate unemployment-rate estimates at the state level by race by quarter, it is less precise at the national level than simply using the CPS. Thus, the national-level estimates may differ from direct CPS estimates.
In many states, the sample sizes of particular subgroups are not large enough to create accurate estimates of their unemployment rate. We report data only for groups that had, on average, a sample size of at least 700 in the labor force for each six-month period.
Endnote
1. Bureau of Labor Statistics, “State Employment and Unemployment Summary” (Economic News Release), April 21, 2017.