
Extreme Maps
Using data from the 2012, 2014, and 2016 election cycles, Extreme Maps finds that partisan bias resulting largely from the worst gerrymandering abuses in just a few battleground states provides Republicans a durable advantage of 16-17 seats in the current Congress, representing a significant portion of the 24 seats Democrats would need to gain control of the House in 2020. These "extreme maps" were all drawn in states under single-party control; the report finds that conversely, maps drawn by independent commissions, courts, or split-party state governments had significantly less partisan bias in their maps.
EXECUTIVE SUMMARY
Every decade, states redraw congressional maps after the decennial census. Redistricting allows districts to be rebalanced, ensuring in theory that all districts are both equally populated and representative. But redistricting also provides an enormous opportunity for politicians: the chance to redraw a district map means the opportunity to gerrymander and to manipulate a map to create a more favorable set of districts for themselves and for their party.
Congressional maps were last redrawn en masse after the 2010 Census, and accusations of gerrymandering in states nationwide soon followed. Complaints about redistricting abuses ran the gamut from allegations that some maps had been drawn to favor incumbents to outrage at the sprawling and unnatural shapes of districts in others.
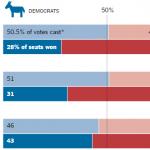
This report focuses on one of the most egregious of these abuses: the manipulation of district lines to give the party drawing the map a share of seats grossly at odds with statewide election results, thus ensuring that one party is overrepresented and the other underrepresented in a delegation.
To gauge where this type of gerrymandering is taking place and its magnitude, this report used election results in states with six or more congressional districts to assess the extent and the durability of “partisan bias” — the degree of systematic advantage one party receives over another in turning votes into seats. For this analysis, this report used multiple quantitative measures of partisan bias to examine the 2012, 2014, and 2016 congressional elections. It also looked at the relationship between the body that drew the maps and the degree of bias observed. It is among the first analyses to use 2016 electoral data to examine maps, and the first report of its kind to measure maps using multiple measures of bias and to identify the handful of single-party controlled states that are responsible for nearly all of the bias in this decade’s maps.
Our key findings include:
This decade’s congressional maps are consistently biased in favor of Republicans.
- In the 26 states that account for 85 percent of congressional districts, Republicans derive a net benefit of at least 16-17 congressional seats in the current Congress from partisan bias. This advantage represents a significant portion of the 24 seats Democrats would need to pick up to regain control of the U.S. House of Representatives in 2018.
Just seven states account for almost all of the bias.
- Michigan, North Carolina, and Pennsylvania consistently have the most extreme levels of partisan bias. Collectively, the distortion in their maps has accounted for seven to ten extra Republican seats in each of the three elections since the 2011 redistricting, amounting to one-third to one-half of the total partisan bias across the states we analyzed.
- Florida, Ohio, Texas, and Virginia have less severe partisan bias but jointly account for most of the remaining net extra Republican seats in the examined states.
Single-party control of the redistricting process is closely linked with biased maps.
- The seven states with high levels of partisan bias are all states where one political party had sole control of the redistricting process. Court-ordered modifications to maps in Florida, Texas, and Virginia — all originally drawn under sole Republican control — have reduced but not entirely curbed these states’ partisan bias.
- States where Democrats had sole control of redistricting have high partisan bias within state congressional delegations, but the relatively small number of districts in these states creates a much smaller effect on partisan bias in the House overall.
- By contrast, maps drawn by commissions, courts, and split-control state governments exhibited much lower levels of partisan bias, and none had high levels of bias persisting across all three of the elections since the 2011 round of redistricting.
There is strong evidence that the bias in this decade’s congressional maps is not accidental. With the exception of Texas, all of the most biased maps are in battleground states. These states routinely have close statewide elections and a fairly even distribution of partisanship across most of the state — two factors that do not naturally suggest that there should be a large and durable underrepresentation of one political party.