
A Better Way To Think About June’s Jobs Numbers
You’ve probably seen some headlines today about the latest unemployment rate (3.7 percent) or others saying 224,000 jobs were added in June. Those are the numbers from the Bureau of Labor Statistics’ monthly jobs report, published this morning, that get the bulk of the media coverage. And that makes a certain amount of sense — they are important measures of our economy’s health and inform policymakers: Keeping the unemployment rate stable is one of the Federal Reserve’s goals when setting interest rates.
But without the right context, they’re a bit misleading. Let’s start with job growth.
Number of jobs added or lost
Monthly change in nonfarm payroll employment, seasonally adjusted
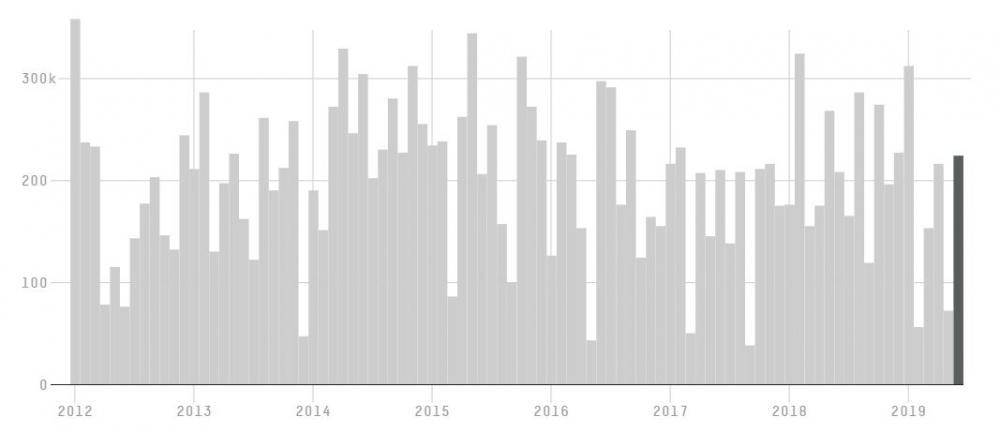
Charts similar to this one frequently make the rounds early on “jobs Friday” (the report comes out each month, on either the first or second Friday). It’s a look at the number of jobs that the U.S. economy gained or lost on balance every month, with the final bar () representing the newest information, the change in jobs for the month that precedes the report’s release.
What usually goes unreported is how uncertain the length of that last bar is. The number behind it is an estimate that comes with a range: The bar could be taller by 120,000 jobs or shorter by 120,000 jobs … there’s a 90 percent chance that the actual number is somewhere in that pretty sizable span. So, a report might announce that jobs were lost one month (a worrying trend) when actually the economy experienced a small bump (that happened in September of 2017).
Fortunately, the agency updates those numbers, and they become more accurate over time. Each month’s figure is revised twice, first in the next jobs report and finally in the report after that. Entire years of monthly data are also adjusted up or down during an annual benchmarking process, based on records of unemployment benefits.
Let’s look at the chart again, this time with the updates highlighted.
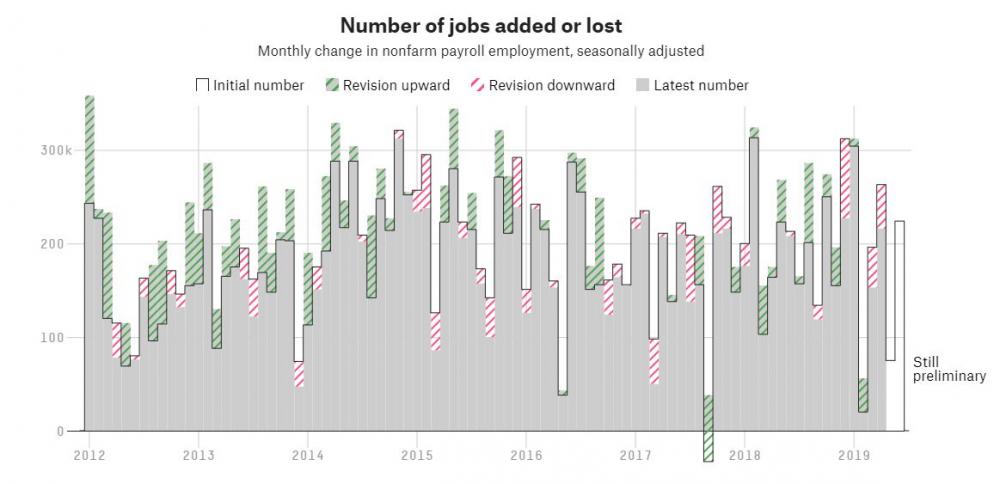
In the most recent report, the number for April was revised for the second time, to 216,000 — 47,000 less than was initially reported.
Jobs numbers are calculated from a nationwide survey of about 150,000 businesses and government agencies. The other high-profile number that’s announced at the same time, the unemployment rate — referred to as “U-3” — comes from a different survey of about 60,000 households — and isn’t subject to monthly revisions.
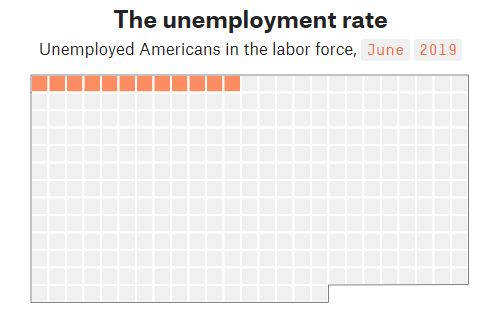
There are two versions of the unemployment rate — one that’s seasonally adjusted (that’s the one that gets all the headlines) and one that’s not. The BLS highlights the former in its communications with the press because seasonal adjustment is what allows us to compare the rate from month to month. Adjusting smooths out the predictable peaks and valleys that happen each year (such as the boom in retail employment ahead of the holidays). But if you’re not looking at change over time, the non-adjusted number can be considered a more true-to-life snapshot of unemployment in the previous month. For June, it was 3.8 percent.
To understand how the BLS measures the unemployment rate, there’s an important concept to get familiar with first: the civilian labor force. The government considers people of working age to be a part of it if they have a job or are actively looking for one (i.e., have searched in the past four weeks). Last month, roughly 317 Americans were considered in the labor force out of every 500 tracked by the BLS for its employment statistics (those who are 16 or older and are not in the military,1 prison, a long-term care facility or otherwise institutionalized). And roughly 12 of those 317 didn’t have a job, which gives us the unadjusted unemployment rate of 3.8 percent.
The unemployment rate, adjusted or otherwise, is a useful metric for economists, but it doesn’t quite capture how we tend to think about employment and joblessness in our day-to-day lives. What about your cousin who wants a gig but gave up looking a few months back? As far as the U-3 is concerned, your cousin isn’t in the labor force, so he isn’t part of the official unemployment rate.
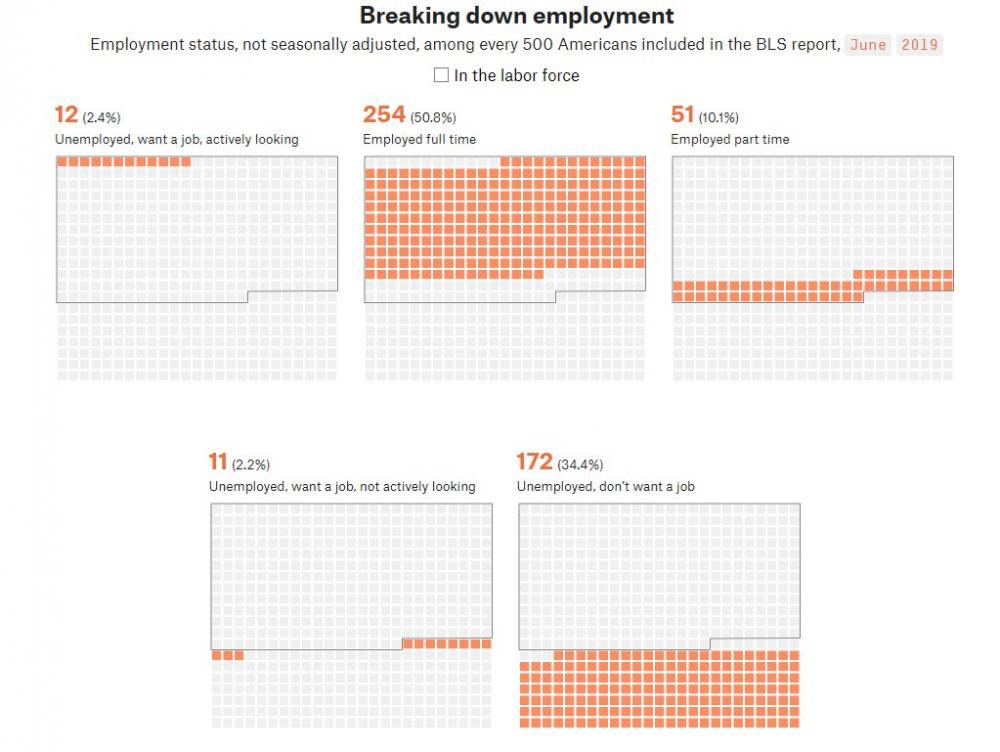
As with job growth, the BLS report contains more about employment than just the headline figure. The number of people who aren’t in the labor force is tracked, for instance, and broken down into those who want a job and those who don’t. The BLS also differentiates between full-time and part-time workers. In June, this was the employment status of every 500 people included in the report:
The BLS has a broader measure of unemployment — the U-6 — which includes people counted in the official jobless rate, those who've tried to find a job in the past year but haven't looked in the past four weeks, and part-time workers who want a full-time job. June’s unadjusted U-6 was 7.5 percent. That’s 3.7 percentage points higher than the unadjusted unemployment rate.
So when the next jobs report comes out on Aug 2, there are a couple of things to keep in mind. That unemployment rate in the headlines? It doesn’t really take into account your cousin or anyone else who has quit job-hunting for a while or is working less than they want to. And that job growth number? Take it with +/- 120,000 grains of salt.
Julia Wolfe is a visual journalist for FiveThirtyEight.