
Voter Purge Rates Remain High, Analysis Finds

Using data released by the federal Election Assistance Commission (EAC) in June, a new Brennan Center analysis has found that between 2016 and 2018, counties with a history of voter discrimination have continued purging people from the rolls at much higher rates than other counties.
This phenomenon began after the Supreme Court’s 2013 ruling in Shelby County v. Holder, a decision that severely weakened the protections of the Voting Rights Act of 1965. The Brennan Center first identified this troubling voter purge trend in a major reportreleased in July 2018.
Before the Shelby County decision, Section 5 of the Voting Rights Act required jurisdictions with a history of discrimination to submit proposed changes in voting procedures to the Department of Justice or a federal court for approval, a process known as “preclearance.”
After analyzing the 2019 EAC data, we found:
- At least 17 million voters were purged nationwide between 2016 and 2018, similar to the number we saw between 2014 and 2016, but considerably higher than we saw between 2006 and 2008;
- The median purge rate over the 2016–2018 period in jurisdictions previously subject to preclearance was 40 percent higher than the purge rate in jurisdictions that were not covered by Section 5 of the Voting Rights Act;
- If purge rates in the counties that were covered by Section 5 were the same as the rates in non-Section 5 counties, as many as 1.1 million fewer individuals would have been removed from voter rolls between 2016 and 2018.
Methodology
Every two years, the EAC administers a survey to election officials around the country known as the Election Administration and Voting Survey (EAVS). The survey includes a host of questions about the state of voter registration in the jurisdiction and the experience of the most recent federal election. Jurisdictions are requested to report on information including how many new registrations occurred between the federal elections, the number of ballots cast on election day, and the number of polling sites that were open on election day. The jurisdictions are also asked to report how many voters were removed from the registration rolls — or “purged” — over the two-year period that preceded the most recent federal election. These data formed the backbone of our statistical analysis in last year’s report, and we use them again here.
All election jurisdictions in the country are asked to respond to the EAVS survey every two years, but in 2018, some in Alabama and Texas did not report their purge numbers. Although this makes the data less than ideal, the EAC survey remains the best source for nationwide information on voter purges.
We calculate purge rates as the number of voters removed between 2016 and 2018 divided by the sum of total voters registered as of the 2018 election and the number removed. In other words,
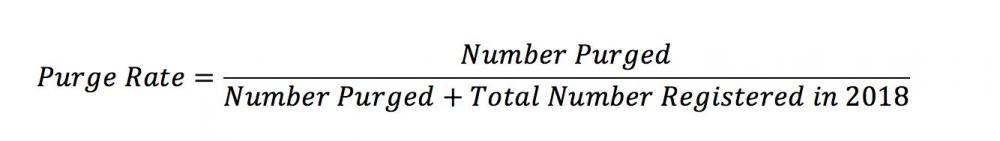
As with our report last year, we report the median purge rate when discussing aggregate purge rates. We use the median because of the nature of the data: using the mean purge rate would leave our analysis more susceptible to outliers.
Why purges can be problematic
To be sure, there are many good reasons for a voter to be purged. For instance, if a voter moves from Georgia to New York, they are no longer eligible to cast a ballot in the Peach State. As such, they should be removed from Georgia’s voter rolls. Similarly, voters who have passed away should be removed from the rolls. Reasonable voter list maintenance ensures voter rolls remain up to date.
Problems arise when states remove voters who are still eligible to vote. States rely on faulty data that purport to show that a voter has moved to another state. Oftentimes, these data get people mixed up. In big states like California and Texas, multiple individuals can have the same name and date of birth, making it hard to be sure that the right voter is being purged when perfect data are unavailable. Troublingly, minority voters are more likely to share names than white voters, potentially exposing them to a greater risk of being purged. Voters often do not realize they have been purged until they try to cast a ballot on Election Day — after it’s already too late. If those voters live in a state without election day registration, they are often prevented from participating in that election.
Approximately 17 million purged between 2016 and 2018
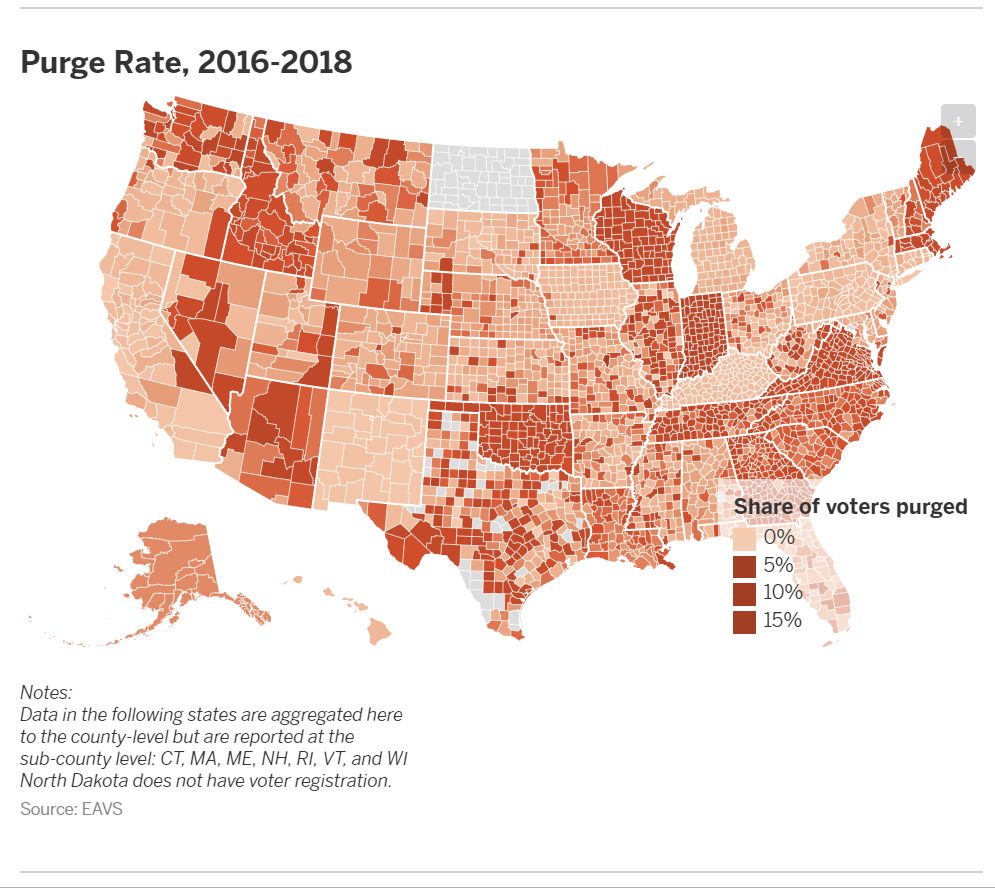
The map below shows the purge rates for the counties that reported their information to the EAC. Some counties did not report their information. Because North Dakota does not have voter registration, it does not have a voter purge rate. Therefore, the state is grayed out below to mirror the non-reporting jurisdictions in Texas and Alabama.
In our report last year, we noted that 16 million voters were purged between the federal elections of 2014 and 2016, and that this was almost 4 million more names purged from the rolls than between 2006 and 2008.
The latest data from the EAC shows that between the presidential election in 2016 and the 2018 midterms, more than 17 million voters were purged. While this number is higher than what we reported last year, it is likely due to the fact that more jurisdictions reported their data in 2018, pushing the reported total higher. As the figure below demonstrates, the median purge rate among counties that consistently report their data has remained largely the same.
Although the national purge rate remained steady, there was substantial variation among the states — including some very notable outliers. Indiana, for instance, purged more than 22 percent of its voters between 2016 and 2018, while Wisconsin and Virginia each purged more than 14 percent. These high purge rates were offset by states like New Mexico and California, which purged 1.4 and 2.8 percent of their voters respectively.
Purge rates in Section 5 jurisdictions continue to be higher
Prior to Shelby County, jurisdictions covered under Section 5 of the Voting Rights Act collectively had purge rates right in line with the rest of the country. A major finding in last year’s report was that jurisdictions that used to have federal oversight over their election practices began to purge more voters after they no longer had to pre-clear proposed election changes. The 2016–2018 EAC data shows a slightly wider gap in purge rates between the formerly covered jurisdictions and the rest of the country than existed between 2014 and 2016.
This is of particular interest because this continued — and even widening — gap debunks possible claims that certain states would experience a one-time jump when free of federal oversight, but then return to rates in line with the rest of the country. They haven’t.
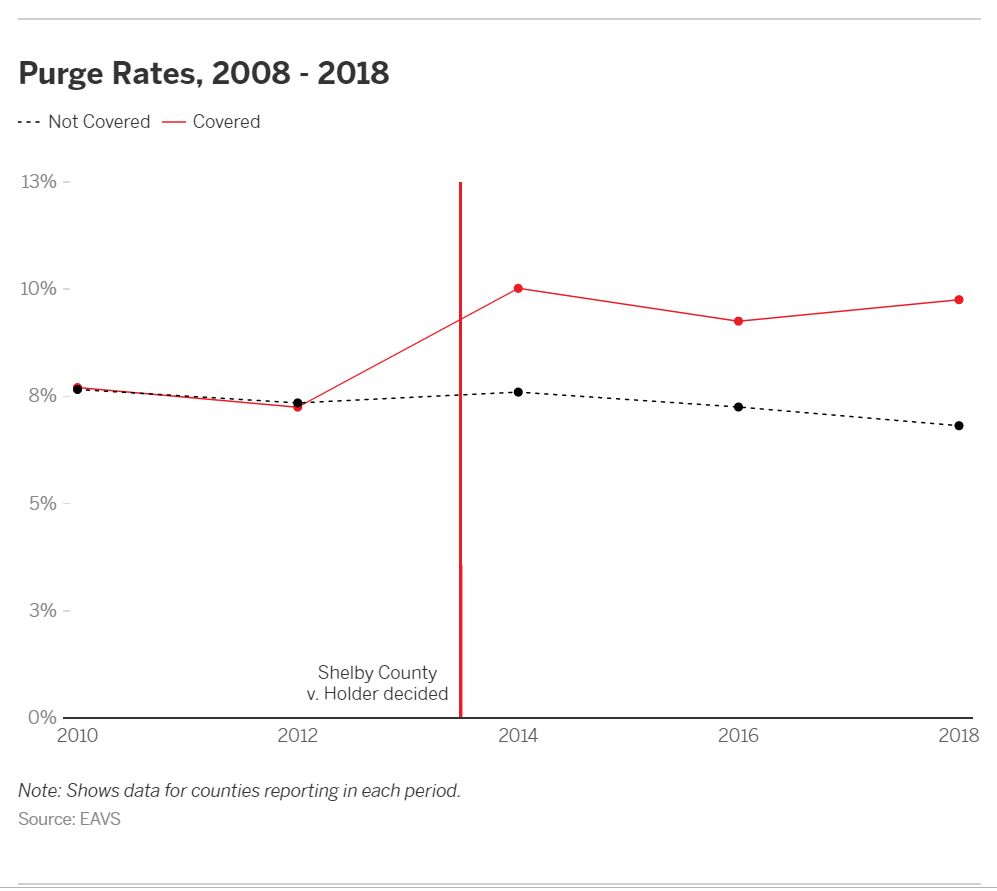
The median purge rate across the country in counties that were never covered by Section 5 of the Voting Rights Act decreased slightly between 2016 and 2018. In contrast, the purge rates ticked up in parts of the country that were covered at the time of the Shelby County decision. We found sustained higher purge rates in parts of the country that have a demonstrated history of discrimination in voting. If these formerly covered jurisdictions that reported their data each year had purged voters at rates consistent with the rest of the country — which they did before the Shelby County decision — they would have purged 1.1 million fewer voters between 2016 and 2018. In our report last year, we noted that Shelby County was likely responsible for the purge of 2 million voters over four years in these counties. The effect of the Supreme Court’s 2013 decision has not abated.
Next Steps
As the country prepares for the 2020 election, election administrators should take steps to ensure that every eligible American can cast a ballot next November. Election administrators must be transparent about how they are deciding what names to remove from the rolls. They must be diligent in their efforts to avoid erroneously purging voters. And they should push for reforms like automatic voter registration and election day registration, which keep voters’ registration records up to date.
Election day is often too late to discover that a person has been wrongfully purged.
Kevin Morris is a Quantitative Researcher with the Democracy Program, focusing on voting rights and elections. His research focuses on the impact of laws and policies on access to the polls, with a particular focus on rights restoration and voter list maintenance.
Prior to joining the Brennan Center, Mr. Morris worked as an economic researcher focusing on housing at the Federal Reserve Bank of New York and an economist at the Port Authority of New York and New Jersey. He has a B.A. from Boston College in Economics. He is currently pursuing his Masters in Urban Planning at NYU’s Wagner School, with an emphasis in Quantitative Methods and Evaluation.
The Brennan Center for Justice at NYU School of Law is a nonpartisan law and policy institute that works to reform, revitalize – and when necessary, defend – our country's systems of democracy and justice.
At this critical moment, the Brennan Center is dedicated to protecting the rule of law and the values of Constitutional democracy. We focus on voting rights, campaign finance reform, ending mass incarceration, and preserving our liberties while also maintaining our national security. Part think tank, part advocacy group, part cutting-edge communications hub, we start with rigorous research. We craft innovative policies. And we fight for them – in Congress and the states, the courts, and in the court of public opinion.
Join the fight to safeguard American democracy!
Your commitment means the Brennan Center will continue to protect and promote the ideals of equal justice for all. Become a partner in our work, and help lead the charge to restore our democracy.
The Brennan Center is a tax-exempt 501(c)3 nonprofit organization.