
Death on the Job: The Toll of Neglect, 2022

This 2022 edition of Death on the Job: The Toll of Neglect marks the 31st year the AFL-CIO has produced a report on the state of safety and health protections for America’s workers. This report features national and state information on workplace fatalities, injuries and illnesses, as well as the workplace safety inspections, penalties, funding, staffing and public employee coverage under the Occupational Safety and Health Act. It also includes information on the state of mine safety and health and the state of worker safety during the COVID-19 pandemic.
Fifty-one years ago on April 28, the OSH Act went into effect, promising every worker the right to a safe job. More than 647,000 workers now can say their lives have been saved since the passage of the OSH Act.¹ Since that time, workplace safety and health conditions have improved. But too many workers remain at serious risk of injury, illness or death as chemical plant explosions, major fires, construction collapses, infectious disease outbreaks, workplace assaults and other preventable workplace tragedies continue to occur. Workplace hazards kill and disable approximately 125,000 workers each year—4,764 from traumatic injuries, and an estimated 120,000 from occupational diseases. Job injury and illness numbers continue to be severe undercounts of the real problem.
Over the years, our progress has become more challenging as employers’ opposition to workers’ rights and protections has grown, and attacks on unions have intensified. Big Business and many Republicans have launched an aggressive assault on worker protections. They are attempting to shift employers’ responsibility to maintain a safe workplace to individual worker behavior, and undermine the core responsibilities of workplace safety agencies.
The Trump administration rolled back progress, attacking longstanding workplace safety protections—targeting job safety rules on beryllium, mine safety examinations and injury reporting, and cutting agency budgets and staff—and attempted to dismantle the systems for future protections. They totally failed to respond to the COVID-19 pandemic and the disparities of those most affected by workplace infection.
In the fall of 2019, the Occupational Safety and Health Administration (OSHA) began reducing the number of inspections involving significant cases and complex health hazards, a policy that is still in place today. In the first year of the COVID-19 pandemic, OSHA was largely absent from workplaces where it has the authority and responsibility to enforce workplace safety laws. While the number of inspectors and inspections have improved in FY 2021, there is much more progress to be made to meet or exceed pre-pandemic levels. The COVID-19 pandemic also brought to light the weaknesses in federal oversight of state OSHA plans. Congress continues to fund job safety at stagnant levels, allowing an OSHA budget that still only amounts to $4.37 to protect each worker covered by the OSH Act.
While progress is slow, the Biden administration has taken important steps to protect workers, prioritizing worker protections on its regulatory agenda, taking steps on targeted enforcement efforts on urgent hazards, and filling staff and leadership vacancies. It also launched broad efforts on worker empowerment and targeting workplace inequities.
President Joe Biden has appointed and nominated strong candidates focused on worker protection to lead job safety and health agencies and labor agencies. Immediately upon taking office, he appointed a longtime United Steelworkers (USW) safety and health leader, James Frederick, as acting assistant secretary for occupational safety and health. In April 2021, the Senate confirmed Marty Walsh, the Boston mayor from the construction trades unions, as secretary of labor. In April 2021, Biden nominated Doug Parker to be assistant secretary of labor for occupational safety and health—the head of OSHA—and he was confirmed Oct. 25, 2021.
Parker served as the California OSHA chief, on the Biden-Harris transition team, in chief policy roles at the Mine Safety and Health Administration (MSHA) and was executive director of Worksafe—a nonprofit organization focused on workplace injury, illness and death prevention. John Howard continues to serve as the head of the National Institute for Occupational Safety and Health (NIOSH). This is a sharp contrast to President Donald Trump, who nominated corporate officials to head the job safety agencies—people who had records of opposing enforcement and regulatory actions, and who often lacked safety experience.
Executive Summary
This 2022 edition of “Death on the Job: The Toll of Neglect” marks the 31st year the AFL-CIO has produced a report on the state of safety and health protections for America’s workers. The Occupational Safety and Health Act, promising every worker the right to a safe job, has been in effect for more than 50 years, and more than 647,000 workers now can say their lives have been saved since the passage of the OSH Act.
Over the last 50 years, there has been significant progress toward improving working conditions and protecting workers from job injuries, illnesses and deaths. Federal job safety agencies have issued many important regulations on safety hazards and silica, coal dust and other health hazards, strengthened enforcement and expanded worker rights.
These initiatives have undoubtedly made workplaces safer and saved lives. But much more progress is needed.
Over the years, the progress has become more challenging as employers’ opposition to workers’ rights and protections has grown, and attacks on unions have intensified. Big Business and many Republicans have launched an aggressive assault on worker protections. They are attempting to shift employers’ responsibilities to provide safe jobs to individual workers, and undermine the core responsibilities of workplace safety agencies.
The nation must renew its commitment to protecting workers from job injury, disease and death, and make this a high priority. Employers must meet their responsibilities to protect workers and be held accountable if they put workers in danger. Only then can the promise of safe jobs for all of America’s workers be fulfilled. There is much more work to be done to ensure the fundamental right to a safe job is a reality for all.
The High Toll of Job Injuries, Illnesses and Deaths
In 2020:
- 340 workers died each day from hazardous working conditions.
- 4,764 workers were killed on the job in the United States.
- An estimated 120,000 workers died from occupational diseases.
- The job fatality rate was 3.4 per 100,000 workers.
- Latino and Black workers remain at greater risk of dying on the job than all workers.
- Employers reported nearly 3.2 million work-related injuries and illnesses.
- Musculoskeletal disorders continue to make up the largest portion (21%) of work- related injuries and illnesses.
- Underreporting is widespread—the true toll of work-related injuries and illnesses is 5.4 million to 8.1 million each year.
The cost of job injuries and illnesses is enormous—estimated at $176 billion to $352 billion a year.
States with the highest fatality rates in 2020 were:
- Wyoming (13.0 per 100,000 workers)
- Alaska (10.7 per 100,000 workers)
- South Dakota (7.8 per 100,000 workers)
- North Dakota (7.4 per 100,000 workers)
- West Virginia (6.6 per 100,000 workers)
Industries with the highest fatality rates in 2020 were:
- Agriculture, forestry, and fishing and hunting (21.5 per 100,000 workers)
- Transportation and warehousing (13.4 per 100,000 workers)
- Mining, quarrying, and oil and gas extraction (10.5 per 100,000 workers)
- Construction (10.2 per 100,000 workers)
- Wholesale trade (4.6 per 100,000 workers)c
Latino and Black workers, often laboring in dangerous working conditions, are more likely to die on the job:
- The Latino fatality rate increased again to 4.5 per 100,000 workers in 2020, 32% greater than the national average; that marks a 15% increase over the past decade.
- The number of Latino worker deaths in 2020 was similar to the previous year: 1,072 deaths in 2020, compared with 1,088 in 2019. Of those who died in 2020, 65% were immigrants.
- The Black worker fatality rate of 3.5 per 100,000 workers continues to be greater than the national average.
- 541 Black workers died on the job, a decrease from 2019.
Older workers are at high risk. In 2020:
- More than one-third of workplace fatalities occurred among workers ages 55 and older.
- Workers 65 and older have 2.5 times the risk of dying on the job as other workers, with a fatality rate of 8.6 per 100,000 workers.
During the COVID-19 pandemic:
- America’s workplaces are a primary source of COVID-19 outbreaks, with thousands of workers infected and dying as they work in indoor, poorly ventilated spaces. However, workplace infection and outbreak information is limited because there is no national data surveillance system.
- Racial inequities in working conditions, disease and death were made worse and exploited.
- The federal Occupational Safety and Health Administration (OSHA) issued a COVID- 19 emergency temporary standard for health care (ETS for health care) on June 21, 2021. This provided health care workers with enforceable protections against exposure to the virus at work. On Dec. 27, 2021, OSHA announced a plan to withdraw the emergency standard and focus on permanent protections, leaving health care workers without COVID-19 protections in the meantime, including during the Omicron surge.
- All other workers have worked throughout the pandemic with only unenforceable guidance by federal OSHA. Recommendations from the Centers for Disease Control and Prevention (CDC) are weak, insufficient and have changed frequently within these two years, and have been plagued with political interference and corporate influence.
- Federal OSHA so far has issued 2,507 COVID-19-related violations, including 203 ETS for health care citations, 26 5(a)(1) citations, as well as respiratory protection, personal protective equipment and recordkeeping citations. The average penalty for a COVID-19-related violation was $3,281 per violation.
- Several state OSHA plans issued emergency temporary standards for COVID-19, and other states have issued executive orders requiring employers to implement workplace safety protections, or are enforcing current OSHA standards in their states—but many of these actions have been revoked or weakened as variants continue to spread in workplaces.
Workplace violence remains a serious and growing problem:
- Workplace violence deaths increased to 705 in 2020, while more than 27,000 violence- related lost-time injuries were reported.
- 392 worker deaths were workplace homicides.
- Workplace violence is the fourth-leading cause of workplace death overall and the second-leading cause of workplace death for women.
- Women workers are at greater risk of violence than men; they suffer seven of every 10 lost-time injuries related to workplace violence, and are 50% more likely to be killed by a relative or domestic partner in the workplace than men.
- There is no federal OSHA standard to protect workers from workplace violence.
Job Safety Oversight and Enforcement
OSHA resources in FY 2021 still are too few to be a deterrent:
- There are only 1,719 inspectors (755 federal and 964 state) to inspect the 10.4 million workplaces under the Occupational Safety and Health Act’s jurisdiction.
- The number of OSHA inspectors is near its lowest number since the agency opened more than 50 years ago.
- There is one inspector for every 81,427 workers.
- The current OSHA budget amounts to $4.37 to protect each worker.
Penalties in FY 2021 still are too weak:
- The average penalty for a serious violation was $4,460 for federal OSHA.
- The average penalty for a serious violation was $2,421 for OSHA state plans.
- The median penalty for killing a worker was $9,753 for federal OSHA.
- The median penalty for killing a worker was $5,825 for state OSHA plans.
- Only 115 worker death cases have been criminally prosecuted under the Occupational Safety and Health Act since 1970.
Much Work Remains to Be Done
Workers need more job safety and health protection, not less. We call on:
- OSHA and the Mine Safety and Health Administration (MSHA) to fully enforce job safety and health protections to hold employers accountable for not following workplace safety and health laws, and federal OSHA to strengthen oversight of state OSHA plans.
- OSHA to increase attention to the significant safety and health problems faced by Latino, Black, immigrant and aging workers, and those under other work arrangements.
- OSHA and MSHA to strengthen anti-retaliation protections and worker participation rights.
- OSHA to expeditiously issue a permanent COVID-19 standard to protect health care workers from airborne and other routes of exposure, and require employers to protect other workers in congregate work settings, such as in food processing and other manufacturing, corrections and transit.
- OSHA to issue a workplace violence standard for health care and social service workers. The Senate should pass legislation to ensure this is done.
- OSHA to develop and issue new protections and initiatives to address emergency response, heat illness and injury, combustible dust and musculoskeletal disorders.
- MSHA to develop and issue a rule on silica in mining and finalize protections on powered haulage equipment.
- The Environmental Protection Agency to fully implement the Toxic Substances Control Act to protect workers from chemical exposures, coordinating with OSHA and the National Institute for Occupational Safety and Health.
- Congress to increase funding and staffing at job safety agencies, modernizing the stagnant budget that has prevented agencies from fulfilling their obligations.
- Congress to pass the Protecting America’s Workers Act to extend the Occupational Safety and Health Act’s coverage to workers currently excluded, strengthen civil and criminal penalties for violations, enhance anti-discrimination protections, and strengthen the rights of workers, unions and those who have been injured or made ill because of their jobs.
- Elected leaders to oppose Big Business’s regulatory “reform” efforts and legislation that would make it more difficult—or impossible—for agencies to issue needed safeguards.
What Needs to be Done
Over the more than 50 years since the passage of the OSH Act, there has been significant progress made toward improving working conditions and protecting workers from job injuries, illnesses and deaths, preventing devastating losses to working families and saving lives. Federal job safety agencies have issued important regulations on many safety hazards, as well as on silica, coal dust and other health hazards, strengthened enforcement and expanded worker rights. These initiatives undoubtedly have made workplaces safer and saved lives. But much more progress is needed.
The pandemic exposed the regulatory safety and health structural systems that had been weakened over decades and exploited by the Trump administration. Job safety agencies need to be rebuilt, not only restored to the pre-Trump era, but in ways that reflect solutions to the most significant barriers to ensuring workers are protected and can fully exercise their rights. This requires refocusing national attention, energy and action on the enormous role and impact these agencies play to provide workplace oversight and prevent the disease, injuries and death that plague working people across the country. After years of starved budgets, funding and staffing for job safety agencies, and decades of allocating an agency with an extensive mission— OSHA—too few resources, there must be new dedication to substantially increase resources to protect workers, and address ongoing and emerging safety and health problems.
Employers and elected leaders must recognize that employment is a significant determinant of health—and our government must emphasize workplace exposure control measures to resolve this. Severe inequities in dangerous working conditions have created an unacceptable discrepancy in those who face the largest burdens of disease, injury and death because of their jobs. Initiatives to address the safety and health risks posed by changes in the workforce and employment arrangements must take more prominence, and workplace safety and health
regulations must be seen as a significant tool to raise the level of working conditions for those disproportionately affected. There must be renewed, dedicated attention given to the increased risk of fatalities and injuries faced by workers of color and immigrant workers, and aging workers, and enhanced efforts to protect temporary and contract workers.
OSHA must immediately issue a permanent standard to protect health care and other workers in congregate settings from COVID-19. The agency needs to fully enforce this standard and other workplace safety laws by developing a proactive enforcement plan across industries, fully investigating complaints, performing on-site inspections, issuing violations and penalties that reflect the size and scope of the real problem and that deter other employers, and ensure workers’ rights to report unsafe working conditions and refuse dangerous work.
OSHA must swiftly finalize its proposed standard on electronic injury reporting, make more of the data collected public and fully enforce the anti-retaliation protections for workers who report injuries. OSHA must move forward to issue proposed rules on emergency response, heat illness prevention and infectious disease.
Workplace violence is a growing and serious threat, particularly to women workers and those in the health care and social services sectors. OSHA must develop and issue a workplace violence standard, and the Senate should pass the Workplace Violence Prevention for Health Care and Social Service Workers Act to ensure this is done.
OSHA standards for chemical hazards are obsolete and must be updated. The Environmental Protection Agency (EPA) must fully implement the new toxic chemicals reform law and coordinate with OSHA and NIOSH, taking action to address the risks to the public and to workers. New initiatives are needed to address musculoskeletal disorders and combustible dust.
In mining, MSHA must continue initiatives to focus increased attention on mines with a record of repeated violations and stronger enforcement action against mines with patterns of violations. The agency must fully enforce the coal dust rule and act swiftly on new rules on silica and proximity detection for mobile equipment. Congress must strengthen job safety laws to prevent tragedies like the Massey Upper Big Branch mining disaster, which killed 29 miners in West Virginia. Improvements in the Mine Safety and Health Act are needed to give MSHA more authority to shut down dangerous mines and to enhance enforcement against repeat violators.
The Occupational Safety and Health Act now is more than 50 years old and is out of date. Congress must pass the Protecting America’s Workers Act to extend the law’s coverage to workers currently excluded, strengthen civil and criminal penalties for violations, and strengthen the rights of workers and their representatives. Improvements to update and strengthen the OSH Act’s anti-retaliation provisions are particularly needed, so workers can report job hazards and injuries, and exercise safety and health rights without fear.
The nation must renew its commitment to protect workers from injury, disease and death, and make this a high priority. We must demand that employers meet their responsibilities to protect workers and hold them accountable if they put workers in danger. Only then can the promise of safe jobs for all of America’s workers be fulfilled.
1 Calculated based on changes in annual fatality rates and employment since 1970. Fatality rate data for 1970 to 1991 is from National Safety Council Accident Facts, 1994. Fatality rate data for 1992 to 2020 is from the Bureau of Labor Statistics, Census of Fatal Occupational Injuries. Annual employment data is from the Bureau of Labor Statistics Current Population Survey.
2 U.S. Department of Labor, Bureau of Labor Statistics, Census of Fatal Occupational Injuries, 2020.
3 Takala, J., P. Hämäläinen, N. Nenonen, et al. “Comparative Analysis of the Burden of Injury and Illness at Work in Selected Countries and Regions,” Central European Journal of Occupational and Environmental Hygiene 23:1– 2, 6–31, (2017). icohweb.org/site/images/news/pdf/CEJOEM%20Comparative%20analysis%20published%2023_1- 2_Article_01.pdf.
4 Liberty Mutual Research Institute for Safety, news release, April 16, 2002.
5 Leigh, J.P. “Economic Burden of Occupational Injury and Illness in the United States.” The Milbank Quarterly 89, No. 4. December 2011. Available at 10.1111/j.1468-0009.2011.00648.x
Job Fatalities
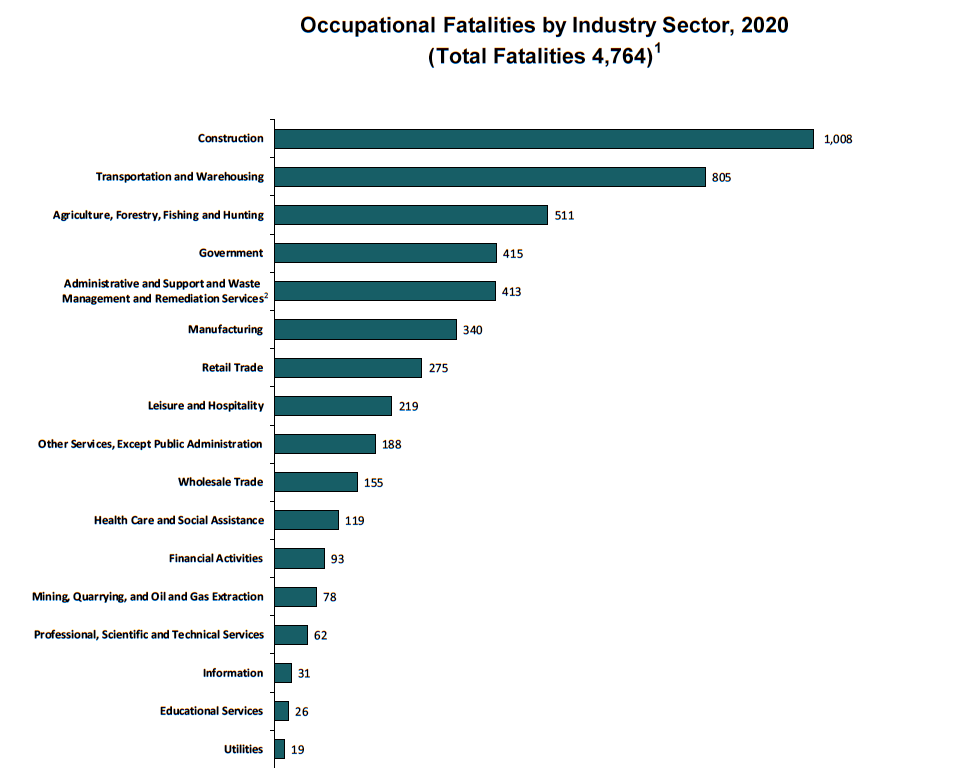
In 2020, 4,764 workers lost their lives on the job as a result of traumatic injuries, an increase from 2018, according to fatality data from the Bureau of Labor Statistics (BLS). The rate of fatal job injuries in 2020 was 3.4 per 100,000 workers, the first decrease in years.² Each day in this country, an average of 15 workers die because of job injuries—women and men who go to work, never to return home to their families and loved ones. This does not include workers who die from occupational diseases, estimated to be 120,000 each year.³ This number does not include the many thousands who died from being exposed to COVID-19 at work. Chronic occupational diseases receive less attention and place little accountability on employers because most are not detected until years after workers have been exposed to toxic chemicals and other agents, and because occupational illnesses often are misdiagnosed and poorly tracked. There is no national comprehensive surveillance system for occupational illnesses. In total, about 340 workers die each day due to job injuries and illnesses. The cost of these injuries and illnesses is enormous— estimated at $176 billion to $352 billion a year.⁴⁵
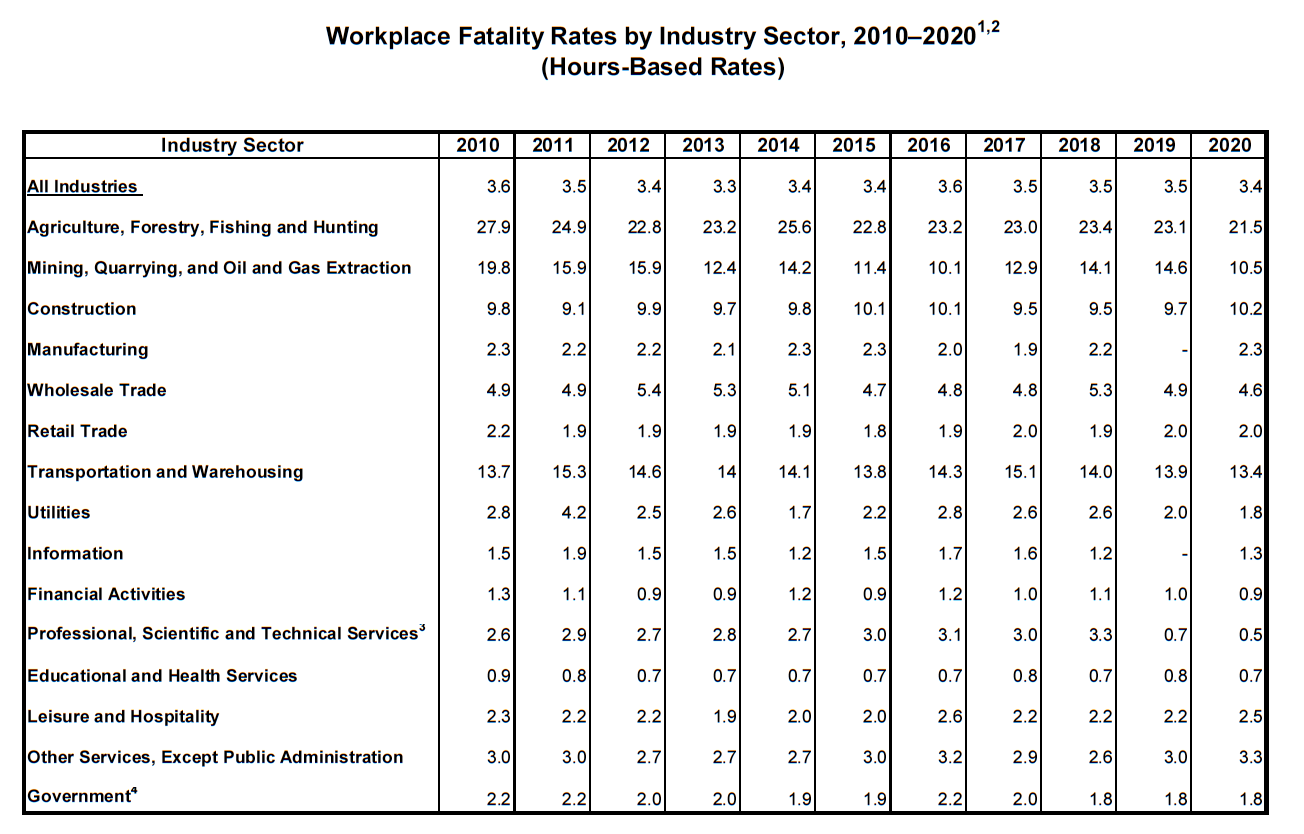
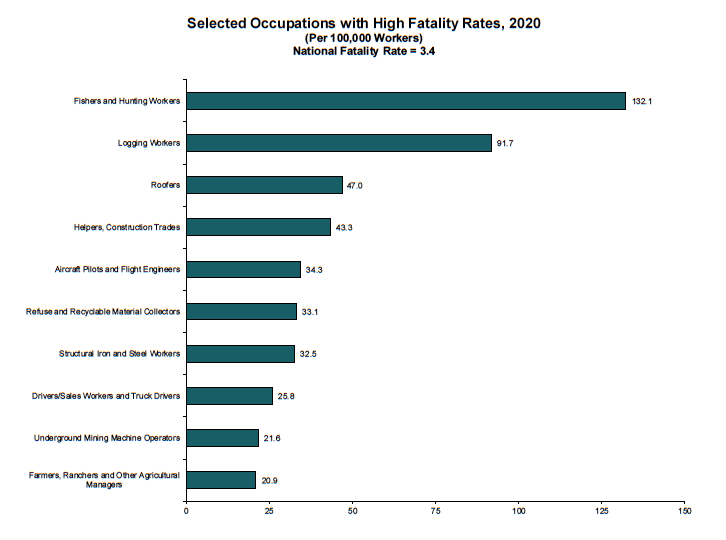
In 2020, agriculture, forestry, and fishing and hunting continues to be the most dangerous industry (21.5 deaths per 100,000 workers), followed by transportation and warehousing (13.4 per 100,000 workers), mining, quarrying, and oil and gas extraction (10.5 per 100,000 workers), construction (10.2 per 100,000 workers) and wholesale trade (4.6 per 100,000 workers).
Transportation incidents, in particular roadway crashes, continue to be the leading cause of workplace deaths, responsible for 1,778 or 37% of all fatalities in 2020, followed by deaths from falls, slips and trips (805, or 16.9%) and contact with objects and equipment (716, or 15%).
The job fatality rate for all self-employed workers—a group that lacks OSHA coverage— continues to remain high at 12.3 per 100,000 workers, more than four times the rate among wage and salary workers (2.9 per 100,000). In 2020, 900 contract workers died on the job—19% of all worker deaths. BLS had begun reporting details on fatalities that involve workers employed as contractors in 2012 in response to concerns about safety and health issues among these workers. Fatality data in 2019 and forward no longer report details of contractor deaths due to a 2020 BLS policy on disclosure methodology and reduction in publishable data—pulling back on transparency of details among contract worker deaths.
States with the highest fatality rates include Wyoming (13.0 per 100,000 workers), Alaska (10.7 per 100,000 workers), South Dakota (7.8 per 100,000 workers), North Dakota (7.4 per 100,000 workers) and West Virginia (6.6 per 100,000 workers). In 2020, despite the overall job fatality rate decrease, the job fatality rate increased in 20 states, compared with 2019.
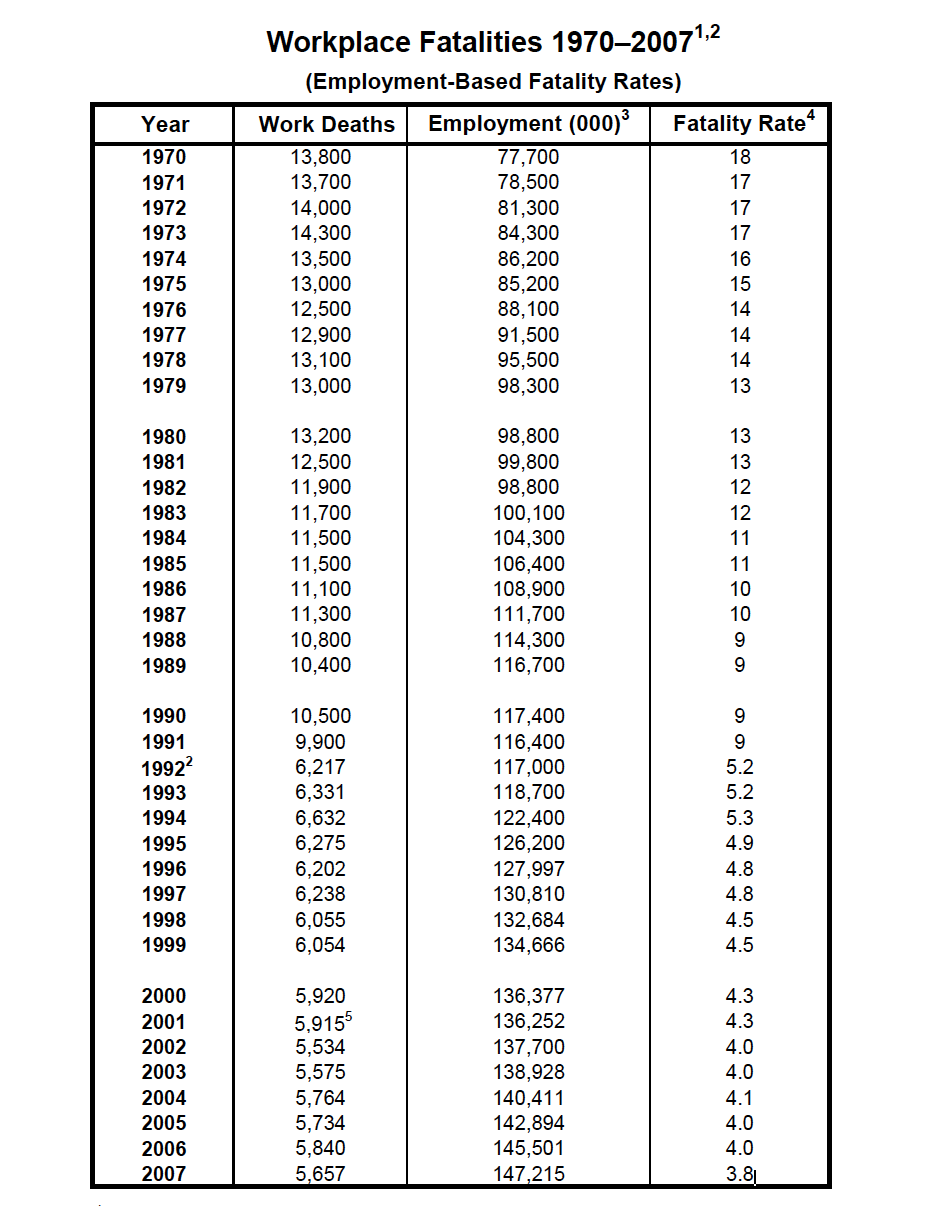
1Fatality information for 1971 to 1991 from National Safety Council Accident Facts, 1994.
2 Fatality information for 1992 to 2007 is from the Bureau of Labor Statistics, Census of Fatal Occupational Injuries. In 1994, the National Safety Council changed its reporting fatalities and adopted the BLS count. The earlier NSC numbers are based on an estimate; the BLS method for workplace numbers are based on an actual census.
3 Employment is an annual average of employed civilians 16 years of age and older from the Current Population Survey, adjusted to include data for resident and armed forces from the Department of Defense.
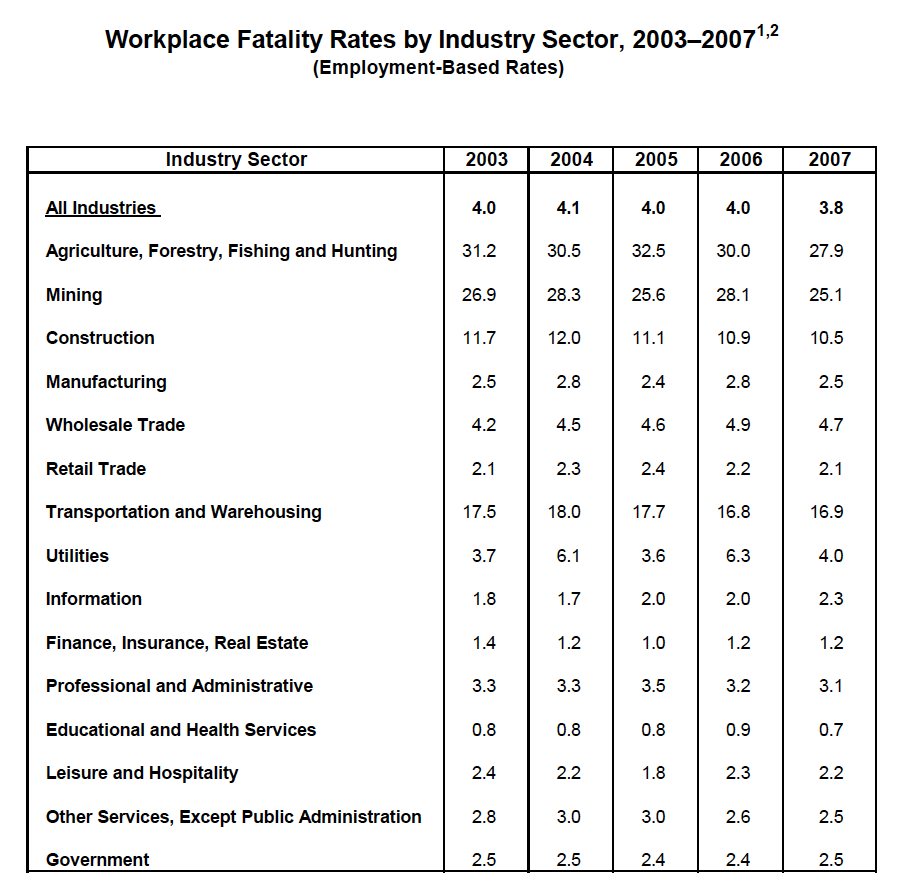
4 Deaths per 100,000 workers are based on annual average of employed civilians 16 years of age and older from 1992 to 2007. In 2008, CFOI switched from an employment-based fatality rate to an hours-based fatality rate calculation. Employment-based fatality rates should not be compared with hours-based fatality rates.
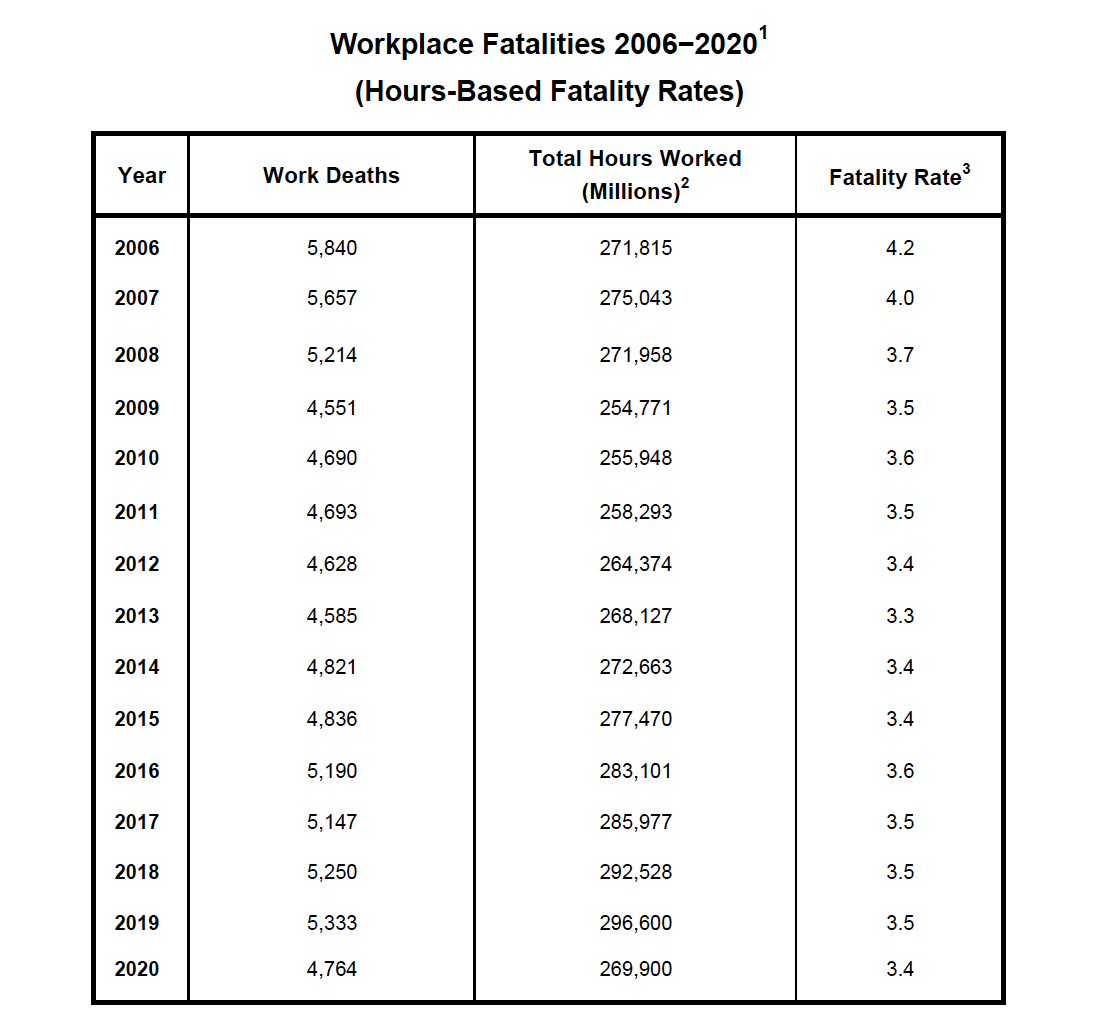
1 Fatality information is from the U.S. Department of Labor, Bureau of Labor Statistics, Census of Fatal Occupational Injuries.
2 The total hours worked figures are annual average estimates of total persons at work multiplied by average hours for civilians, 16 years of age and older, from the Current Population Survey, U.S. Bureau of Labor Statistics.
3 Deaths per 100,000 workers. In 2008, CFOI switched to an hours-based fatality rate calculation from an employment-based calculation used from 1992 to 2007. Fatality rates for 2006 and 2007 were calculated by CFOI using both approaches during the transition to hours-based rates beginning exclusively in 2008. Hours-based fatality rates should not be compared directly with the employment-based rates CFOI calculated for 1992 to 2007.
Sources: U.S. Department of Labor, Bureau of Labor Statistics, Current Population Survey, Census of Fatal Occupational Injuries; U.S. Bureau of the Census; and U.S. Department of Defense.
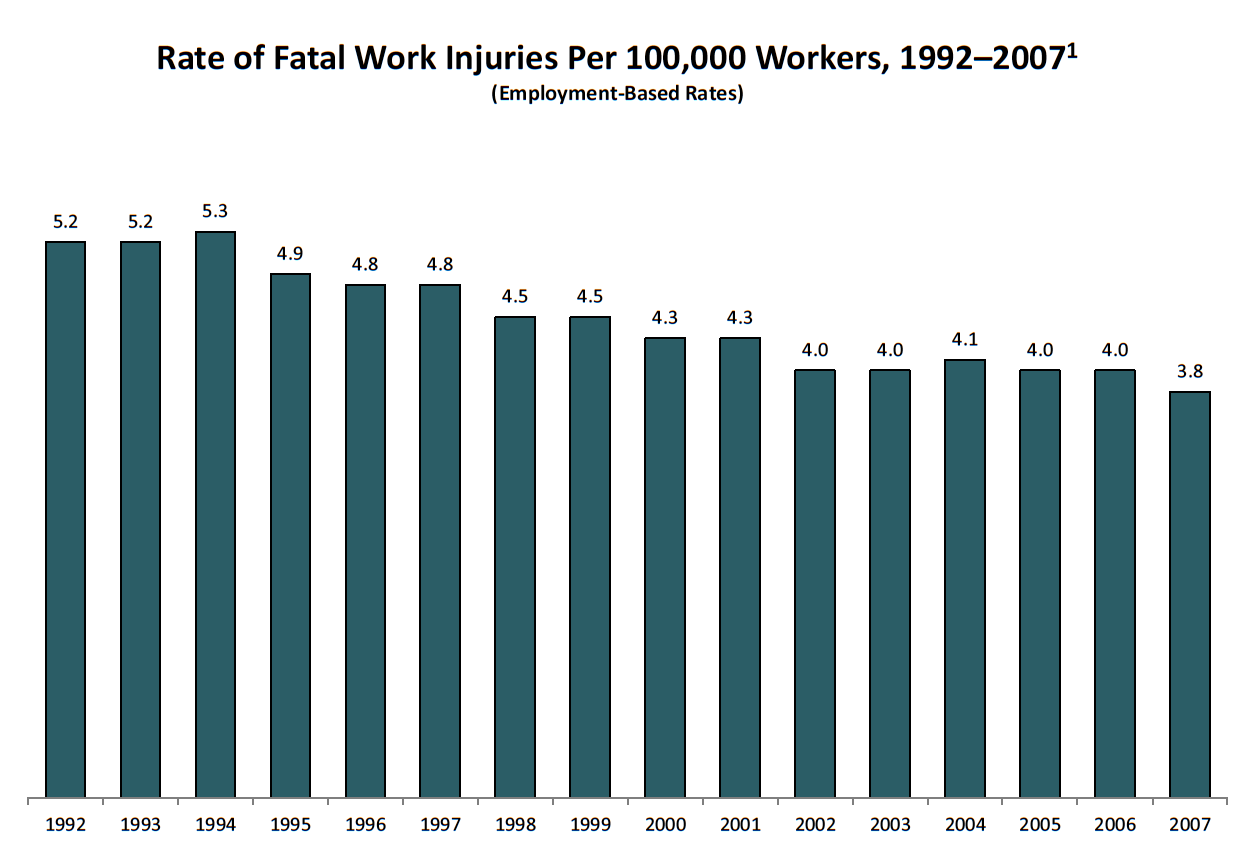
1 Incidence rate represents the number of fatalities per 100,000 workers. Fatality rate is an employment-based calculation using employment figures that are annual average estimates of employed civilians, 16 years of age and older, from the Current Population Survey, U.S. Bureau of of Labor Statistics. In 2008, CFOI switched to an hours-based fatality rate calculation. Employment-based fatality rates should not be compared directly with hours-based rates.
Source: U.S. Department of Labor, Bureau of Labor Statistics, Census of Fatal Occupational Injuries.
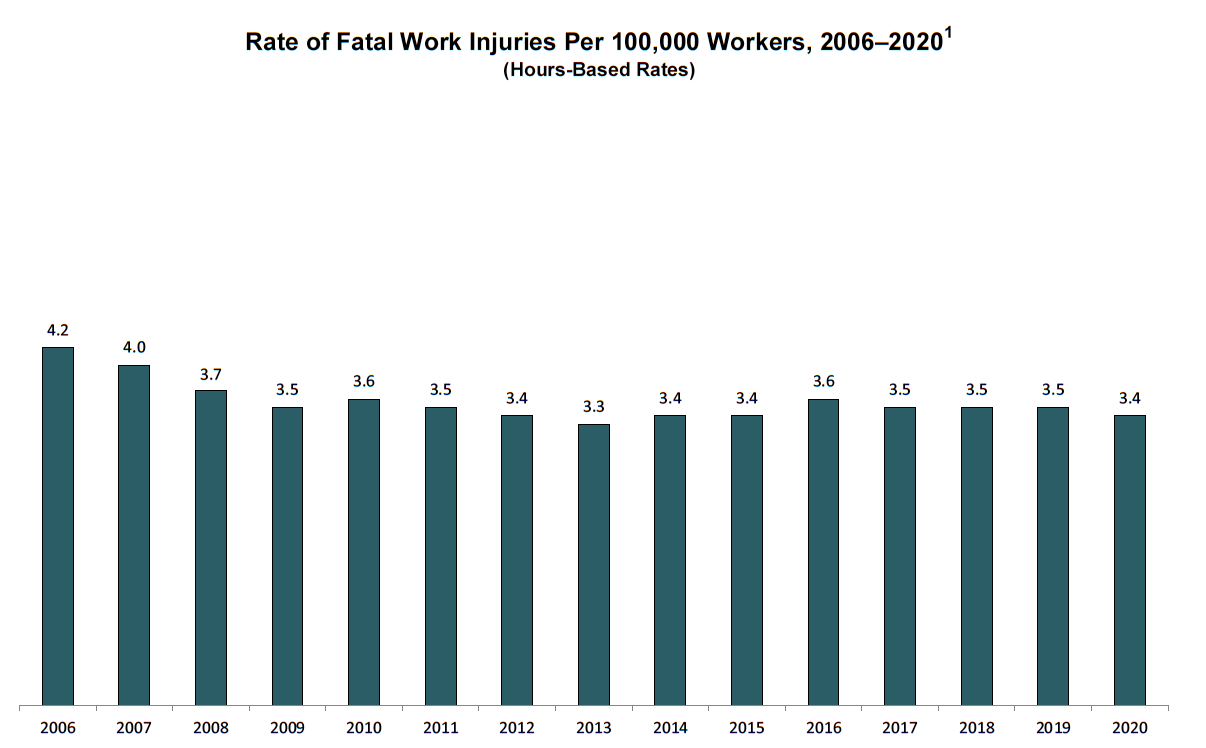
1 Incidence rate represents the number of fatalities per 100,000 workers. Fatality rate is an hours-based calculation using total hours worked figures that are annual average estimates of total persons at work multiplied by average hours for civilians, 16 years of age and older, from the Current Population Survey, U.S. Bureau of Labor Statistics. Hours-based fatality rates should not be compared directly with the employment-based rates CFOI calculated for 1992 to 2007.
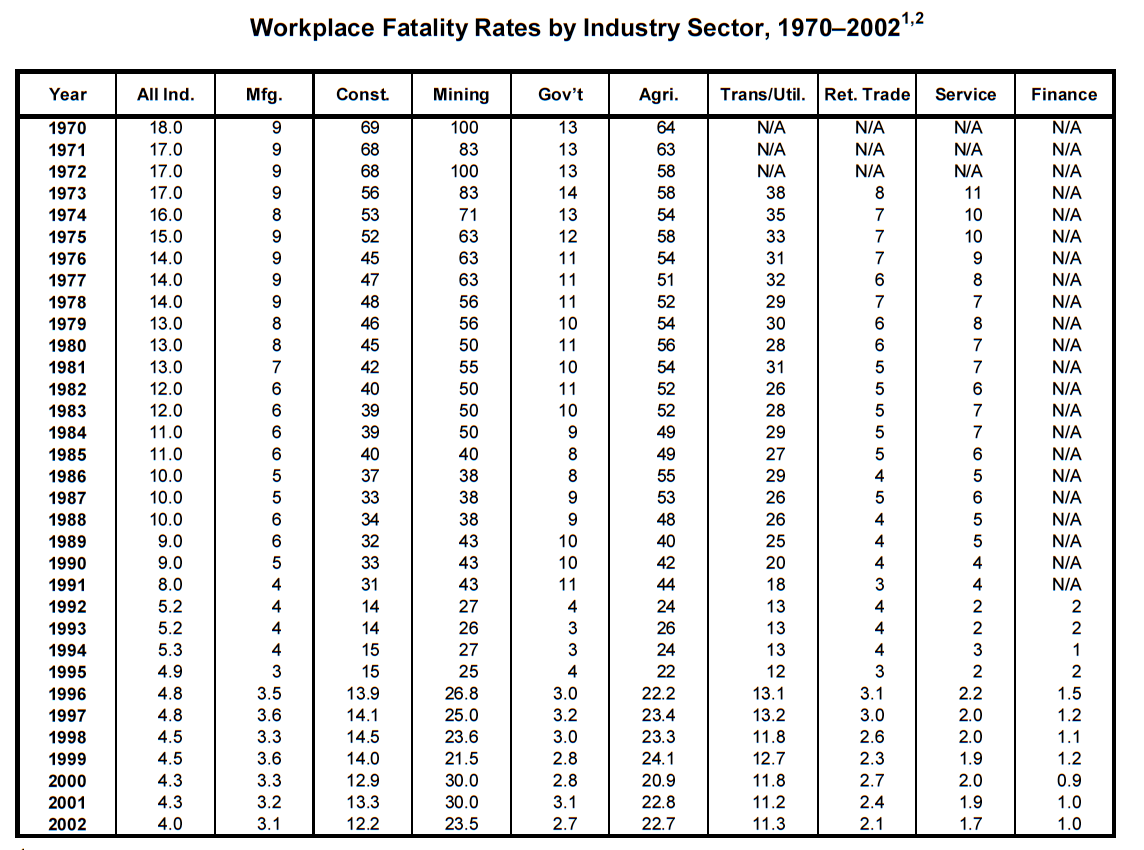
1 Data for 1970–1991 is from the National Safety Council, Accident Facts, 1994. Fatality information for 1992–2002 is from the Bureau of Labor Statistics, Census of Fatal Occupational Injuries. In 1994, the National Safety Council changed its reporting method for workplace fatalities and adopted the BLS count. The earlier NSC numbers are based on an estimate; the BLS numbers are based on an actual census. Beginning with 2003, CFOI began using the North American Industry Classification for industries. Prior to 2003, CFOI used the Standard Industrial Classification system. The substantial differences between these systems result in breaks in series for industry data.
2 Deaths per 100,000 workers.
Source: U.S. Department of Labor, Bureau of Labor Statistics, Census of Fatal Occupational Injuries.
1 Deaths per 100,000 workers.
2 Fatality rate is an employment-based calculation using employment figures that are annual average estimates of employed civilians, 16 years of age and older, from the Current Population Survey. In 2008, CFOI switched to an hours-based fatality rate calculation.
Employment-based fatality rates should not be compared directly with hours-based rates.
Note: Beginning with the 2003 reference year, both CFOI and the Survey of Occupational Injuries and Illnesses began using the 2002 North American Industry Classification System (NAICS) for industries. Prior to 2003, the surveys used the Standard Industrial Classification (SIC) system. The substantial differences between these systems result in breaks in series for industry data.
Source: U.S. Department of Labor, Bureau of Labor Statistics, Census of Fatal Occupational Injuries.
1 Deaths per 100,000 workers.
2Fatality rate is an hours-based calculation uisng total hours worked figures that are annual average estimates of total persons at work multiplied by average hours for civilians, 16 years of age and older, from the Current Population Survey. Hours-based fatality rates should not be compared directly with employment-based rates that CFOI calculated for 1992 to 2007.
3 In this sector, landscaping services had a fatality rate of 17.9 and waste management services and remediation services had a fatality rate of 15.0 in 2020.
4 Government fatalities may overlap with specific industry sectors listed.
Source: U.S. Bureau of Labor Statistics, U.S. Department of Labor.
Note: Oil and gas extraction industries include oil and gas extraction (NAICS 21111), drilling oil and gas wells (NAICS 213111), and support activities for oil and gas operations (NAICS 213112).
Source: U.S. Department of Labor, Bureau of Labor Statistics, Census of Fatal Occupational Injuries.
Workplace Injuries and Illnesses are Underreported and Costly
Nonfatal Injuries and Illnesses
In 2020, nearly 3.2 million workers across all industries, including state and local government, had work-related injuries and illnesses that were reported by employers, with 2.7 million injuries and illnesses reported in private industry. In 2020, state and local public sector employers reported an injury rate of 3.9 per 100 workers, 44% higher than the reported rate of 2.7 per 100 among private sector workers.⁶
Due to limitations in the current injury reporting system and widespread underreporting of workplace injuries, this number understates the problem. The true toll is estimated to be two to three times greater—or 5.4 million to 8.1 million injuries and illnesses a year. In addition, states are not required to report to BLS; its Survey of Occupational Injuries and Illnesses is voluntary.
The number of reported illnesses in private industry, including COVID-19, more than quadrupled in 2020 to 544,600 illnesses, compared with 127,200 in 2019. This is not a true count of occupational COVID-19 illness. However, studies have not been done to determine the number of cases of all work-related illnesses, and recently, work-related COVID-19, have been missed by the survey. This estimate is likely much greater given other documentation throughout the pandemic.
Reported Cases Understate the Problem
Over the last decade, there has been significant research documenting that the BLS survey fails to capture a large proportion of work-related injuries and illnesses—one-third to two-thirds of work-related injuries and illnesses are missed by the survey. Studies comparing injuries captured by the BLS survey with injuries reported to workers’ compensation or other injury reporting systems have found that the BLS survey missed 33% to 69% of work-related injuries.⁷⁸⁹¹⁰ A 2018 study of injury reporting in the mining industry found a similar result. Two-thirds of the injuries among miners in Illinois that were reported to workers’ compensation were not reported to MSHA by mine operators as required by the law.¹¹ A study that compared state fatality rates in the construction industry with rates of injuries that result in lost time or job restriction found
there was little correlation between the two, and in some cases there was a negative correlation.¹² The study observed that multiple factors impacted the reporting and recording of injuries, and concluded that fatality rates are a much more valid measure of risk.
Some of the undercount in the BLS survey is due to injuries excluded from the BLS survey’s scope, including injuries among self-employed individuals, and the design of the survey.¹³ But other factors, including employees’ reluctance to report injuries due to fear of retaliation, incentive programs that penalize workers who report injuries and drug testing programs for workplace injuries, suppress reporting.¹⁴ In addition, there are disincentives for employers to report injuries, which include concern about increased workers’ compensation costs for increased reports of injuries; fear of being denied government contracts due to high injury rates; concern about being targeted by OSHA for inspection if a high injury rate is reported; and the promise of monetary bonuses for low injury rates. A 2020 study by BLS investigating additional causes of underreporting indicated that keeping of injury and illness logs was not widely prevalent, and that small establishments were less likely than mid-sized and large establishments to keep records.¹⁵
BLS also has recognized the need to make changes in its program in order to collect more complete and accurate injury and illness statistics. It launched a pilot of a Household Survey on Occupational Injuries and Illnesses to collect information on work-related injuries and illnesses through interviews with workers.¹⁶ The initial results showed that the survey needed improvements to reduce respondent burden, to improve survey completion and to identify OSHA-recordable injuries, but it has potential to be a supplement to the existing employer-based injury and illness survey. BLS will continue to work on improvements to the survey.¹⁷ A 2018 report from the National Academies of Sciences, Engineering and Medicine on occupational safety and health surveillance strongly endorsed BLS conducting this new household survey.¹⁸ Hopefully, if the pilot is successful, Congress will provide the necessary funding to continue and expand this important work.
6 U.S. Department of Labor, Bureau of Labor Statistics, Survey of Occupational Injuries and Illnesses, 2020.
7 Boden, L.I., and A. Ozonoff. “Capture-Recapture Estimates of Nonfatal Workplace Injuries and Illnesses.” Annals of Epidemiology 18, No. 6. 2008. Available at 10.1016/j.annepidem.2007.11.003.
8 Rosenman, K.D., A. Kalush, M.J. Reilly, et al. “How Much Work-Related Injury and Illness is Missed by the Current National Surveillance System?” Journal of Occupational and Environmental Medicine 48, No. 4, 357–67. April 2006. Available at 10.1097/01.jom.0000205864.81970.63.
9 Davis, L., K. Grattan, S. Tak, et al. “Use of Multiple Data Sources for Surveillance of Work-Related Amputations in Massachusetts, Comparisons with Official Estimates and Implications for National Surveillance.” American Journal of Industrial Medicine 57, No. 10. April 29, 2014. Available at 10.1002/ajim.22327.
10 Wuellner, S., and D. Bonauto. “Injury Classification Agreement in Linked Bureau of Labor Statistics and Workers’ Compensation Data.” American Journal of Industrial Medicine 57, No. 10. Dec. 17, 2013. Available at 10.1002/ajim.22289.
11 Almberg, K.S., L.S. Friedman, D. Swedler and R.A. Cohen. “Mine Safety and Health Administration’s Part 50 program does not fully capture chronic disease and injury in the Illinois mining industry.” American Journal of Industrial Medicine 61, 436–443. March 9, 2018. Available at 10.1002/ajim.22826.
12 Mendeloff, J., and R. Burns. “States with low non‐fatal injury rates have high fatality rates and vice‐versa.” American Journal of Industrial Medicine 56, 509–519. April 2, 2012. Available at 10.1002/ajim.22047 (2013).
13 Wiatrowski, W.J. “Examining the Completeness of Occupational Injury and Illness Data: An Update on Current Research.” Monthly Labor Review. June 2014. Available at BLS.gov/opub/mlr/2014/article/examining-the- completeness-of-occupational-injury-and-illness-data-an-update-on-current-research.htm.
14 United States Government Accountability Office. “Enhancing OSHA’s Records Audit Process Could Improve the Accuracy of Worker Injury and Illness Data.” GAO-10-10. October 15, 2009. Available at GAO.gov/products/GAO-10-10.
15 Rogers, E. “The Survey of Occupational Injuries and Illnesses Respondent Follow-Up Survey.” Monthly Labor Review. U.S. Bureau of Labor Statistics. May 2020. Available at doi.org/10.21916/mlr.2020.9.
16 U.S. Bureau of Labor Statistics. Research on the Completeness of the Injury and Illness Counts from the Survey of Occupational Injuries and Illnesses. Available at BLS.gov/iif/undercount.htm.
17 Yu, E., and K. Monaco. “Overview of the Results of the Household Survey of Occupational Injuries and Illnesses Pilot and On-going BLS Activities.” U.S. Bureau of Labor Statistics. Dec. 5, 2020. Available at BLS.gov/iif/hsoii- update-12052020-final.pdf.
18 National Academies of Sciences, Engineering, and Medicine. A Smarter National Surveillance System for Occupational Safety and Health for the 21st Century. Washington, D.C.: The National Academies Press, (2018). Available at doi.org/10.17226/24835.
Cost of Occupational Injuries and Deaths
The cost of occupational injuries and deaths in the United States is staggering, estimated at $176 billion to $352 billion a year, according to two recent studies.
The 2021 Workplace Safety Index, published by Liberty Mutual Insurance, estimated the cost of the most disabling workplace injuries to employers at more than $58 billion a year—more than $1 billion per week.¹⁹ This analysis, based on 2018 data from Liberty Mutual, BLS and the National Academy of Social Insurance, estimated direct costs to employers (medical and lost- wage payments) of injuries resulting in cases involving five or more days of lost time. If indirect costs also are considered, the overall costs are much higher. Based on calculations used in the previous Liberty Mutual Safety Index, the data indicate that businesses pay between $176 billion and $352 billion annually in direct and indirect (overtime, training and lost productivity) costs on workers’ compensation losses for the most disabling injuries (indirect costs are estimated to be two to five times direct costs).²⁰ It is important to note that the safety index excludes a large number of injury cases (those resulting in less than five days of lost time). In addition, Liberty Mutual bases its cost estimates on BLS injury data. Thus, all the problems of underreporting in the BLS system apply to the Liberty Mutual cost estimates as well.
A 2011 comprehensive study examined a broad range of data sources, including data from the BLS, the Centers for Disease Control and Prevention (CDC), the National Council on Compensation Insurance and the Healthcare Cost and Utilization Project, to determine the cost of fatal and nonfatal occupational injuries and illnesses for 2007. This study estimated the medical and indirect (productivity) costs of workplace injuries and illnesses at $250 billion annually, more than the cost of cancer.²¹ A follow-up analysis found that workers’ compensation covered only 21% of these costs, with 13% borne by private health insurance, 11% by the federal government and 5% by state and local governments. Fifty percent of the costs were borne by workers and their family members.²²
A 2015 report by OSHA—“Adding Inequality to Injury: The Costs of Failing to Protect Workers on the Job”—outlined how work-related injuries have devastating impacts on workers and their families. According to the report, workers who are injured on the job suffer great economic loss. Even after receiving workers’ compensation benefits, injured workers’ incomes are, on average, nearly $31,000 lower over 10 years than if they had not suffered an injury.²³
One of the major contributors to the severe loss of income is the gross deficiencies and inequities in the workers’ compensation system, which continues to be governed by 50 different state laws.
A 2015 multipart series by Pro Publica and National Public Radio exposed the failure of the workers’ compensation system to provide fair and timely compensation for workers hurt on the job.²⁴ The series—“Insult to Injury: America’s Vanishing Worker Protections”—was based on a yearlong investigation, which found that over the previous decade there had been a systematic effort by insurers and employers to weaken workers’ compensation benefits for injured workers. Since 2003, legislators in 33 states have passed legislation reducing benefits or limiting eligibility. The benefits provided to workers vary widely. For example, at the time of the investigation, the maximum compensation for loss of an eye was $261,525 in Pennsylvania, but only $27,280 in Alabama. In many states, employers have great control over medical decisions. Workers are not allowed to pick their own doctors, and employers can demand review by “independent medical examiners” picked by employers who can challenge medical determinations regarding the work-relatedness of the condition, the degree of disability and prescribed treatment. According to Pro Publica, all of these factors have contributed to the demolition of the workers’ compensation system and left injured workers and their families, and society at large, bearing the costs of their injuries.
19 2021 Liberty Mutual Workplace Safety Index. Available at Business.LibertyMutual.com/wp- content/uploads/2021/06/2021_WSI_1000_R2.pdf.
20 Liberty Mutual Research Institute for Safety, news release, April 16, 2002.
21 Leigh, J.P. “Economic Burden of Occupational Injury and Illness in the United States.” The Milbank Quarterly
89, No. 4. December 2011. Available at doi.org/10.1111/j.1468-0009.2011.00648.x.
22 Leigh, J.P., and J. Marcin. “Workers’ Compensation Benefits and Shifting Costs for Occupational Injuries and Illnesses.” Journal of Occupational and Environmental Medicine 54, No. 4. April 2012. Available at 10.1097/JOM.0b013e3182451e54.
23 U.S. Department of Labor, Occupational Safety and Health Administration. “Adding Inequality to Injury: The Costs of Failing to Protect Workers on the Job.” 2015. Available at OSHA.gov/sites/default/files/inequality_michaels_june2015.pdf.
24 Pro Publica and National Public Radio. “Insult to Injury: America’s Vanishing Worker Protections.” March 2015. Available at ProPublica.org/series/workers-compensation.