Missing Workers: The Missing Part of the Unemployment Story

In a complex economy, conventional measures sometimes fall short.
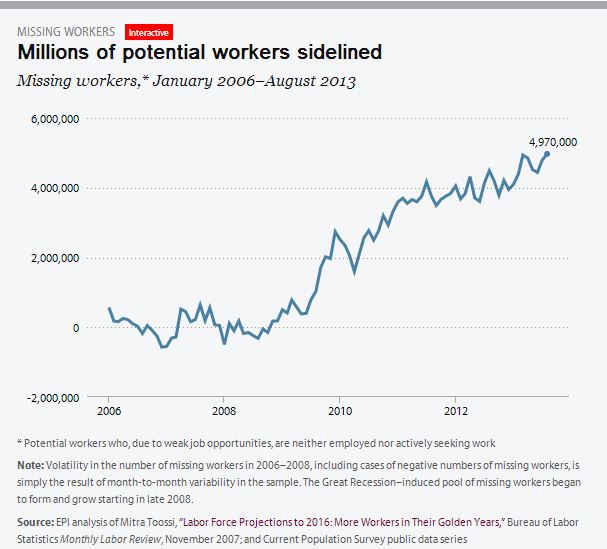
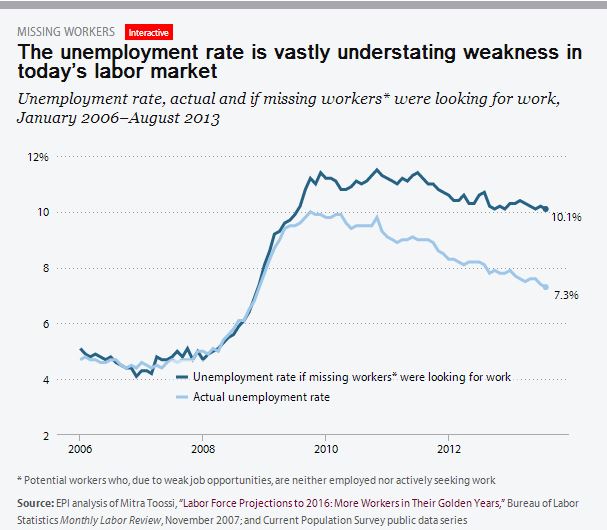
In today’s labor market, the unemployment rate drastically understates the weakness of job opportunities. This is due to the existence of a large pool of “missing workers”—potential workers who, because of weak job opportunities, are neither employed nor actively seeking a job. In other words, these are people who would be either working or looking for work if job opportunities were significantly stronger. Because jobless workers are only counted as unemployed if they are actively seeking work, these “missing workers” are not reflected in the unemployment rate.
As part of its ongoing effort to create the metrics needed to assess how well the economy is working for America’s broad middle class, EPI is introducing its “missing worker” estimates, which will be updated on this page on the first Friday of every month immediately after the Bureau of Labor Statistics releases its jobs numbers. The “missing worker” estimates provide policymakers with a key gauge of the health of the labor market.
Current “missing worker” estimates at a glance
Updated October 9, 2013, based on most current data available
Total missing workers, August 2013:
4,970,000
Unemployment rate if missing workers were looking for work:
10.1%
Official unemployment rate:
7.3%
Chart: Total Number of Missing Workers
Chart: Unemployment Rate If Missing Workers Were Looking for Work
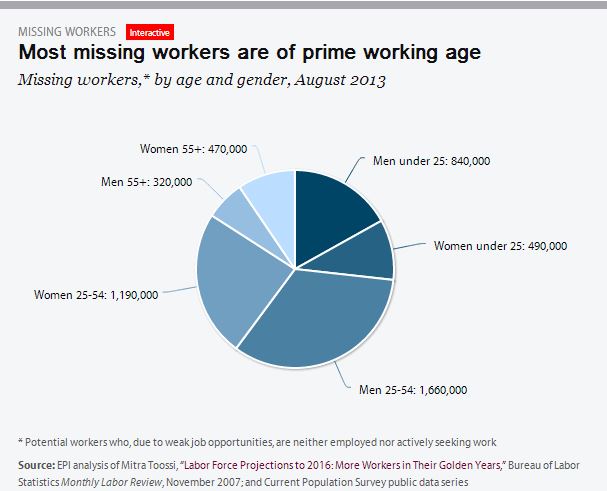
Chart: Missing Workers by Age and Gender
Methodology
How do we estimate the number of missing workers?
Labor force participation rate projections published by the Bureau of Labor Statistics in November 2007—before the start of the Great Recession—are available in Table 3 of Mitra Toossi, “Labor Force Projections to 2016: More Workers in Their Golden Years,” Bureau of Labor Statistics Monthly Labor Review, November 2007. The projections assumed a healthy labor market over the period in question, 2006–2016, so the participation rate changes it forecasts reflect purely non-cyclical factors (e.g., the impact of retiring baby boomers). The difference between these projections and the actual labor force participation rate is thus a good measure of the cyclical change in the labor force participation rate, i.e., the change that is a direct result of the weak labor market in the Great Recession and its aftermath. It does not count, for example, those retiring baby boomers who would have left the labor force whether or not the Great Recession happened.
Based on this logic, missing workers are estimated in the following way: The labor force participation rate projections for 2016 by gender and age group (age groups 16–19, 20–24, 25–34, 35–44, 45–54, 55+) available in Table 3 of Toossi (2007) are assumed to be structural rates. The current month’s structural rates (by gender and age group) are calculated by linearly interpolating between 2006 and 2016. The size of the potential labor force is calculated by multiplying the current month’s structural rates by actual population numbers (available by gender and age group from the Current Population Survey public data series). The difference between the size of the potential labor force and size of the actual labor force (also available by gender and age group from the Current Population Survey public data series) is the number of missing workers.


