
Wage Suppression in 10 Charts
Wages for typical workers have been largely suppressed since the 1970s. The 10 charts below tell that story.
In the following 10 charts, we outline the historical context of workers’ wage trajectories since the 1970s. For most of those years, wages for the majority of workers were essentially stagnant. Two periods, the late 1990s and the last decade, saw decent wage growth, which kept cumulative wage growth since 1979 well above zero. But those years were the exception, not the norm. More importantly, even with those two periods, wages for typical workers lagged far behind productivity growth—meaning there was the potential for wages to rise far faster than they did. Had workers’ wages kept up with productivity, their annual earnings would have been roughly $30,000 higher.
The cost of this wage suppression is real. Because wages make up a large share of income for most U.S. working families, lost wage growth meant sluggish income growth. However, there was one group where wage growth, and corresponding income growth, was substantial: the top 1%, whose wages skyrocketed by 182% since 1979. This uneven growth implies that today’s labor market, and the income derived from it, is deeply unbalanced. Rather than workers reaping the rewards of their rising productivity, a growing share of their labor has gone to the top 1%, leading to rising wage and income inequality.
Decades of sluggish wage growth for typical workers—paired with the message that it was workers’ own fault for not obtaining the necessary skills for today’s economy—have left many pessimistic about whether policy changes can help them earn more. But if we want to achieve broad-based economic security in the U.S. economy, there is no alternative to raising pay for workers up and down the wage distribution. The U.S. economy generates enough income in aggregate to provide decent rates of pay growth for all workers—the challenge is a political one.
We close by detailing the ways in which policy choices, not the workings of competitive markets, are behind unbalanced power and growing economic inequality. We look to periods when there was decent wage growth (the late 1990s and the last 10 years) for insight. In both periods, unemployment was low and sustained, suggesting that high-pressure labor markets are key to wage growth. We further show that the deterioration of labor standards happened concurrently with a period of largely sluggish wage growth, suggesting that the key to rebalancing labor markets lies in policies that center worker power. We find, for example, that if union density in 2025 had been the same as the level in 1973, median wages would be 10% higher today.
While 45 years of suppressed wage growth may give the impression that this is inevitable, it is not. Our analysis reveals that equitable wage growth is not only possible, but that it has happened for significant periods in U.S. history and can happen again. This leaves us optimistic: There is nothing inevitable about our unbalanced labor market, and poor wage growth for the vast majority of workers is not driven by genuine economic scarcity. Policy choices like raising the minimum wage, ensuring every worker who wants a union has access to one, and prioritizing full employment are the keys to rebalancing the labor market in favor of workers. Wage suppression might have defined the last 45 years.
But, as our research on the factors affecting wage growth and worker power show, it doesn’t have to be the story of the future.
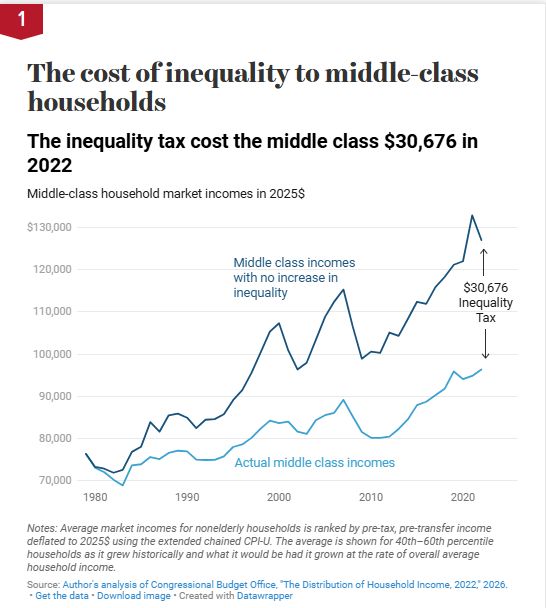
The stakes of rising inequality for middle-income households in the United States are enormous. By 2022, steadily rising inequality was costing these households roughly $30,000 per year.
Figure 1 compares actual income growth of the middle fifth of nonelderly households since 1979 with what this income growth could have been had inequality not increased. The graph highlights market-based incomes because rising inequality was driven entirely by this income category—earnings from the labor market and business income like dividends and interest payments. We focus on incomes of nonelderly households because inequality largely stemmed from unbalanced labor market power, and nonelderly income is dominated by labor earnings.
In 2022, the average market income of the middle fifth of households was $96,335. But their income would have been $127,011—roughly 32% (over $30,000) higher—had inequality not increased after 1979. Put another way, if the middle fifth of households had seen market income grow at the overall average rate—an overall average pulled up by stratospheric growth at the very top—their income could have been roughly $30,000 higher by 2022.
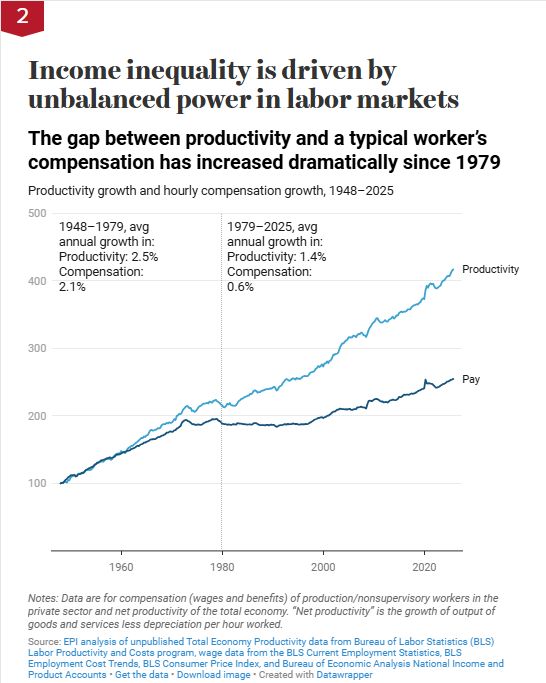
The inequality in market-based incomes highlighted in Figure 1 was overwhelmingly driven by unbalanced power in labor markets that prevented typical workers from seeing their paychecks keep up with overall economic growth. Figure 2 shows hourly pay (including benefits) for the roughly 80% of the private-sector workforce who are not managers or supervisors and a measure of economy-wide productivity—defined as the income generated in an average hour of work in the U.S. economy. The rising gap between these lines is how we define wage suppression—keeping typical workers’ wage growth slower than growth in incomes in the rest of the economy.
In the three decades following World War II, hourly compensation for the vast majority of workers rose 2.1% on an annualized basis, roughly in line with productivity growth of 2.5%. But for most of the last five decades (except for a brief period in the late 1990s), pay for the vast majority lagged further behind overall productivity. Over the entire 1979 to 2025 period, hourly pay for a typical worker rose just 0.6% while productivity increased 1.4% on an annualized basis. This means that workers have been producing far more than they receive in their paychecks and benefit packages from their employers, and this wedge has grown substantially over time. Some of those gains in productivity went to greater profits for corporations but an even larger portion went to highly paid managers and professionals, resulting in a vast increase in wage inequality over the last five decades.
Had we pursued policies to support broad-based wage growth—instead of wage suppression—typical workers would have much higher pay today. In fact, if annual pay for production and nonsupervisory workers had instead tracked productivity growth since 1979, their pay would be 45% higher, or $30,000 more than it is today.
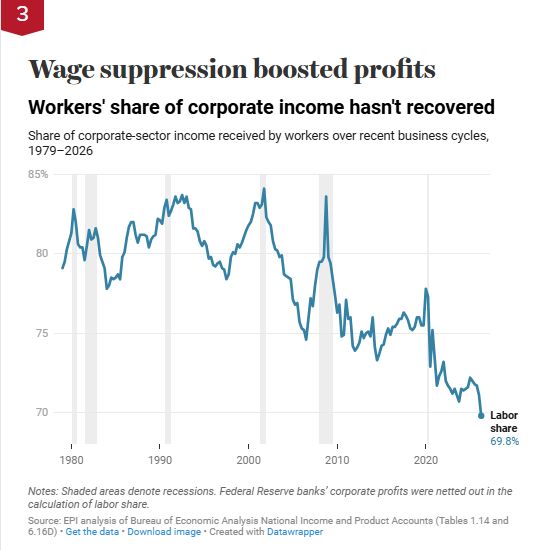
The declining labor share of corporate-sector income—the share of corporate income received by workers in the form of wages and benefits—explains a portion of the wedge between productivity and pay. The labor share of corporate-sector income has not recovered to its pre-pandemic level, and remains well below its 1979 to 2008 average. Figure 3 illustrates the labor share of corporate-sector income since 1979. Typically, the labor share rises during recessions because profits fall much faster than wages during downturns. Then, in the early stages of recovery, the labor share falls significantly as profits increase much more rapidly than wages. Usually, the labor share then rises again late in an expansion as labor markets tighten and workers regain the bargaining power necessary to secure wage increases. Since 2000, no business cycle expansion has gone on long enough with unemployment low enough to put serious upward pressure on the labor share of income. Small upticks were seen sporadically over the last 15 years, but this progress, but this progress has stalled out.
Two things about the shift from labor compensation to profits in recent decades deserve some context. First, even as measured in official data, this shift explains well under half of the overall wedge between productivity and pay—the biggest piece of this gap remains inequality within labor compensation (we return to this point further below). Second, some of the changes in the official data might be more the outcome of accounting decisions than of fundamental changes in the economy.
Since the early 2000s, capital income (dividends, capital gains, and business income) has been taxed at lower rates than labor income. Highly privileged economic actors who have the ability to engage in tax evasion by reclassifying their income have likely done so in this time—relabeling income once classified as wages and salaries as capital income instead to pay lower tax rates. Recent research has estimated that roughly a third of the decline in the labor share of income might be driven by this kind of tax evasion rather than by a genuine change in which factors of production are seeing income gains.
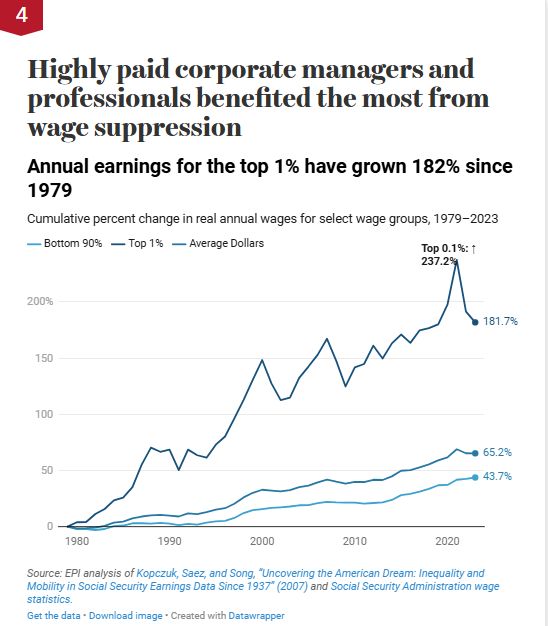
The largest portion of the growing wedge between productivity and pay can be explained by the astronomical wage growth for those at the highest end of the wage distribution. The ability of those at the very top to claim an ever-larger share of overall wages is evident in Figure 4. Annual earnings for the top 1% have grown 182% since 1979, while wages of the bottom 90% have grown just 44%. If the wages of the bottom 90% had grown at the average pace over this period—meaning that wages grew equally across the board—then wages for the bottom 90% would have grown by 65%, far higher and roughly 50% faster than the actual growth experienced. Earnings are so concentrated at the top that average growth is well above the 90th percentile of the earnings distribution. That means workers need to be among the highest 10% of wage earners to even experience average earnings growth. And everyone else—more than 90% of the workforce—saw less than average growth over the last four and a half decades.
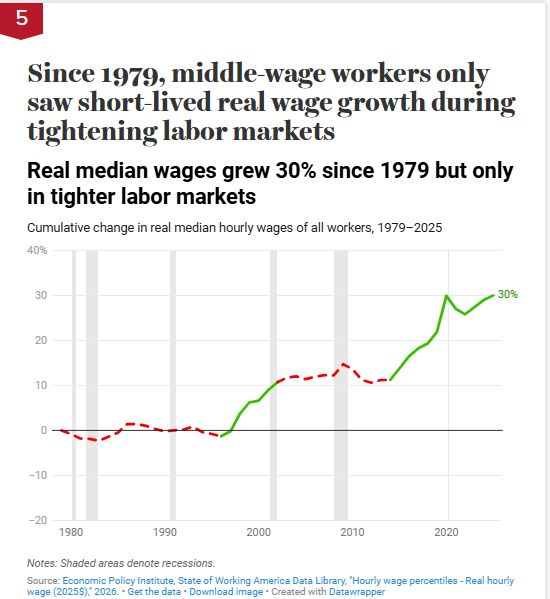
Between 1979 and 2025, the hourly wages of middle-wage workers (workers earning the median wage) cumulatively grew just 30%—about 0.6% per year. Yet even this disappointing cumulative wage growth occurred only because wages grew in the late 1990s and the late 2010s–2020s. Apart from these two periods, the wages of middle-wage workers were totally flat or in decline since 1979. Figure 5 shows real median wages since 1979. The red portions of the line highlight periods when median wage growth was genuinely stagnant, while the green portions highlight when growth occurred.
In the absence of strong institutions and labor standards like robust unions and high minimum wages, strong wage growth occurs only when labor markets are tight. In tight labor markets, the relative scarcity of workers gives them more power in the workplace to effectively demand decent hourly wage growth across the board.
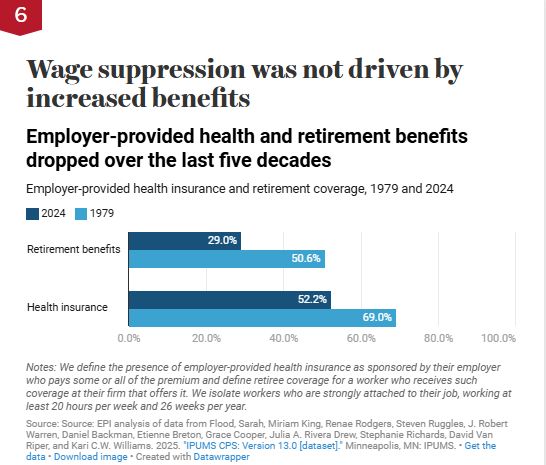
The suppressed “pay” portion of the pay–productivity chart includes wages and benefits, suggesting that benefits have not offset slow wage growth. In fact, by many measures benefit generosity and availability have deteriorated alongside wage suppression. We explore trends in two key employment benefits in Figure 6: employer-sponsored health insurance and retirement coverage. We define employer-provided health insurance as insurance for which the employer pays some or all of the premium. We define retiree coverage as coverage a worker receives at their firm that offers it. We isolate workers who are strongly attached to their job, working at least 20 hours per week and 26 weeks per year.
For workers, sluggish pay has been compounded by the fact that health insurance and retirement coverage have declined significantly over time. Health insurance fell from 69.0% to 52.2% between 1979 and 2024. At the same time, retiree coverage nearly fell by half from 50.6% down to 29.0%. Furthermore, plan generosity has suffered with the trend away from defined benefit to defined contribution retirement benefits, as well as the shift to high deductible health plans.
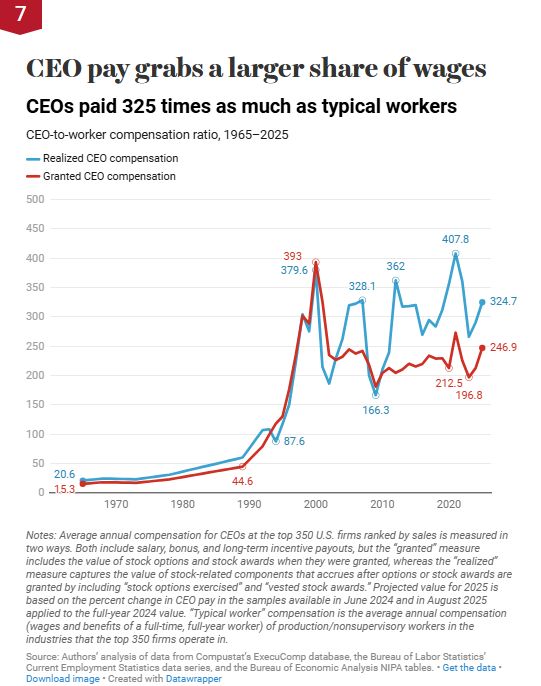
In a nation of increasing inequality, the most extreme disparities are between the heads of large American corporations and typical workers. Figure 7 tracks the ratio of pay of CEOs at the 350 largest public U.S. firms to the pay of typical workers. In 1965, these CEOs made 21 times what typical workers made. As of 2025, they make 325 times typical workers’ pay. This higher pay for CEOs does not reflect any increased contribution to corporate output or growth in the skills or productivity of CEOs. CEO pay gains help explain the growing divergence between pay and productivity. Further, the pay of CEOs and other highly placed corporate managers sets norms and market benchmarks across a range of elite occupations. The pay of specialty physicians, lawyers, consultants, and even sectors like university and nonprofit administration is likely pulled upward by rising pay for corporate executives.
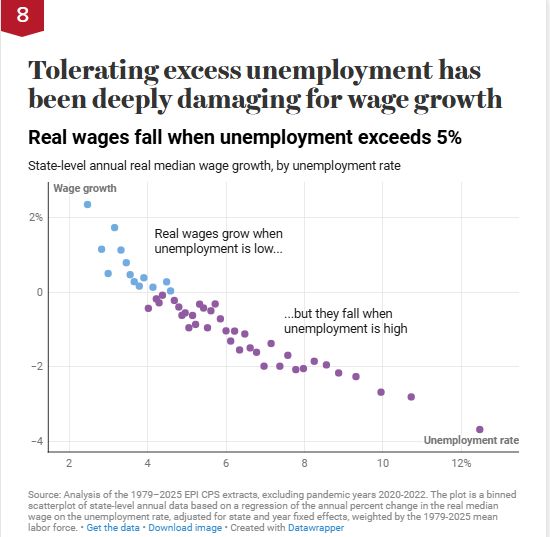
As a rough rule of thumb, real wages for middle-wage workers outright fall when unemployment is greater than 5%.
Prioritizing high-pressure labor markets—those identified by extended periods of low unemployment—is key to providing lower- and middle-wage workers the leverage to bid up their wages. Figure 8 shows that the threshold for achieving any real wage growth at all is around 5% unemployment. In general, real wages grow when unemployment is lower than 5%, but they fall when unemployment is higher. Extended periods of low unemployment can also reduce wage inequality and racial disparities.
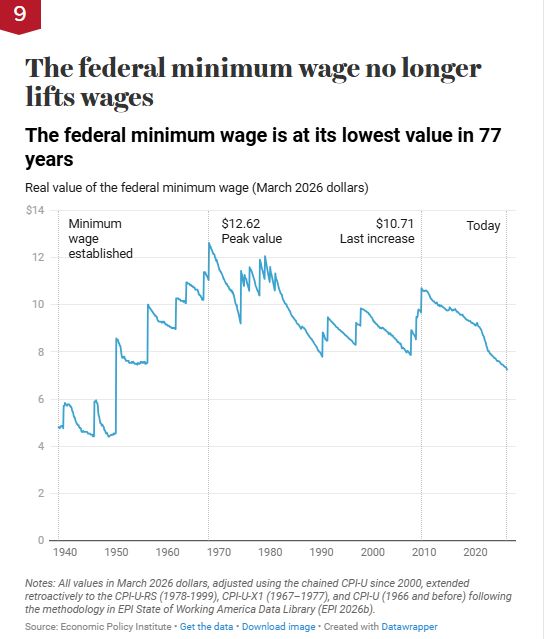
Figure 9 shows the decline in the real (inflation-adjusted) value of the federal minimum wage since its high in 1968. The last increase to the minimum wage was enacted in 2009, 17 years ago, which is the longest period without a minimum wage increase since its inception in 1938.
The minimum wage is essential for establishing the wage levels for the bottom fifth of wage earners. Today’s low-wage workers are far more educated, older, and experienced than low-wage workers in 1968. Yet, despite being more skilled and productive, their wages are 43% lower than wages earned in 1968, and 32% lower than the most recent increase in the minimum wage 17 years ago. The failure to raise the federal minimum wage has especially adverse effects on women and Black and Hispanic workers.
Luckily, many states have refused to follow the federal government’s inaction and have passed higher minimum wages at an increasing rate over the past two decades. Seventeen states and the District of Columbia now have minimum wages of at least $15 per hour, and more workers live in states with minimum wages over $15 than in states only bound by the too low federal minimum wage.
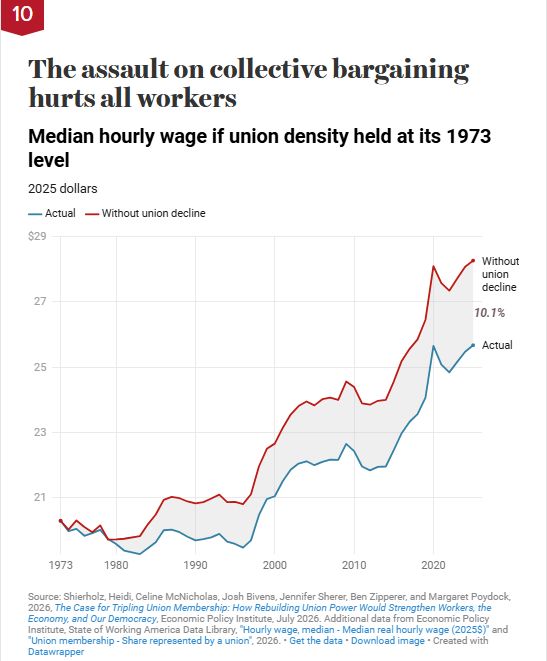
One of the main causes of wage suppression and rising wage inequality is the decline of collective bargaining, which lowers the wages of both union and nonunion workers. Collective bargaining not only raises wages for organized workers but also leads other employers to raise the wages and benefits of nonunion workers to come closer to union wage standards.
The erosion of collective bargaining can explain from one-fifth to one-third of the growth of wage inequality between 1973 and 2007; it had a greater impact on men than women. This erosion of unionization occurred despite large numbers of workers indicating they would prefer collective bargaining if they had a choice. But the political power of those with the most income, wealth, and power has prevented the adoption of laws to modernize our labor–management system and enable workers to pursue collective bargaining.
Figure 10 shows how wages could have grown if unionization hadn’t declined since 1973. If union density in 2025 had been the same level as union density levels of 1973 (14 percentage points higher than it is today), median wages would rise by 10.1%.
Elise Gould joined EPI in 2003. Her research areas include wages, jobs, economic inequality, and the care economy. She is a co-author of The State of Working America, 12th Edition. Gould authored a chapter on health in The State of Working America 2008/09; co-authored a book on health insurance coverage in retirement; published in venues such as The Chronicle of Higher Education, Challenge Magazine, and Tax Notes; and written for academic journals including Health Economics, Health Affairs, Journal of Aging and Social Policy, Risk Management & Insurance Review, Environmental Health Perspectives, and International Journal of Health Services. Gould has been quoted by a variety of news sources, including Bloomberg, NPR, The Washington Post, The New York Times, and The Wall Street Journal, and her opinions have appeared on the op-ed pages of USA Today and The Detroit News. She has testified before the U.S. House Committee on Ways and Means, Maryland Senate Finance and House Economic Matters committees, the New York City Council, and the District of Columbia Council.
Hilary Wething (she/her) is an Economist at the Economic Policy Institute. Her research examines the relationship between labor market policy, household economic security, and social safety net programs. Prior to joining EPI as an Economist, Wething was an Assistant Professor of Public Policy at the Pennsylvania State University School of Public Policy.
She holds a Ph.D. in public policy and management, with concentrations in demography and economics, from the Daniel J. Evans School of Public Policy and Governance at the University of Washington. Wething has undergraduate degrees in mathematics and economics from Creighton University.
We (Economic Policy Institute) envision an economy that is just and strong, sustainable, and equitable--where every job is good, every worker can join a union, and every family and community can thrive.
EPI is a leader in the movement for economic justice. We use the tools of economics to win policy change that advances power for workers, economic security for families, and racial and gender equity in our nation.
EPI's rigorous research and transformative ideas fortify worker organizing, build a shared understanding of how power and policy shape economic outcomes, and drive progressive policy change at every level of government.