

Political scientist Michael P. McDonald recently released preliminary turnout rates at the state (and national) level. These data are preliminary and will be continuously updated, but still yield some insights.
Firstly, we can look at the impact of felon disenfrachisement.
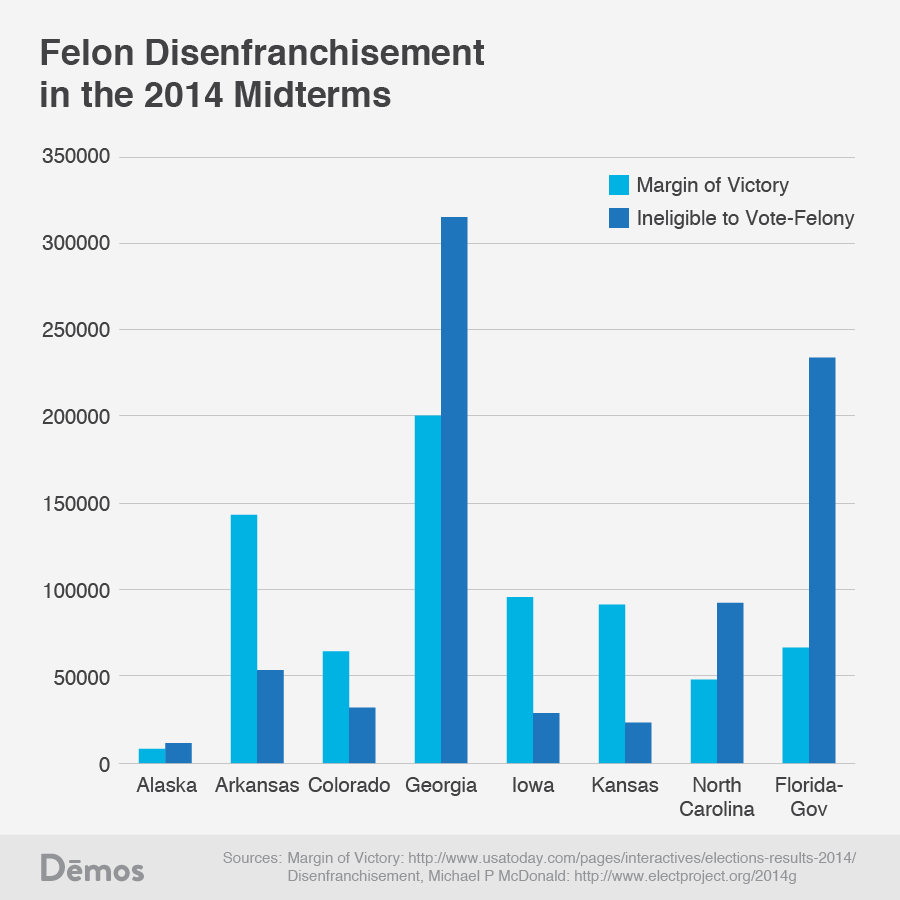
Research finds that felon disenfranchisement laws have influenced the outcomes of both presidential and Senate elections. Such laws disenfranchised almost 6 millions voters this year—most of them poor and people of color.
Just look at seven key Senate races and one gubernatorial race (Florida, where Rick Scott tightened felon re-enfranchisement laws in one of his first acts as governor) in the most recent elections. In three of those Senate races and the gubernatorial election, the number of disenfranchised felons was greater than the margin of victory. Not only does felon disenfranchisement contribute to the class and race bias in the electorate by primarily impacting low income people and people of color, it often disenfranchises more voters than the margin of victory.
Secondly, we can compare states with voter ID laws to those without.
Obviously, there are many other factors here. The states that tend to pass voter ID laws are a self-selected group. They tend to have more competitive elections and recent increases in turnout among low-income voters and African-Americans.
They are also almost all passed by Republican legislatures, reducing turnout. Recently, the GAO examined voter ID laws and finds that out of ten studies, five had mixed results, four showed a statistically significant drop in voter turnout and one showed an increase in voter turnout. GAO finds that turnout decreased between 1.9 and 2.2 percentage point in Kansas and 2.2 to 3.2 percentage points in Tennessee.
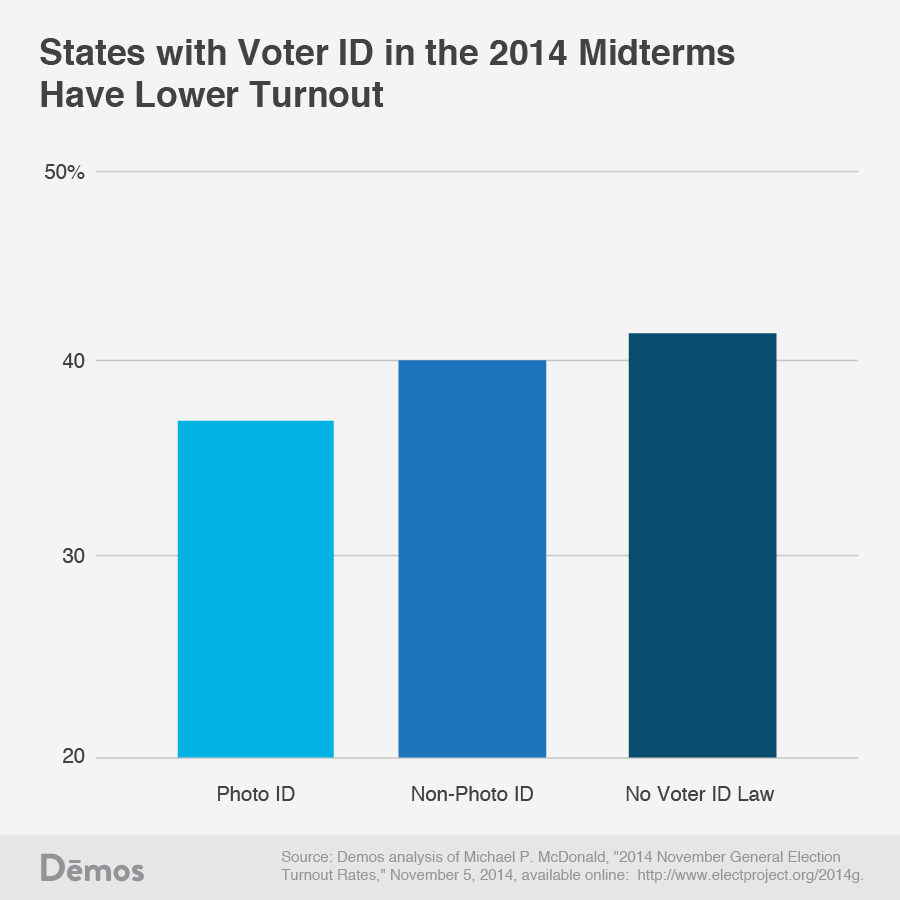
For this year’s midterm, comparing McDonald’s turnout estimates with states with photo ID, non-photo ID and no ID law at all shows that on average, states with a photo ID law had 4.4 percentage points lower turnout than those that did not. States with a non-photo ID law also had lower voter turnout, about 1.52 points lower than states without voter ID. There are numerous factors at work here, but given Silver’s findings, the GAO review and anecdotal evidence at polling stations, it is plausible voter ID depressed turnout.
Given that voter ID laws are generally passed in states with competitive races, we would expect to see higher turnout (election competiveness boosts turnout)—instead we see the opposite. The Brennan Center has collected all of the studies on voter turnout here.
Third, we can examine the impact of same-day registration.
Research suggests that same-day registration reduces the class bias of the electorate. Previous Demos research finds that when same-day registration is available, hundreds of thousands of voters use it. Demos also finds that states with same-day registration consistently have higher levels of turnout than states without it. Numerous studies confirm that SDR increases turnout.
And this was true in the 2014 midterms. States with SDR had turnout 7.92 points higher than states without SDR. This is likely a combination of factors, including the fact that states committed to turnout generally pass many reforms which work together to boost turnout.

Above all, turnout for the most recent election was dismal: 36.6%. That compares with 40.9% in 2010 and 40.4% in 2006. It's the lowest of the last five elections. That's why states should consider same-day registration, early voting, mail-in voting, felon re-enfranchisement and other laws that will get millions of voters to the polls next election.
Spread the word