
Why did Trump win — and Clinton lose — the 2016 U.S. presidential election? That’s been debated widely, to understate the case. Nominees include each campaign’s ground game, messaging, FBI Director James B. Comey’s last-minute letter to Congress, and defections from the “Obama coalition.”
Here, we offer new data to show that shifts in which racial groups went to the polls may have made the difference.
Using data from the voter file vendor Catalist and information from the U.S. Census Bureau, we examine the change in turnout rates for different racial/ethnic groups between 2012 and 2016. Black turnout declined dramatically; white turnout increased noticeably; and Latino and Asian American turnout went up even more. In the key swing states of Michigan, Wisconsin, and Pennsylvania, those shifts were especially strong. How strong? Without those shifts in turnout from various racial and ethnic groups, these pivotal states might have gone not to Trump but to Clinton — giving Clinton an electoral college victory.
How we did our research
It is surprisingly difficult to estimate levels of voter turnout by race. Unlike the forthcoming report from the Current Population Survey, Catalist’s estimates are based not on self reports but on actual turnout records. Since most states do not ask voters about their racial/ethnic background, Catalist usually estimates this information from the voter’s name and neighborhood.
According to recent research, Catalist correctly predicts race/ethnicity about 91 percent of the time. Further, we use Catalist’s estimates of voter race for both 2012 and 2016. If Catalist’s estimates are wrong, they’re likely wrong in a consistent way — and so any differences we find in the electorate’s racial composition are accurate.
The denominator we use to calculate turnout rates is an estimate of the citizen voting-age population (CVAP) by race in November 2012 and November 2016, respectively. To construct this estimate, we use the Census Bureau’s Population Estimates Program data to calculate the voting-age population in each state by race, and then use American Communities Survey information on citizenship rates to remove the (often substantial) noncitizen population for each racial/ethnic group.
How voter turnout by race changed between 2012 and 2016
Nationally, turnout rates for these racial/ethnic groups changed noticeably from 2012 to 2016, as you can see in the figure below.
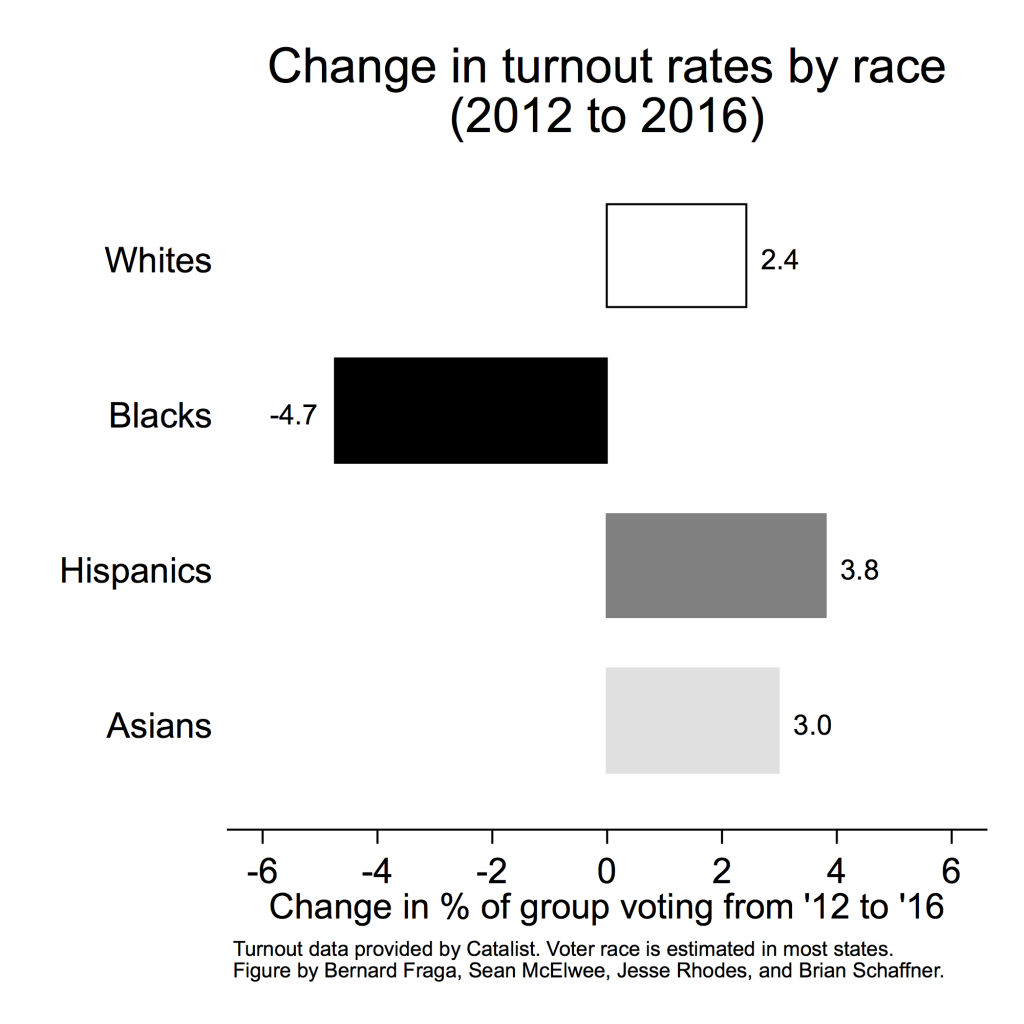
Voter turnout among whites — the racial/ethnic group most strongly in Trump’s corner — increased by 2.4 percentage points in 2016 compared to 2012. In stark contrast, turnout among African Americans — the group most loyal to Hillary Clinton and the Democratic Party — fell by 4.7 percentage points nationally. Latinos and Asian Americans, both groups that are generally Clinton supporters, were more likely to vote — by 3.8 and 3.0 percentage points, respectively.
These national averages obscure important patterns. Here’s what stands out: while the decline in black turnout was stark across the board, it was sharpest, on average, in the states that determined the outcome of the election. Black turnout fell by 4.3 percentage points in non-battleground states in 2016 compared to 2012. But it fell by 5.3 percentage points in states where the election was decided by a margin of less than 10 points.
Given how important African Americans are to the Democratic coalition, the swing-state collapse of black turnout seriously hurt Clinton.
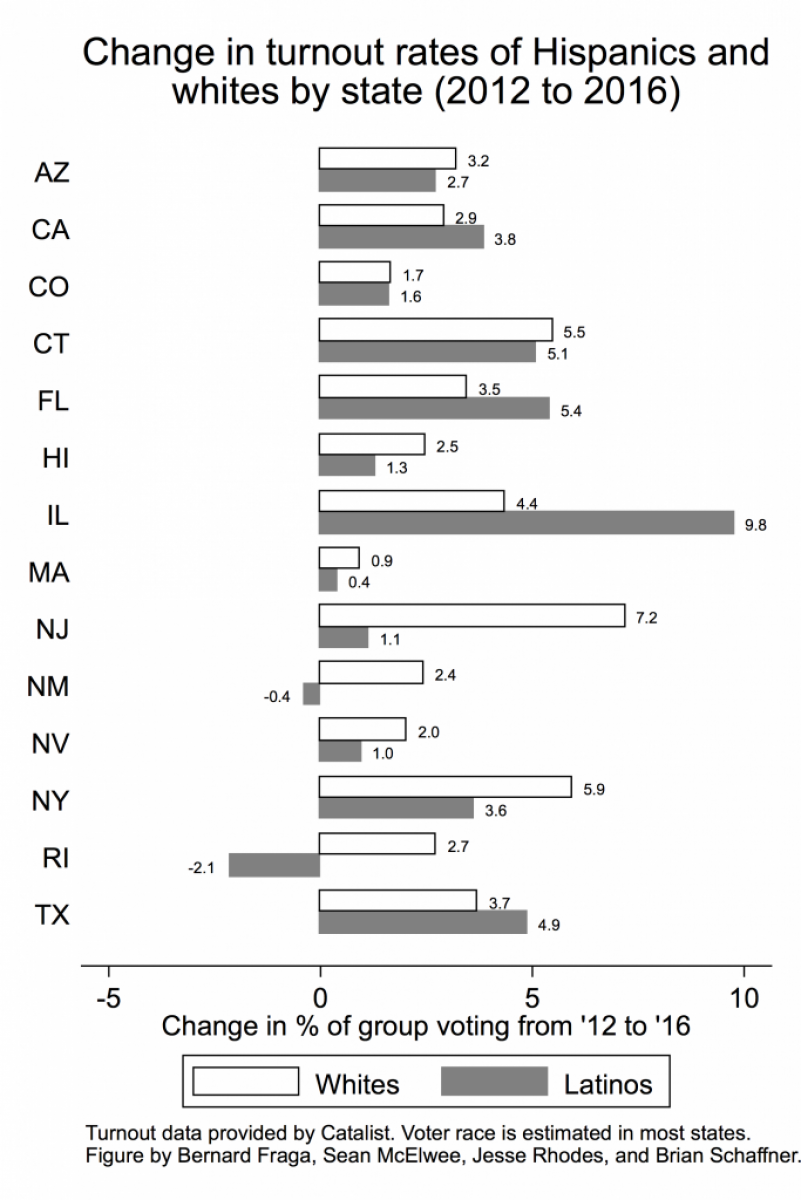
Let’s take an even closer look at particular states. The figures below show states where at least 3 percent of the population was African American or Latino, and shows the changes in African American and Latino voter turnout rates between 2012 and 2016.
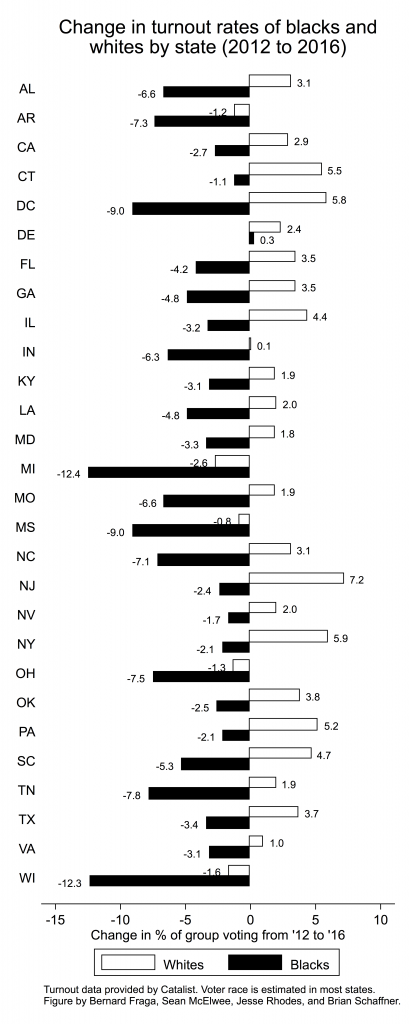
As you can see, the national average hides dramatic differences among states. For example, as we’ve said, the African American turnout rate fell by 4.7 points nationally. But in Michigan and Wisconsin — two key Midwestern states where, to analysts’ surprise, Trump won — black turnout fell by more than 12 points.
Similarly, overall white turnout increased by only 2.5 points nationally. But in several states it surged by more than 5 points. In the critical battleground state of Florida, white voter turnout jumped by 4 points — and black turnout fell by 4 points. Trump won Florida by a margin of just 1.2 points.
At the same time, Latino voter turnout jumped especially in Connecticut, Florida and Illinois. Nationally, as noted above, the increase was 3.8 points. But in Florida it went up 5.4 points — which may suggest the Clinton campaign did effectively mobilize Latino voters there.
Just as notably, in Texas the Latino turnout rate was up by 4.9 points, a state never expected to be close. But Trump won Texas by only nine points, a dramatic drop from Romney’s 16 point victory in 2012. And Arizona’s 2.7-point increase in Latino turnout helps to explain why Trump won that state by only 4.5 points, half of Romney’s 9 point margin in 2012.
Were these changes in voter turnout enough to decide the race?
To find out, we used the Cooperative Congressional Election Study to estimate the 2016 presidential vote choices of whites, African Americans, Latinos, and Asian Americans in each state. Then we set the turnout rates of each of these groups to their 2012 level, while keeping everything else as it was in 2016. You can see the results in the figure below.
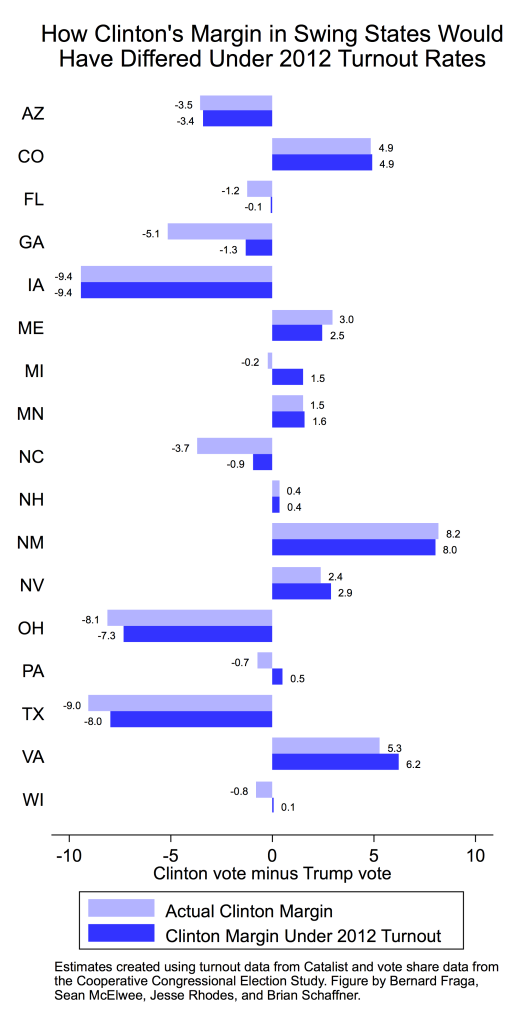
In most states, as you can see, the shifts are just a few tenths of a point. In 12 of the 15 battleground states this past election, 2012 turnout rates would have made no difference in who won.
But if groups had gone to the polls at the same rates as in 2012, Clinton would likely have won Michigan, Pennsylvania, and Wisconsin in 2016 — though in the last two cases by razor-thin margins.
If we changed nothing but the turnout rates of various racial and ethnic groups, in Michigan, the actual Clinton loss by .2 percentage points would have become a victory by 1.5 percentage points. Clinton’s actual loss by 0.7 percentage points in Pennsylvania would have been a 0.5 percent victory. And instead of Trump winning Wisconsin by 0.8 points, Clinton would have won by 0.1 percent. Clinton’s electoral college total would have been 278 votes, putting her in the White House.
Of course, these measures are estimates and subject to error. Interpret cautiously. But what’s clear is that the jump in white turnout in key swing states and drop in black turnout may well have handed the presidency to Trump.
Bernard L. Fraga is assistant professor of political science at Indiana University. Find him on Twitter @blfraga.
Sean McElwee is a policy analyst at Demos. Find him on Twitter @SeanMcElwee.
Jesse Rhodes is associate professor of political science at the University of Massachusetts in Amherst. Find him on Twitter @JesseRhodesPS.
Brian Schaffner is professor of political science at the University of Massachusetts-Amherst. Find him on Twitter @b_schaffner.
Spread the word