

The Voting Rights Act of 1965 was supposed to settle the debate over race, redistricting and representation. Instead, it started new ones.
Since the act prohibits states from reducing a minority group’s ability to elect its candidate of choice, the creation — and erasure — of majority-minority districts has become a particularly contentious aspect of the decennial redistricting process. Race is hugely important in understanding American politics and is strongly predictive of partisan preferences, so districts’ racial makeup can influence electoral outcomes and affect representation of people of color. Voters of color tend to be more Democratic-leaning and white voters tend to be more Republican-leaning. More broadly, candidates of color are more likely to get elected in districts in which the candidate’s racial or ethnic group constitutes a majority.
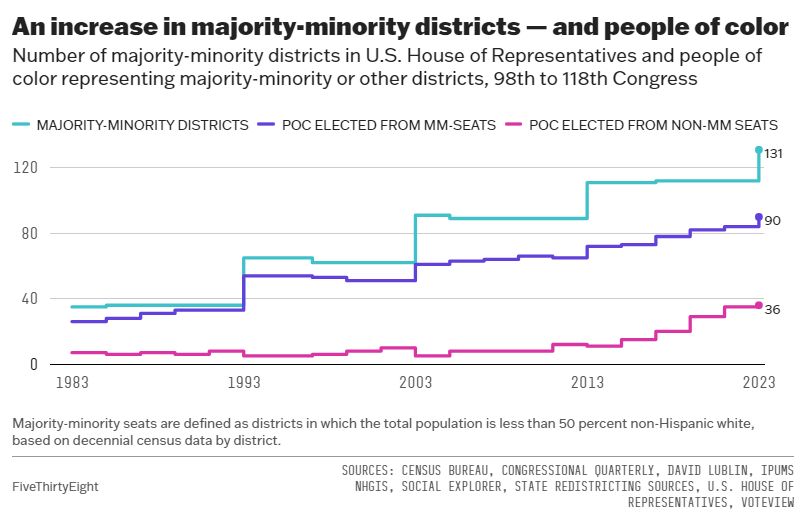
In an increasingly diverse nation, these trends have helped remake the congressional map: Districts in which one or more minority racial or ethnic groups constitute a majority of the population now make up nearly one-third of all House seats. Correspondingly, the number of representatives who identify as Black, Latino, Asian, Pacific Islander, Native Hawaiian, American Indian and/or Alaska Native has also increased. Around 7 in 10 of these members hail from majority-minority seats, indicative of these seats’ importance in ensuring representation for minority groups. At the same time, people of color are winning more majority-white seats than in the past. Success in those sorts of districts has increased as our politics have grown more partisan, as voters are increasingly likely to back their party regardless of the candidate their party nominates.1
We took a look at the racial and ethnic makeup of each congressional district going back to the 1960s and ’70s.2 Though Congress has long trended toward increased racial and ethnic diversity, the overall trajectory of majority-minority seats and minority representation is neither linear nor consistent across racial and ethnic groups. The number of majority-Black seats has fallen, even as Black representation in Congress has increased. Majority-Latino districts and Latino representatives have climbed, although Latino representation remains complicated by the lower share of Latinos who are in the citizen voting age population. Asian Americans — the fastest-growing racial group in the American electorate — and Pacific Islanders (AAPI) have seen representation in Congress shoot up in the last two decades. However, it’s been completely divorced from the number of majority-Asian congressional districts, which hasn’t increased in 50 years. And the number of representatives who identify as American Indian or Alaska Native has also ticked up, despite this small group constituting neither a majority nor a plurality of any district.
The evolution of majority-minority seats and representation for these four major racial and ethnic groups over the last half century shows both the continued need for majority-minority districts to ensure representation, but also that broader forces — the strength of partisanship and the close ties between voting habits and race — have elevated candidates of color in districts where they weren't winning a few decades ago. “I think about where we've come since 1965,” said Paru Shah, a political scientist who studies race and politics at the University of Wisconsin-Milwaukee. “And this idea that the majority-minority place is really the driver for representation, to today where it's much more around partisanship.”
Black districts have dwindled even as representation ticks up
In the wake of the Voting Rights Act, Black voters quickly got easier access to the franchise, but electoral district changes were slower to come by. “After [the VRA] passed in 1965, Southern states immediately moved to another set of strategies to try and minimize the influence of Black voters,” said American University political scientist David Lublin, who studies race and representation. “That was by drawing districts so that there would be very few places where Blacks formed a majority, and African American candidates would find it difficult to win in the face of racially polarized voting.”
But in the aftermath of the Supreme Court’s 1986 decision in Thornburg v. Gingles, the Justice Department and voting rights advocates forced states to make a more concerted effort to draw majority-minority seats. This most impacted majority-Black districts, which nearly doubled from 17 to 32 during the post-1990 census redistricting. Not coincidentally, that increase coincided with a rise in the number of Black representatives, as candidates of color at that time only rarely won in majority-white seats.
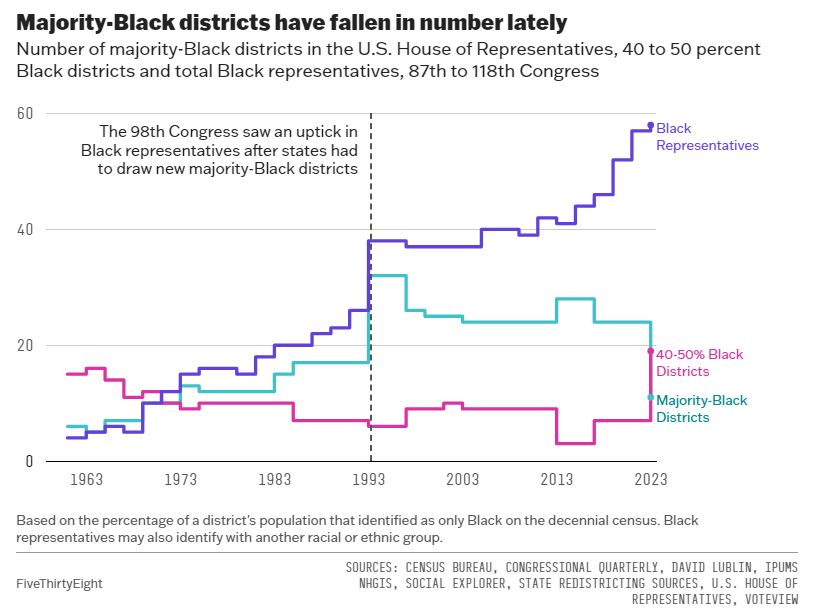
But after the 2020 round of redistricting, majority-Black constituencies were roughly halved while seats that were 40 to 50 percent Black nearly tripled. Slow population growth in Northern states led to lost seats in reapportionment, which notably increased each state’s population per district and complicated drawing seats with Black majorities. For instance, New York’s three majority-Black districts in New York City became plurality-Black seats as the state lost a seat and the average number of people per district grew by about 60,000. Lines drawn by partisan mapmakers or independent redistricting commissions also affected the number of majority-Black seats. Florida, for example, drew two fewer majority-Black seats after the 2020 census (although those seats remained solidly majority-minority overall) and controversially unwound one plurality-Black seat; the latter move faces continued litigation.
Black representation, like that of other groups, also intersects with our sharply polarized politics. Because voters of color tend to lean Democratic — Black voters overwhelmingly so — concentrating voters of color in one district can make surrounding seats more Republican. As a result, recent redistricting conflicts have largely centered on GOP attempts to pack more Black voters in majority-Black districts to make nearby seats redder and Democrats’ efforts to unpack heavily Black districts to add Democratic-leaning voters to surrounding districts. Lublin’s research shows that Black candidates (again usually Democrats) can regularly win seats that are 40 to 50 percent Black, depending in part on the share of white voters in the seat and how Republican-leaning they are. Lublin cited Virginia’s 4th District in south-central Virginia as an example of a seat with a Black population in the low 40s in which a Black member (currently Democratic Rep. Jennifer McClellan) is relatively certain to win because the seat is blue-leaning and Black voters make up a majority of the Democratic primary electorate. By comparison, the ongoing redistricting clash over whether Alabama will draw a second majority-Black seat reminded Lublin of older fights in the South in which mapmakers made bare-minimum changes to seats so that the seat would remain challenging for a Black Democrat to win.
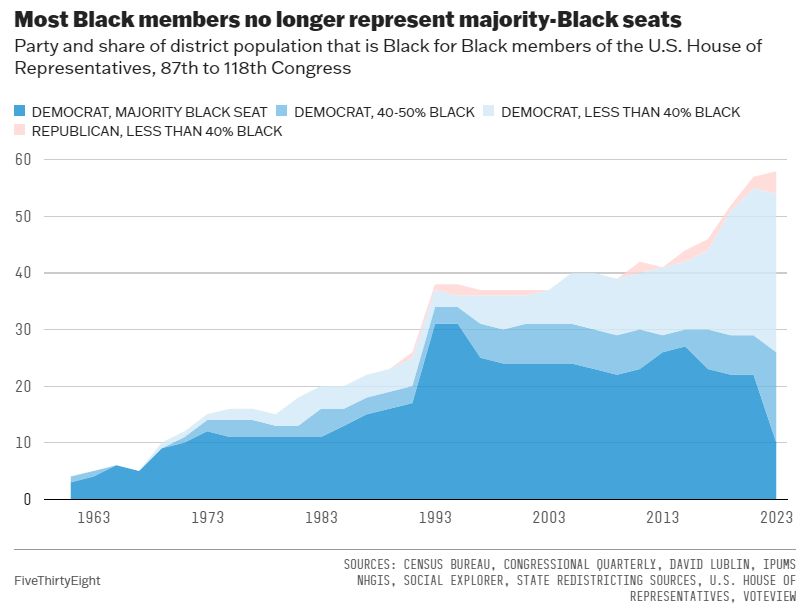
Today, roughly the same number of Black Democrats (28) represent seats that are less than 40 percent Black as represent districts that are 40 percent or more Black (26). Now, 17 of those 28 seats are majority-minority overall, and most of the 28 have a clear Democratic lean. But on average, those districts’ populations are just 22 percent Black, which indicates that Black representatives are winning more on multiracial or majority-white turf. Plus, a modern high of four Black Republicans sit in the House, all of whom represent majority-white districts.
“There’s this interesting interplay of partisanship and race,” said Shah, the political scientist at the University of Wisconsin-Milwaukee. “Democrats win in Democratic majority places and Republicans win in Republican majority places. And when candidates of color are supported by their party in those places, they tend to do well.” She emphasized that majority-minority districts remain important, but that both parties’ efforts to highlight and recruit candidates of color have created chances to increase diversity in legislatures, whether on Capitol Hill or in state capitals.
There are more majority- and plurality-Latino districts — and representatives
While the original VRA focused mainly on expanding Black political rights, the 1975 extension of the law expanded its rules to include “language minorities,” including Latinos. At that point, only five Latino representatives sat in Congress, all hailing from districts that were at least 40 percent Latino. At that time, however, only about 5 percent of the nation’s population identified as Hispanic or Latino, a figure that had nearly quadrupled by 2020.
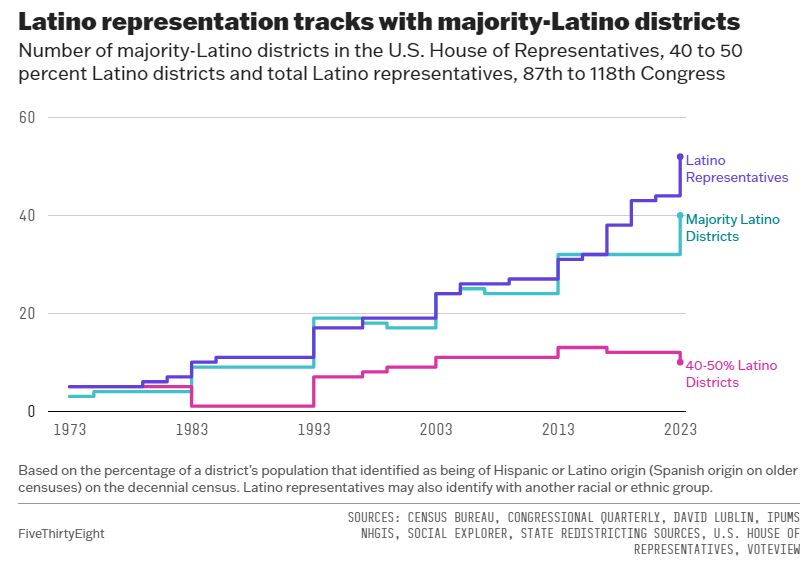
The relationship between majority-Latino districts and Latino congresspeople is roughly where it was for Black Americans around 20 years ago. Only in the past few congresses has the number of Latino members clearly risen above the number of majority-Latino districts. As with majority-Black seats, the post-1990 redistricting period following Thornburg v. Gingles also proved critical to Latinos, as states more than doubled the number of majority-Latino seats, increasing the number of Latino representatives. But unlike the pattern for majority-Black seats, the number of majority-Latino seats has steadily increased since then. A large part of this growth came in California and Texas, as their already sizable Latino populations grew by 42 percent and 72 percent, respectively, between the 2000 and 2020 censuses.
However, Latinos tend to make up a notably smaller share of the citizen voting age population than the overall population. A large share of Latinos are immigrants, so some aren’t citizens, and Latinos are also significantly younger on average than the non-Latino population. On top of this, turnout among Latinos has historically been lower than other racial groups. These forces can create large disparities between who lives in a district and who decides its elections. Take California’s 13th District: The overall Latino population share was 65 percent in 2020 but the CVAP Latino share was just 51 percent, per Daily Kos Elections.
Despite this, 33 of 40 majority-Latino districts are currently represented by Latino members. “Now, part of it may be that even if the non-citizen Latinos can't vote, it still means there's one fewer, say, white person who could vote,” said Lublin, referring to the requirement that districts have equal total populations regardless of age or citizenship status. “But be that as it may, what it suggests is that, if citizenship rates were 100 percent, Latinos would find it easier to win.” In fact, only three Latinos represent the 10 seats that are 40-to-50 percent Latino, which may be because the group’s share of the CVAP is roughly 10 points lower than its overall share in those seats.
When it comes to party affiliation, Latino representatives aren’t as uniformly Democratic as Black members, in part because the group is incredibly diverse and more electorally competitive. Latinos are not a monolith (nor are other groups of people of color, to be clear), and sometimes more granular groupings — like national origin — reveal more nuanced political leanings. For instance, Cuban Americans are notably GOP-leaning, while Mexican Americans have a clear Democratic preference. As a result, about 3 in 10 Latino members of Congress are Republican, compared with less than 1 in 10 Black members.
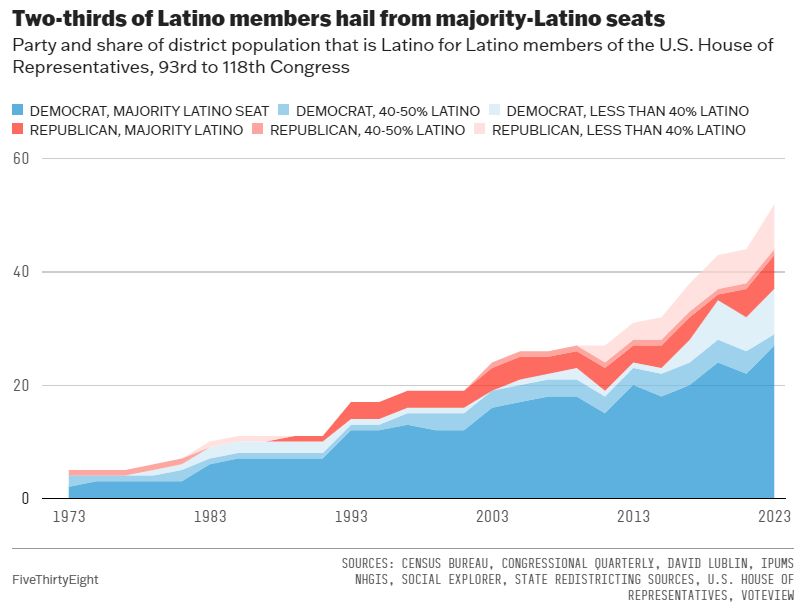
But two-thirds of these members hail from majority-Latino seats, a far greater share than among other minority groups. About one-third of all Latinos live in a majority-Latino district, compared with only 11 percent of African Americans in majority-Black seats, so some of that may be down to Latinos’ more sizable concentration in such districts. The types of candidates who run matter, too. As Shah’s research on state legislative races has found, Latino candidates tend to be less likely to run in districts that aren’t majority Latino, which largely siloes them in majority-Latino seats and limits the possibility of winning elsewhere. Nonetheless, that may be changing as the number of Latinos members elected from congressional seats that are less 50 percent Latino has grown in the past few cycles.
Few majority districts but more representation for AAPI and Indigenous Americans
The last two racial groups available in our data are enormously diverse but also comparatively small. About 6 percent of the nation’s population is AAPI, while American Indians and Alaska Natives make up about 1 percent3 As a result, there are only two majority AAPI seats in Congress — since the 1970s, there have never been more than that — and no districts where American Indians and/or Alaska Natives even form a plurality. Still, both groups’ representation has grown over time.
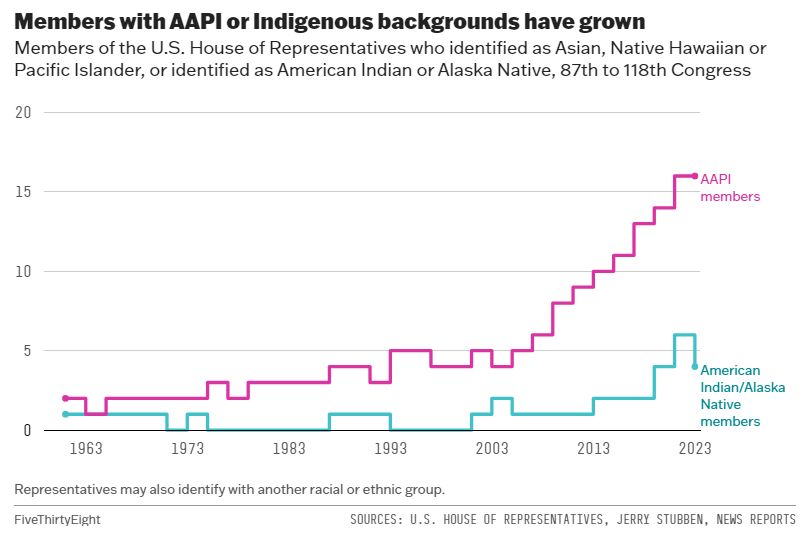
With so few majority- and plurality-AAPI districts, the striking increase in this group’s representation has largely come from candidates winning in districts with small shares of AAPI voters. Lublin’s research has found that Asian candidates, specifically, win with a lower share of Asian Americans in their district than Black and Latino candidates win with theirs and that Asian candidates also tend to do better as districts become more diverse overall. On average, the 16 AAPI members represent seats that are 22 percent AAPI (11 of those seats are majority-minority overall).
Representation among individuals with American Indian or Alaska Native backgrounds shot up with the election of Democratic Reps. Sharice Davids of Kansas and Deb Haaland of New Mexico in 20184 followed by GOP Rep. Yvette Herrell of New Mexico in 2020 and Democratic Rep. Mary Peltola of Alaska's special election victory in August 2022. Dating back to the 1970s, no congressional district’s population has had more than a quarter identify as American Indian or Alaska Native. Because of their small population, only a larger House with more representatives and seats with smaller populations could create the conditions where they might form even a plurality of the population in states like Arizona, New Mexico or Oklahoma.
Redistricting fights over majority-minority districts aren’t going away — indeed, two are currently ongoing in Alabama and Louisiana — even if candidates of color are now winning more on turf where their racial or ethnic group isn’t predominant. We’re nowhere near settling the bigger questions surrounding race, racial representation and the electoral power afforded to minority voters, nor can we predict the trajectory of minority representation in Congress. One thing we can be sure of, however, is that the country will become even more diverse, which will influence every aspect of our politics, including redistricting and representation.
Additional contributions from Holly Fuong.
Geoffrey Skelley is a senior elections analyst at FiveThirtyEight.
FiveThirtyEight
Mission
We use data and evidence to advance public knowledge — adding certainty where we can and uncertainty where we must.
Values
The values we aspire to in our journalism …
Empiricism — We base our stories on evidence. We use many different kinds of evidence — data, reporting, first-hand experience, academic research, etc — but we also interrogate it for underlying biases.
Accuracy and completeness — Our primary standard is: “Is this accurate and does it present as complete a picture as possible?” and not some impossible “objectivity” or ideological centrism. We’re rigorous, and make every effort to test our hypotheses and assumptions. When the truth runs contrary to prevailing narratives we aren’t afraid to push back.
Transparency — We show — and share — our work. That means we explain how we reached our conclusions, and whenever possible, share the data behind our stories. It also means we acknowledge that we bring our own biases and perspectives to the work. The data does not speak for itself; we’re doing the speaking, and that requires us to think and work through how our own perspectives might influence our journalism and try to account for them.
Inclusivity — We make work that is relevant and accessible to a diverse audience. We make journalism for and about people of all identities — by race, gender, age, ability and background. We make journalism for readers, not for other journalists. And we make journalism for everyone, not just experts.
Humility — Our understanding of the world is iterative. We aren’t afraid to say, “we don’t know,” or that our old analysis is now outdated, and with new evidence our argument has changed. When we’re wrong, we say we were wrong.
Personality — Our journalists can bring their whole selves to their work. We share who we are and let the personalities of our journalists shine through.
Spread the word