
Chicago’s 2015 mayoral race was one of the most expensive in the nation’s history, with big donors playing an outsized role in financing both candidates’ campaigns. In fact, over 90 percent of the money raised by the two major candidates came from donors giving more than $1,000, and more than half (52%) came from donors outside of the city. Both the Chicago mayoral and council elections are primarily financed by white, male donors who don’t reflect the racial and class diversity of the city’s residents. The experience in Chicago is emblematic of national elections, where a small cadre of white major donors—.01 percent—accounted for over 40 percent of all campaign contributions. New research provides disturbing evidence that the financing of our elections by a small group of big donors has very real consequences in terms of the public policies that get enacted. In fact, when the preferences of the donor class diverge with those of the average voter, it is the donor class’s preferences that win. But donors and voters don’t always agree. For example, while 34% of non-donors living in Chicago support the Bowles-Simpson austerity plan, 62% of Chicago donors do. The preferences of the white, male and rich donor class diverge strongly from ordinary Chicagoans but it’s their agenda that’s being implemented. The solution is a robust public financing system that empowers the more diverse small donor pool and brings more diverse voices to the political system.
This report uses a pioneering new method to investigate Chicago’s the demographics of the donor class. It is the first systematic investigation of race, class and gender disparities in campaign finance at the municipal level. In addition, the report shows how the views of donors and typical Chicagoans differ, often dramatically. The report’s key findings:
- The 2015 mayoral election was dominated by big money, with candidates raising more than 92% of their funds from donors giving $1,000 or more.
- These big donors are disproportionately white. Though whites make up 39% of the population of Chicago, they make up 88% of donors giving more than $1,000. While only 6% of Emanuel’s donors were people of color, 39% of Garcia’s donors were.
- Chicago donors are overwhelmingly high-income. Though only 15% of Chicagoans make more than $100,000, 63% of donors did and 74% of those giving more than $1,000 did.
- The donor class is more supportive of budget cuts than average Chicagoans and more opposed to policies that would bolster opportunity.
- In the council races there were also deep disparities. In these races, 79% of donors were men, 82% were white and 54% had an income over $100,000.
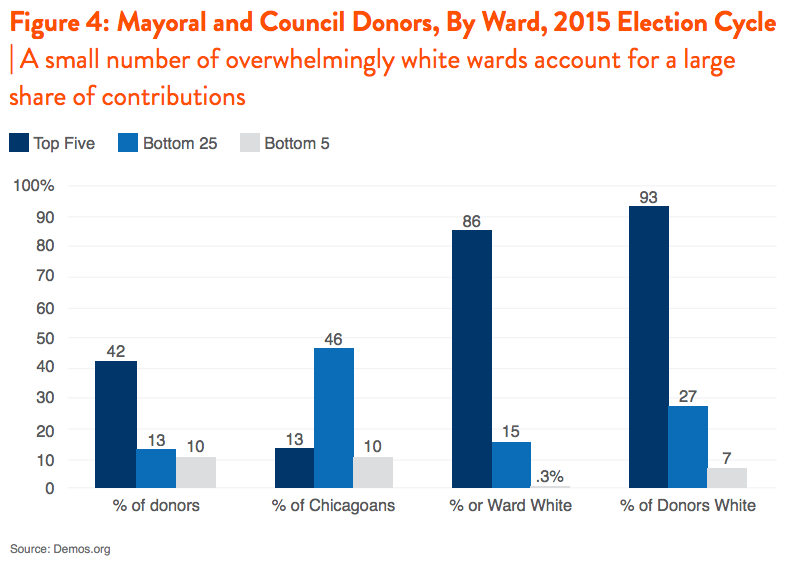
- Only five overwhelmingly white wards accounted for 13 percent of Chicago’s population, but 42 percent of donors to the Chicago mayoral and aldermanic races.
THE DONORS BEHIND CHICAGO ELECTIONS:
WEALTHY, WHITE AND MALE
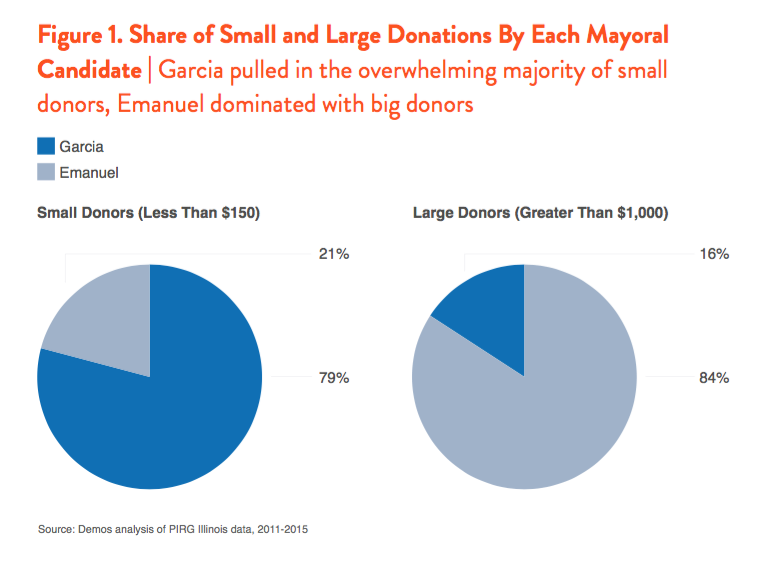
In 2015, the two mayoral candidates—Rahm Emanuel and Jesus “Chuy” Garcia—raised significant amounts of money for their campaigns. Leading up to his mayoral race in 2015, Emanuel raised a total of $24.4 million while his competitor, Garcia raised $7.1 million. However, their donations came from dramatically different sources. During the period between February 2011 and April 2015 Garcia raised $482,809 from donors giving less than $150, nearly four times the amount that Emanuel raised from small donors. The opposite is true with big donors—those giving more than $1,000—with Emanuel raising $21.2 million from large donations, more than 5 times the amount Garcia raised from the group (see Figure 1). In the 2015 aldermanic elections, 93% of the candidates that raised the most money won their election.
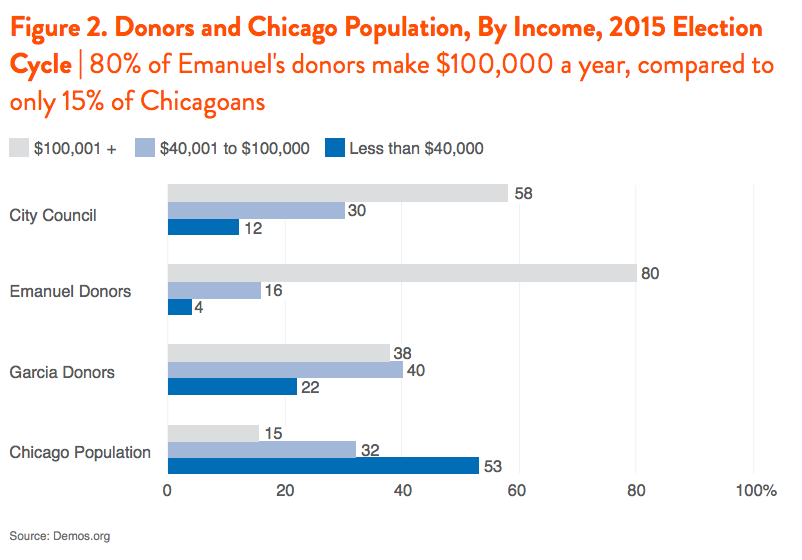
Given the dominance of large donors, it’s not surprising that the demographic profile of donors skews heavily white, male and wealthy. As Figure 2 shows donors to city races were overwhelmingly culled from higher-income individuals, who made up three-quarters of Emanuel’s donors and a bit more than one-third of Garcia’s donors. Council races were similarly dominated by wealthy individuals, who made up 58 percent of contributions.
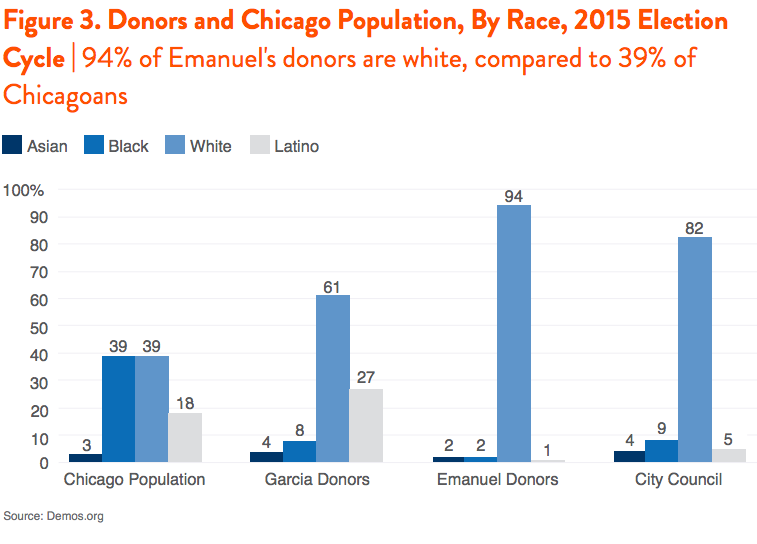
As Figure 3 shows, nine out of 10 of Rahm Emanuel’s donors and six out of 10 of Jesus Garcia’s donors were white, despite white Chicagoans representing just 39 percent of the city’s population. In contrast, people of color, who comprise 61 percent of Chicago’s population, make up only 18 percent of all donors to both Mayoral and Alderman races (see Figure 2).
Given its long history of segregation, the geography of where donors live, and the demographic composition of donor-heavy neighborhoods are heavily skewed toward white, more affluent neighborhoods. Figure 4 shows that the five wards with the largest numbers of donors to both Mayoral and council campaigns (43, 42, 2, 47 and 44) account for 42 percent of all political donors, but are home to just 13 percent of Chicagoans. And nearly a quarter of all political donors reside in just two wards (42 and 43), where a mere 5 percent of Chicago’s population reside. The five wards responsible for more than a third of donors are 86 percent white, as are the 93 percent of donors from these wards. On the other hand, the five wards with the smallest number of political donors comprise only .4 percent of all donors, much lower than the 10 percent of Chicagoans who reside in those wards. The five wards with the lowest percentage of donors are predominantly black neighborhoods (more than 90%). The 25 wards with the smallest percentage of donors—home to nearly half of Chicago’s population—account for just 13 percent of donors. The disparity in donors geographically could affect services and responsiveness, since policymakers would have a strong incentive to prioritize the needs of high donor, overwhelmingly white wards.
Many donors do not reside in the city of Chicago. While 65 percent of council donors live in the city, only 48 percent of mayoral donors do. The candidates differed dramatically in the share of their donors living outside of Chicago. Only 36 percent of Emanuel’s donors lived in Chicago, compared with 56 percent of Garcia’s donors.
Mid-Level Donors Slightly More Diverse
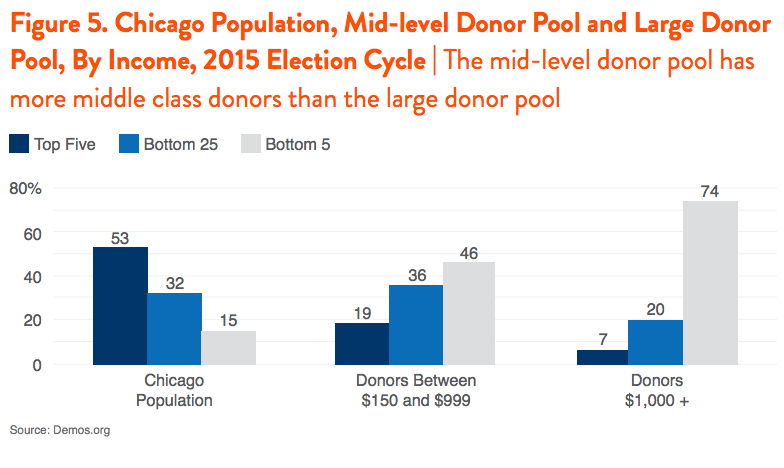
While Chicago’s electoral races are dominated by large donors giving over $1,000, a not insignificant percentage of donors contribute what we consider “mid-level” contributions, those between $150 and $999. Unfortunately, small donations are not required to be disclosed in Illinois, making it impossible for us to compare the demographics of small, mid-level and large donors. However, data from other Demos studies suggests that the smaller donor pool is far more diverse than the large donor pool. And the data from Chicago’s races show a similar pattern, with mid-level donors being somewhat more reflective of Chicago’s population. For instance, while more than half of Chicago’s general population have in income below $40,000 a year, only 19 percent of donors in the mid-level pool and 7 percent of the large donor pool do. While only 15 percent of Chicagoans make more than $100,000 a year, 46 percent of medium donors and 74 percent of large donors do (see Figure 5).
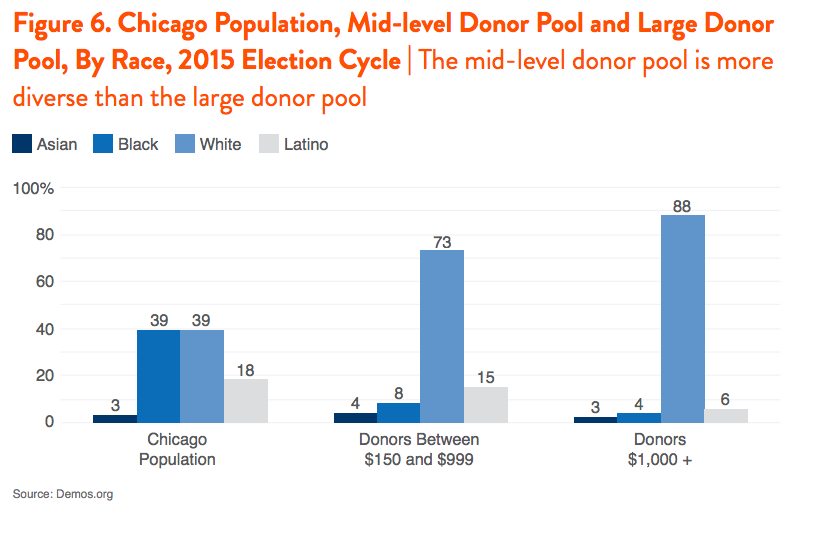
Latinos make up a fifth of Chicago residents and 15 percent of the medium-sized donor pool, but only 6 percent of the large-donor pool. African-Americans make up 39 percent of the Chicago population, but 8 percent of mid-level donors and a mere 4 percent of large donors. Asians make up 3% of the population, 4% of mid-level donors and 3% of large donors. And finally, whites make up 39 percent of the population they make up an overwhelming share of both the large and mid-level donor pool. Women make up 34% of medium-sized donors, but 27% of large donors (see Figure 6).
DONORS HAVE DIFFERENT POLICY PREFERENCES THAN MOST CHICAGOANS
According to data from the Cooperative Congressional Election Studies, only one-third of non-donors who live in Chicago support the Bowles-Simpson plan to cut expenditures on Social Security, Medicare, Medicaid and defense spending to reduce the debt—while nearly two-thirds of Chicago donors support the austerity plan.
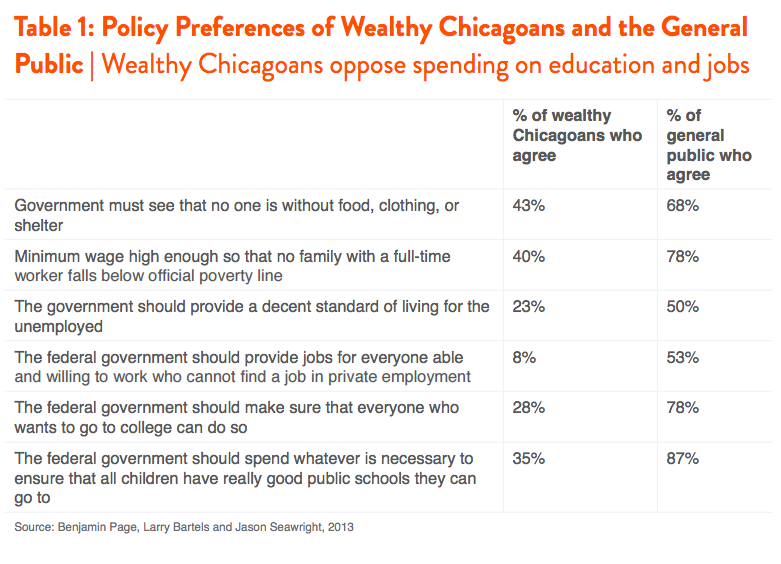
In 2012, three political scientists performed a survey of wealthy Chicagoans (called the Survey of Economically Successful Americans, or SESA) and compared their preferences to those of the general population. Those surveyed had a median wealth of $7.5 million and two-thirds of them were political donors. The authors use the sample to examine the policy preferences of the wealthy in general, but given that the survey was Chicago-based it offers insights into how the donor class influences policy. As the table shows, the wealthy are far less likely to support a living wage and the government ensuring a decent standard of living.
While more than three-quarters of the general public agree that the government should “make sure everyone who wants to go to college can do so,” only 28% of the wealthy agree. While nearly nine in 10 average Americans agree that the government should spend whatever necessary to ensure all children attend a good public school, only 35% of the rich agree.
Although the questions are not identical to the SESA survey, a poll of Illinois residents finds that only 16 percent favor cuts to K-12 education, and less than a quarter support cuts to programs for poor people. Only 13 percent of Illinois residents support cuts to programs for those with mental health problems. There are deep divides between the donor class and the general public. The current path Chicago is following, with cuts to mental health services, infrastructure and public schools, is responsive to the preferences of the donor class, not average Chicagoans. Chicago has closed 49 schools, predominantly in black neighborhoods. In addition, the city has closed six of the city’s 12 mental health clinics, which was supposed to pull in $2.2 million in savings, though the city then paid $500,000 to private facilities in order to meet demand. A recent wave of spending cuts hit Chicago State University, the only state college that predominantly serves Black students, particularly hard. The college may have to close, or dramatically reduce staff and classes offered.
Cuts to higher education can be harmful, as studies show that higher education spending bolsters voter participation, improves economic growth and lowers crime rates. In addition, public education cuts saddle students with debt, which leads to a lifetime wealth loss and disproportionately harms students of color. Such cuts are unpopular with the residents of Illinois, who according to a 2015 poll, overwhelmingly oppose cuts to state universities (36 percent in favor) and programs for the poor (23 percent in favor). The cuts show how the influence of the wealthy white male donor class can disproportionately impact people of color and low-income people.
THE CASE FOR PUBLIC FINANCING
A study of New York City’s 2009 municipal election finds that “donors giving $10 or less live in neighborhoods that are more racially diverse than the city as a whole.” Research suggests that the city’s public matching system (which uses public funds to match small donations) increased the diversity of the city’s donor pool. Other research suggests that the small donor pool tends to be more racially diverse than the large donor pool. The data from Chicago show this was well (see Figure 6).
After public financing was passed in Connecticut, Demos talked with numerous legislators about their experiences. On legislator reported, “I announced my reelection bid in February and by April, I was done fundraising. So, from April to November, I could focus only on talking to constituents. Without public financing, I would have been fundraising through that entire period.” This fits well with research by political scientist Michael G. Miller who examines competitive elections and finds that traditionally funded incumbents and challengers reported spending 11% of their time on fundraising, while fully funded incumbents spent less than 1% of their time fundraising and challengers spend about 1.5% of their time fundraising. Miller finds a nearly 12 percentage point increase in the share of time clean election candidates spend interacting with voters. Other political science research supports this conclusion. Another elected official reported that, “Before public financing, during the session…there were ‘shakedowns’ where lobbyists and corporate sponsors had events and you as a legislator had to go. That’s no longer a part of the reality.”
CONCLUSION
Chicago’s democracy is being distorted by an overwhelmingly, white, wealthy and male donor class. But public financing provides a clear solution. The “Fair Election Ordinance,” introduced on January 13, 2016 would match all small donor contributions up to $175, increasing the influence of the most diverse small and mid-level donor pool. It would reduce the influence of big money donors, creating a more equitable democracy. A study of the New York Public Financing system show that it dramatically increased donor diversity, and the data from Chicago suggest why: the small donor pool is more diverse. By empowering small donors, Chicago would reinvigorate its democracy.
APPENDIX
The donor demographic data in this report are based on analysis of Illinois State Board of Elections data performed by Brian Schaffner and Jesse Rhodes of University of Massachusetts Amherst in collaboration with Demos. They used the Illinois State Board of Election’s website in order to find data on contributions made during Chicago’s 2015 elections for Mayor and Alderman. To find donations to each of two mayoral candidates, Rahm Emanuel and Jesus Garcia, they searched for donations made to each candidate’s campaign starting from the end of the prior election cycle in 2011 (more specifically, starting May 16th, 2011, the day Rahm Emanuel was sworn in) through the end of the runoff election on April 7, 2015. This provided a unique spreadsheet containing the donation amount and the names and street addresses of the contributor for each candidate. They used the same time parameters in our search for donations made to the Alderman race. There were 50 city council seats up for election in 2015; they therefore restricted our search to contributions made during the election cycle to candidates seeking the office of Alderman. These search criteria returned a spreadsheet containing the amount and source of a donation, and the name of the candidate to whom a donor made a contribution.
They then collapsed the data collected from the Illinois Election’s website to create one record for each individual donor in each of the groupings. That is, if one individual gave $200 to Emanuel three times, they created a single record for that individual reflecting that she had given $600 total to Emanuel. These records were then matched into Catalist to extract demographic information on the donors. They were able to successfully match 92% of Emanuel’s donors, 95% of Garcia’s donors, and 89% of donors to Aldermen races into Catalist. Thus, this data provides very comprehensive coverage of Chicago donors. For gender, income and race, around 2% to 5% of the population could not be coded. These respondents were removed from sample. This does not significantly affect the final analysis.
_________________________________________________
Abe Scarr, “Final Numbers Show Big Money Dominated Chicago Mayoral Elections,” July 16, 2015, Illinois PIRG Education Fund, available at: http://illinoispirgedfund.org/news/ilf/final-numbers-show-big-money-dominated-chicago-mayoral-elections. Additional calculations based on an analysis of data provided by Scarr to Demos. The data were retrieved from the Illinois State Board of Elections. The data span the period from 2/23/2011 to 4/07/2015. According to reporting by the Chicago Tribune, between April and June, Emanuel raised an additional $2.1 million and Garcia raised an additional $1.4 million. Bill Ruthhart, “Final tally: Emanuel raised $24.4 million to win re-election,” Chicago Tribune, July 17, 2015, available at: http://www.chicagotribune.com/news/local/politics/ct-rahm-emanuel-campaign-fundraising-met-0718-20150717-story.html. The percentage of donors coming from outside of Chicago is based on the Demos dataset, not the PIRG’s report.
CrowdPac, “How much do the 1% of the 1% control politics?” April 21,2015, available at: https://www.crowdpac.com/blog/the-1-percent-of-the-1-percent.
Sean McElwee, “A New Study Shows How Donors Distort Democracy,” Policyshop, February 18, 2015, available at: http://www.demos.org/blog/2/18/15/new-study-shows-how-donors-distort-democracy.
These numbers that analyze the comparative donor pools of Emanuel and Garcia are based on Demos and PIRG analysis of Illinois State Board of Elections Data. The data span the period from 2/23/2011 to 4/07/2015, during which time Emanuel raised $22.3 million and Garcia raised $5.1 million. The full totals come from reporting by the Chicago Tribune, which reports that between April and June, Emanuel raised an additional $2.1 million and Garcia raised an additional $1.4 million. That leaves the full total at $24.4 million for Emanuel and $7.1 million for Garcia. Bill Ruthhart, “Final tally: Emanuel raised $24.4 million to win re-election,” Chicago Tribune, July 17, 2015, available at: http://www.chicagotribune.com/news/local/politics/ct-rahm-emanuel-campaign-fundraising-met-0718-20150717-story.html.
These numbers are based on Demos and PIRG analysis of Illinois State Board of Elections Data. The data span the period from 2/23/2011 to 4/07/2015. According to reporting by the Chicago Tribune, between April and June, Emanuel raised an additional $2.1 million and Garcia raised an additional $1.4 million. Bill Ruthhart, “Final tally: Emanuel raised $24.4 million to win re-election,” Chicago Tribune, July 17, 2015, available at: http://www.chicagotribune.com/news/local/politics/ct-rahm-emanuel-campaign-fundraising-met-0718-20150717-story.html.
Illinois Public Interest Research Group, “The Money Primary,” (April 2015) available at: http://www.illinoispirgedfund.org/sites/pirg/files/reports/The%20Money%20Primary%20Final%204.1.15_0.pdf.
Adam Lioz, “Stacked Deck: How the racial bias in our big money political system undermines our democracy and our economy,” Demos, (2015), available at: http://www.demos.org/publication/stacked-deck-how-racial-bias-our-big-money-political-system-undermines-our-democracy-a-0.
These data use four surveys pooled from 2010 to 2014, and include all political donations, not simply those running for municipal office.
Benjamin Page, Larry Bartels and Jason Seawright, “Democracy and the Policy Preferences of Wealthy Americans,” Perspectives on Politics, Vol. 11, No. 1 (March 2013), available at: http://faculty.wcas.northwestern.edu/~jnd260/cab/CAB2012%20-%20Page1.pdf
Paul Simon Public Policy Institute, “Plurality of Illinois Voters Believe Budget Fix Needs Revenue Increases;
Most Oppose Cuts in Services,” March 23, 2015. Available at: http://paulsimoninstitute.siu.edu/_common/documents/opinion-polling/simon-institute-poll/2015/simon-poll-2015-march-revenue-increases.pdf.
Rick Perlstein, “Rahm Emanuel’s Minority-Bashing School Closings Go Forward,” The Nation, August 26, 2013. Available at: http://www.thenation.com/article/school-daze-rahm-emanuels-minority-bashing-school-closings-go-forward/.
Ben Joravsky, “Before the schools, Mayor Emanuel closed the clinics,” Chicago Reader, March 26, 2013. Available at: http://www.chicagoreader.com/chicago/mayor-emanuel-closes-city-mental-health-clinics/Content?oid=9145051.
CBS Chicago, “Chicago State University Students Rally In Loop To Protest Possible Shutdown,” February 8, 2016. Available at: http://chicago.cbslocal.com/2016/02/08/chicago-state-university-students....
BIS Research Paper, “The Benefits of Higher Education Participation for Individuals and Society,” October 2013. Available at: https://www.gov.uk/government/publications/benefits-of-participating-in-higher-education-key-findings-and-reports-quadrants ; Lisa Farrell, Colm Harmon, Carol Laffan and Conor O’Carroll, “Economic And Social Impact of Higher Education,” November 2006. Available at: http://researchrepository.ucd.ie/bitstream/handle/10197/672/harmonc_report_pub_019.pdf?sequence=3.
Robert Hiltonsmith, “At What Cost?,” Demos, August 2013. Available at: http://www.demos.org/what-cost-how-student-debt-reduces-lifetime-wealth.
Mark Huelsman, “The Debt Divide,” Demos, May 19, 2015. Available at: http://www.demos.org/publication/debt-divide-racial-and-class-bias-behin....
Paul Simon Public Policy Institute, “Plurality of Illinois Voters Believe Budget Fix Needs Revenue Increases;
Most Oppose Cuts in Services,” March 23, 2015. Available at: http://paulsimoninstitute.siu.edu/_common/documents/opinion-polling/simon-institute-poll/2015/simon-poll-2015-march-revenue-increases.pdf.
Sundeep Iyer, Elisabeth Genn, Brendan Glavin, Michael J. Malbin, “Donor Diversity Through Public Matching Funds,” Brennan Center for Justice, May 14, 2012, available at: http://www.brennancenter.org/publication/donor-diversity-through-public-matching-funds.
Wesley Y. Joe, Michael J. Malbin, Clyde Wilcox, Peter W. Brusoe, Jamie P. Pimlott, “Do Small Donors Improve Representation? Some Answers from Recent Gubernatorial and State Legislative Elections,” Campaign Finance Institute (2008), available at: http://www.cfinst.org/pdf/books-reports/APSA_2008_SmallDonors.pdf.
J. Mijin Cha and Miles Rapoport, “Fresh Start: The Impact of Public Financing In Connecticut,” Demos, (2013), available at: http://www.demos.org/publication/fresh-start-impact-public-campaign-financing-connecticut.
Peter L. Francia and Paul S. Herrnson, “The Impact of Public Finance Laws on Fundraising in State Legislative Elections,” American Politics Research, Vol. 31, No. 2 (2003): 520-539, available at: http://apr.sagepub.com/content/31/5/520.abstract.
J. Mijin Cha and Miles Rapoport, “Fresh Start: The Impact of Public Financing In Connecticut,” Demos, (2013), available at: http://www.demos.org/publication/fresh-start-impact-public-campaign-financing-connecticut.
Sundeep Iyer, Elisabeth Genn, Brendan Glavin, Michael J. Malbin, “Donor Diversity Through Public Matching Funds,” Brennan Center for Justice, May 14, 2012, available at: http://www.brennancenter.org/publication/donor-diversity-through-public-matching-funds.
As policy analyst, Sean McElwee produces innovative new research and timely analysis on democracy issues. Prior to joining Demos in October 2013 as a research intern, Sean held numerous internships in the fields of journalism and public policy, including at Salon and CBS News.
Sean has written essays for numerous influential publications including The Atlantic, The New Republic, Rolling Stone, The Washington Post, Politico, New York and Boston Review. His work has been discussed onThe New York Times, Politifact, Mother Jones, CNN, Slate and The American Conservative, among others. He has been interviewed on Wisconsin Public Radio, The Progressive Radio Network, and New Hampshire Public Radio, among others.
Sean’s research and writing interests include how racism affects public policy, the impact of voter turnout on policy, and how economic inequality affects democracy.
Spread the word