
The Pay of Corporate Executives and Financial Professionals as Evidence of Rents in Top 1 Percent Incomes
The debate over the extent and causes of rising inequality of American incomes and wages has now raged for at least two decades. In this paper, we will make four arguments. First, the increase in the incomes and wages of the top 1 percent over in the last three decades should largely be interpreted as driven by the creation and/or redistribution of economic rents, and not simply as the outcome of well-functioning competitive markets rewarding skills or productivity based on marginal differences. This rise in rents accruing to the top 1 percent could be the result of increased opportunities for rent-shifting, increased incentives for rent-shifting, or a combination of both. Second, this rise in incomes at the very top has been the primary impediment to living standards growth for low and moderate-income households approaching the growth rate of economy-wide productivity. Third, because this rise in top incomes is largely driven by rents, there is the potential for checking (or even reversing) this rise through policy measures with little to no adverse impact on overall economic growth. Lastly, this analysis suggests two complementary approaches for policymakers wishing to reverse the rise in the top 1 percent’s share of income: dismantling the institutional sources of their increased ability to channel rents their way and/or reducing the return to this rent-seeking by significantly increasing marginal rates of taxation on high incomes.
Evidence on the Rise in Income Shares at the Top
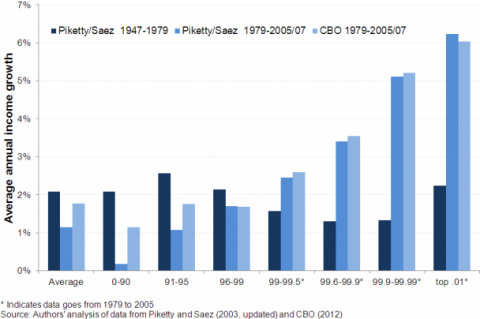
The facts of this rise in income shares at the very top are well-known, so our summary will be brief. Exhibit 1 summarizes the main points. It shows average annual income growth using the Piketty and Saez (2003, updated) data, which is based on cash, market-based incomes in two time-periods, 1947-1979 and 1979-2007. For comparison, the figure also looks at Congressional Budget Office (2012) data for the latter period on comprehensive incomes, which includes noncash benefits from employers and government transfers. The Piketty and Saez data indicate, for instance, that between 1979 and 2007, the top 1 percent of American tax units accounted for 59.8 percent of average growth in cash, market-based incomes, compared to just 9 percent of average growth in this period accounted for by the bottom 90 percent. While including transfers and non-cash incomes reduces the share of growth received by the top 1 percent significantly, as shown in the Congressional Budget Office data, the top 1 percent still account for 38.3 percent of growth, more than the 31.0 percent share received by the bottom 80 percent.
Average annual income growth by fractiles, by time-period and data-set |
The figure also illustrates several other points. First, the Piketty and Saez data indicate strongly that the rise in inequality is only a feature of the latter period: that is, on the figure, the darker bars on the left showing income growth for the 1947-79 period are fairly similar between the 0-90th percentile and the other measures shown. However, the measures the more recent period from 1979 to 2007 show much faster income growth at the upper levels of income.
Second, while measuring income using the cash, market-based data from Piketty and Saez does have some shortcomings, movements in these incomes do actually overwhelmingly drive trends in inequality even in the more comprehensive income data set tracked by the Congressional Budget Office. This finding should hardly be a shock, because cash, market-based incomes account for roughly 80 percent of all incomes even in the CBO data. Both of these points hold even more strongly when looking just at incomes in the top 1 percent and above: growth rates for these incomes are nearly identical in the latter period in both datasets, as the dominance of cash, market-based incomes is even much greater for the highest income households.
Third, the divergence in income growth rates for the bottom 90 percent in these two datasets is striking. In the Piketty and Saez data, the bottom 90 percent saw average annual growth of just 0.2 percent, as compared to 1.1 percent in the CBO data. We have noted elsewhere (Mishel et al. 2012, Table 2.13) that more than half of the income growth for households in the middle of the income distribution between 1979 and 2007 was driven by government transfers (dominated by Social Security and Medicare) and pensions currently received for past labor market service. These influences accounted for more than 80 percent of the rise in average incomes for the middle-fifth. Cash wages and salaries, conversely, accounted for just 6.1 percent of overall income growth for these families (while employer-sponsored health insurance contributions contributed 12 percent of overall growth in comprehensive incomes). We view the Piketty and Saez data as most reflective of how well the market economy has been providing income gains for households in the bottom 90 percent (not very well), while the CBO data provides a better measure of the actual living standards attained by this group.
Lastly, in both the Piketty and Saez data as well as the CBO data, income growth by fractile does not equal or exceed overall average growth below the 96th to 99th percentile average.
Table 1 provides an overview of the sources of income growth for the top 1 percent in the three decades before the Great Recession, using the broader definition of income from the Congressional Budget Office (2012) data. The first two rows show that that rising top shares have been driven by concentration within all forms of market income. In particular, the top 1 percent’s share of labor income doubled and the share of total capital income grew from 31.8 to 56.2 percent. The CBO data also indicates that the direct, arithmetic influence of taxes and transfers has been minimal, with rising inequality of market incomes explaining more than 100 percent of the rise in the after-tax income share of the top 1 percent (Mishel et al. 2012, Figure 2N) .
Sources of Top 1 Incomes
|
The next block of columns shows a shift from less-concentrated sources of income (particularly labor compensation) and towards more-concentrated sources of income (particularly capital gains and business income). The most striking finding here is the large decline in labor compensation’s share of total income, falling from 69.8 percent in 1979 to 60.3 percent in 2007. Correspondingly, the combined share of capital income (including capital gains) and business income rose substantially, from 18.3 to 22.8 percent.1 We have noted elsewhere (Mishel et al. 2012) that the rise in capital income’s share is driven overwhelmingly by a higher profit rate, not a rise in capital-output ratios. Finally, both other income (mostly pension payments for past labor services) as well as transfer incomes rise as a share of total incomes, from 3.2 percent to 6.3 percent over the period and 8.7 percent to 10.7 percent, respectively. The total effect of shifts between income categories – driven overwhelmingly by shifts from labor compensation to capital and business incomes – accounts for 2.6 of the total 9.8 percentage point increase in the top 1 percent share. Overall, however, the increasing concentration within categories of income made a bigger contribution to the rising income share of the top 1 percent than the shift between income category shares.
Besides their sources of income, the occupations of the top 1 percent have also been investigated. In a study of tax returns from 1979 to 2005, Bakija et al. (2010) show the trend in the shares of total income of U.S. households accruing to the top 1.0 and top 0.1 percent of households. They establish that the increases in income at the top were disproportionately driven by households headed by someone who was either an “executive” (including managers and supervisors and hereafter referred to as executives) in nonfinancial sectors or in the financial sector as an executive or other worker. Households headed by a non-finance executive were associated with 44 percent of the growth of the top 0.1 percent’s income share and 36 percent in the growth among the top 1.0 percent. Those in the financial sector were associated with nearly a fourth (23 percent) of the expansion of the income shares of both the top 1.0 and top 0.1 percent. Together, finance and executives accounted for 58 percent of the expansion of income for the top 1.0 percent of households and an even greater two-thirds share (67 percent) of the income growth of the top 0.1 percent of households. Relative to others in the top 1 percent, households headed by executives had roughly average income growth, those headed by someone in the financial sector had above average income growth and the remaining households (non-executive, non-finance) had slower than average income growth. In our view this analysis of household income data understates the role of executives and the financial sector since they do not account for the increased spousal income from these sources.
Mishel and Sabadish (2013) examine chief executive officers of 350 firms with largest revenue in any given year and show that their compensation grew 79 percent between 1965 and 1978during a period when the stock market (as measured by the Dow Jones and Standard & Poor’s indices) fell by about half (see Table 2). Average CEO compensation grew strongly over the 1980s but then exploded in the 1990s and peaked in 2000 at nearly $20 million, growing by a multiple of 13 or 14 from 1978 to 2000 (depending on whether one accounts for stock options as they are granted or as they are realized). This growth in compensation for chief executive officers far exceeded even the substantial rise in the stock market, which grew roughly five-fold in value over the 1980s and 1990s.
CEO compensation and stock growth, 1965–2012 (2012 dollars) |
Since 2000, compensation for chief executive officers first dropped after the fall in the stock market in the early 2000s, rebounded by about 2007, fell again in the financial crisis of 2008-2009, and then has rebounded again. By 2012, average compensation had returned to $14.1 million (measured with stock options realized) or $10.7 million (measured with options granted). The compensation of chief executive officers in 2012 is high by any metric, except when compared with its own peak in 2000 after the 1990s stock bubble. From 1978 to 2012, even with the setbacks provided by the 2001 and 2008 stock market crashes, CEO realized compensation grew 876 percent, more than double the real growth in the stock market. CEO compensation based on options granted grew a lesser” 685 percent that was still far in excess of stock market gains. In contrast, the hourly compensation of a private sector production/nonsupervisory worker grew a meager 5 percent.
This analysis of a narrow group of occupations’ role in driving top 1 percent incomes allows us to usefully narrow the argument about the role of rents in high incomes. That is, if one could establish that high compensation in just these two occupations (or sectors) is indeed heavily influenced by rents, and are not just the efficient marginal return to differences in skill and ability, then one has effectively made this case for the majority of the top 1 percent.
Rent-Shifting and the Rise in Top 1 Percent Incomes
In many discussions, “rent-seeking” refers loosely to ill-gotten gains. For example, it often refers to gains obtained by lobbying the government for some form of subsidy or preferential treatment, or for profits that stem from anti-competitive behavior. Such rents do exist, and powerful economic actors do indeed manage to influence policy to protect them from competition, and these probably do have non-trivial influences on some incomes in the top 1 percent. Legal and policy measures that enforce intellectual property claims, for example, surely play a key role in high incomes in Silicon Valley. However, in this paper we are referring to rents in a broader sense: in this discussion, a “rent” means only that the income received was in excess of what was needed to induce the person to supply labor and capital to these respective markets. As an illustrative example, it seems likely that many top-level professional athletes would continue to supply essentially the same amount of labor to their sport, even if their salary was reduced by some substantial fraction, because even the reduced salary would be much higher than their next-best options. Thus, we are making a positive argument, not a normative one, that the rise in income for the top 1 percent income was not necessary to entice the people in that group to seek those jobs nor to provide effort in those jobs. One implication of this is that even rents that do no not necessarily interfere with efficient allocation of talent (for example, those described in Gabaix and Landier (2008) and Tervio (2008) can be redistributed (say by progressive marginal taxation) –without introducing economic distortions. And where rents do stem from institutional arrangements that block the efficient allocation of resources (as in many of the models of financial sector rents or CEO “pay-skimming” noted below or models with labor market rents like Tervio (2009)), then dismantling the sources of these rents will self-evidently lead to increased efficiency.
Since rents are rarely observable, direct evidence on their role in driving income dynamics is scarce. However, we will focus in this paper on a wealth of suggestive evidence consistent with rents being important in income determination, and then will point to direct evidence suggesting that the large increases in top 1 percent income shares has clearly not been associated with improved economic performance overall. We take this as further confirmation that well-designed policies can brake or reverse rising top 1 percent shares without harming overall economic growth – and this suggests strongly that these rising top shares are indeed rents.
Executive Pay
The contribution made by concentration of labor compensation to the growth in the income share of the top 1 percent can largely be explained by a pay-setting institution that had existed for a long time, but took off with particular force in the last couple of decades: exercised stock options and bonuses. Kruse, Blasi and Freeman (2011), for example, note that in 2006 roughly $65.1 billion in labor compensation was actually the result of exercised stock options, while Jaquette, Knittel and Russo (2003) have estimated that total “spread income” (the exercise of non-qualified stock options) was $126 billion in 2000, and was even $78 billion in 2001, following the stock market decline. Stock options and bonuses are particularly relevant to the pay of high-level corporate executives.
Bebchuk and Fried (2004) compile ample evidence in favor of the claim that top executive pay is largely the result of rent-extraction. Perhaps their most persuasive argument is to point out that a well-designed contract for executive pay should offer rewards based on relative performance. For example, an executive for a company in an industry where stock prices are down across the board should be rewarded for performing less poorly than others, while an executive who runs a company in which the stock price is up, but up by less than every other firm in the industry, should not be rewarded. However, real-world compensation arrangements for chief executive officers are typically “camouflaged” to look like they are the result of contractual arrangements that reward relative performance, but generally do not.
One example of this camouflage is the hiring of compensation consultants and the construction of “peer groups” to benchmark top executive salaries. While at first glance benchmarking to insure that shareholders are not overpaying for managers may seem like sound corporate practice, these consultants and peer-group constructions can often be used to justify inflated corporate pay. Bizjack, Lemmon and Nguyen (2011), for example, find evidence that “peer groups are constructed in a manner that biases compensation upward.”
Another example of such camouflage is construction of stock options – an instrument that could be consistent with aligning manager and shareholder interests – that largely reward the luck of whether the stock market rises or falls, rather than specific performance. Bertrand and Mullainathan (2001), for example, have found that the pay for luck is actually as large as pay for performance, and they interpret this finding as evidence in support of the rent-extraction hypothesis for pay of chief executive officers.
As yet another example, Bebchuk and Fried (2010) note that, “standard pay arrangements have commonly failed to restrict the use of financial instruments that can weaken or eliminate entirely the incentive effects of equity-based instruments awarded as part of compensation arrangements.” They note that in a study by Schwab and Thomas (2006) of 375 employment contracts governing pay of chief executive officers, not a single one restricted hedging away the risk of the option grants.
A last bit of evidence that flawed corporate governance has allowed U.S. corporate executives to receive inefficiently high pay is the high ratio of the pay of U.S. chief executive officers relative to their international peers. Fernandes et al. (2012) show U.S. compensation for chief executive officers in 2006 to be twice that of other advanced nations at both the median and mean. A survey by Towers Perrin, a consulting firm, shows U.S. CEO compensation was triple that of other advanced nations in 2003, up from 2.1 times foreign CEO compensation in 1988 (Mishel et al. 2004, Table 2.47). Tower Perrin also reports that U.S. CEO compensation was 44 times that of the average worker whereas the non-U.S. ratio was 19.9.
Fernandes et al. (2012) seek to challenge the claim that U.S. CEOs are paid significantly more than their foreign counterparts. As noted above, they find U.S. CEOs to be paid double that of their counterparts. However, even after controlling for firm-level characteristics—size, leverage, stock return, stock volatility and Tobin’s Q—they find a U.S. pay premium of 88 percent. It is only when they control for “inside and institutional ownership” that they knock the pay premium down to a still substantial 31 percent. It is not clear to us that U.S. institutional board arrangements are reflective of the skill of chief executive officers and should be included as a control when estimating the pay premium. Once could, in fact argue simply that U.S.-style governance features are associated with excessive pay for chief executive officers both here and abroad.
To read more: http://www.epi.org/publication/pay-corporate-executives-financial-professionals/
Spread the word