

Since the 1990s, large numbers of Americans have left Christianity to join the growing ranks of U.S. adults who describe their religious identity as atheist, agnostic or “nothing in particular.” This accelerating trend is reshaping the U.S. religious landscape, leading many people to wonder what the future of religion in America might look like.
What if Christians keep leaving religion at the same rate observed in recent years? What if the pace of religious switching continues to accelerate? What if switching were to stop, but other demographic trends – such as migration, births and deaths – were to continue at current rates? To help answer such questions, Pew Research Center has modeled several hypothetical scenarios describing how the U.S. religious landscape might change over the next half century.
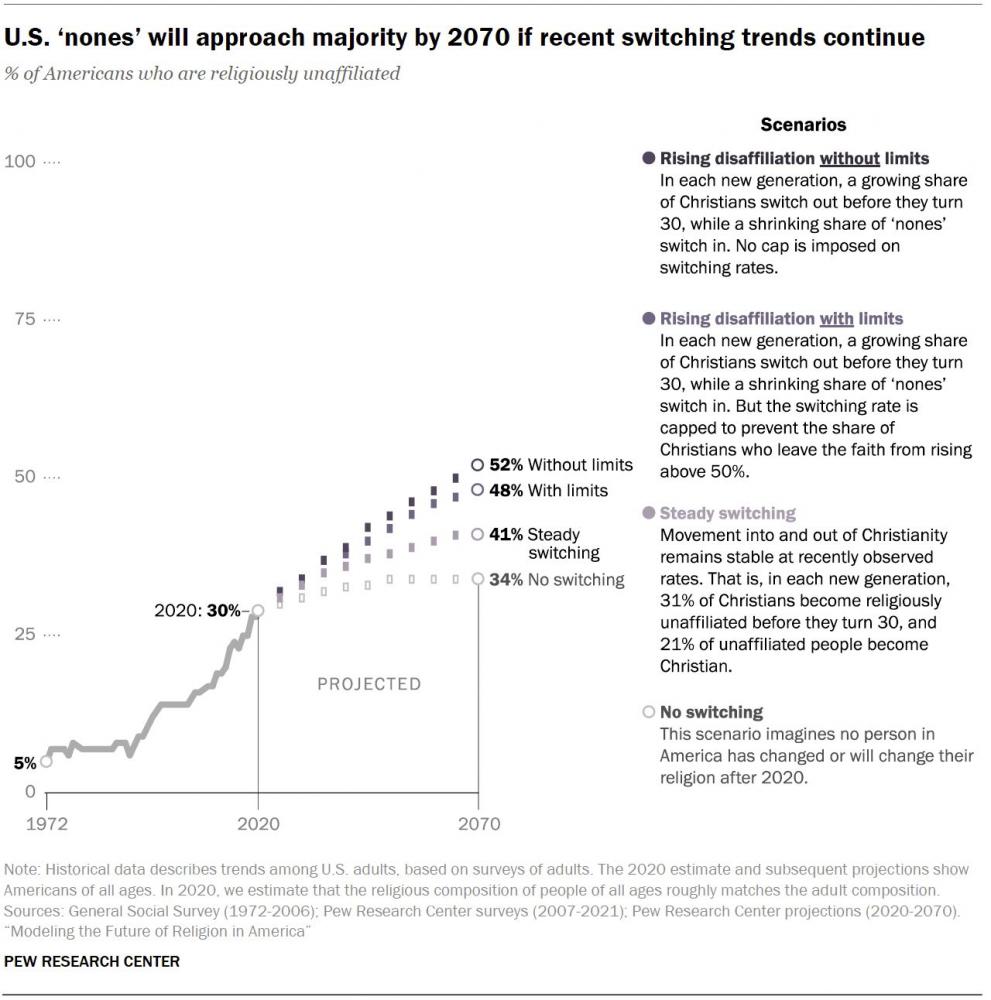
The Center estimates that in 2020, about 64% of Americans, including children, were Christian. People who are religiously unaffiliated, sometimes called religious “nones,” accounted for 30% of the U.S. population. Adherents of all other religions – including Jews, Muslims, Hindus and Buddhists – totaled about 6%.1
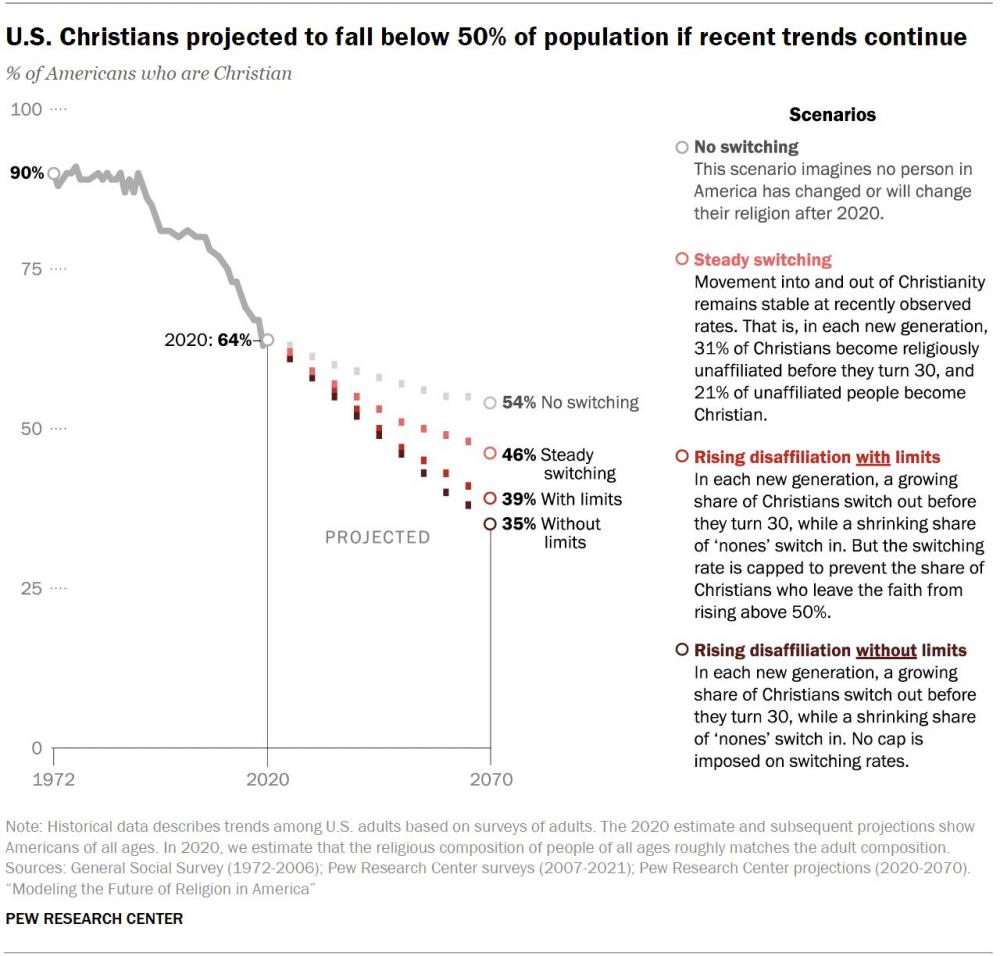
Depending on whether religious switching continues at recent rates, speeds up or stops entirely, the projections show Christians of all ages shrinking from 64% to between a little more than half (54%) and just above one-third (35%) of all Americans by 2070. Over that same period, “nones” would rise from the current 30% to somewhere between 34% and 52% of the U.S. population.
What is religious switching?
Switching, which in some cases could be described as religious conversion, is defined in this report as a change between the religion in which a person was raised (in childhood) and their present religious identity (in adulthood).
Current rates of switching are based on responses from more than 15,000 adults to two questions posed in a 2019 Pew Research Center survey: “In what religion, if any, were you raised?” and “What is your present religion, if any?”
In many cases, switching does not happen in a single moment. Religious “nones” often describe their disaffiliation as a gradual process, and some may never have felt a strong connection to a religious identity, even though they describe themselves as having been raised in a faith tradition.
However, these are not the only possibilities, and they are not meant as predictions of what will happen. Rather, this study presents formal demographic projections of what could happen under a few illustrative scenarios based on trends revealed by decades of survey data from Pew Research Center and the long-running General Social Survey.
All the projections start from the current religious composition of the U.S. population, taking account of religious differences by age and sex. Then, they factor in birth rates and migration patterns. Most importantly, they incorporate varying rates of religious switching – movement into and out of broad categories of religious identity – to model what the U.S. religious landscape would look like if switching stayed at its recent pace, continued to speed up (as it has been doing since the 1990s), or suddenly halted.
Switching rates are based on patterns observed in recent decades, through 2019. For example, we estimate that 31% of people raised Christian become unaffiliated between ages 15 to 29, the tumultuous period in which religious switching is concentrated.2 An additional 7% of people raised Christian become unaffiliated later in life, after the age of 30.
While the scenarios in this report vary in the extent of religious disaffiliation they project, they all show Christians continuing to shrink as a share of the U.S. population, even under the counterfactual assumption that all switching came to a complete stop in 2020. At the same time, the unaffiliated are projected to grow under all four scenarios.
Under each of the four scenarios, people of non-Christian religions would grow to represent 12%-13% of the population – double their present share. This consistency does not imply more certainty or precision compared with projections for Christians and “nones.” Rather, the growth of other religions is likely to hinge on the future of migration (rather than religious switching), and migration patterns are held constant across all four scenarios. (See Chapter 2 for an alternative scenario involving migration.)
Of course, it is possible that events outside the study’s model – such as war, economic depression, climate crisis, changing immigration patterns or religious innovations – could reverse current religious switching trends, leading to a revival of Christianity in the United States. But there are no current switching patterns in the U.S. that can be factored into the mathematical models to project such a result.
None of these hypothetical scenarios is certain to unfold exactly as modeled, but collectively they demonstrate how much impact switching could have on the overall population’s religious composition within a few decades. The four main scenarios, combined with four alternatives outlined in Chapter 2, show that rates of religious switching in adulthood appear to have a far greater impact on the overall religious composition of the United States than other factors that can drive changes in affiliation over time, such as fertility rates and intergenerational transmission (i.e., how many parents pass their religion to their children).
The decline of Christianity and the rise of the “nones” may have complex causes and far-reaching consequences for politics, family life and civil society. However, theories about the root causes of religious change and speculation about its societal impact are not the focus of this report. The main contribution of this study is to analyze recent trends and show how the U.S. religious landscape would shift if they continued.
Why non-Christian religions are not projected individually
This report focuses on Christians and the religiously unaffiliated, the two most common, very broad religious identities in the United States today. People with all other religious affiliations are combined into an umbrella category that includes Jews, Muslims, Hindus, Buddhists and a diverse array of smaller groups that together make up about 6% of the U.S. population. In 2015, Pew Research Center projected the growth of several of these groups separately, both in the U.S. and around the world, and the Center may do so again in the future. But, because data on religious switching and intergenerational transmission is less reliable for groups with small sample sizes in surveys, non-Christian groups are not shown separately in this report.
The report also does not project change for subgroups of Christians, such as Protestants and Catholics, or for subgroups of “nones,” such as atheists, agnostics and people who describe their religion as “nothing in particular.” For the latest figures on the religious composition of the U.S., including some subgroups, see our 2021 report, “About Three-in-Ten U.S. Adults Are Now Religiously Unaffiliated.”
Scenario assumptions and projection results
The four main scenarios presented here vary primarily in their assumptions about the future of religious switching among Americans between the ages of 15 and 29 – which are the years when most religious change happens. Only a modest amount of switching is modeled among older adults.
Fertility and mortality rates are held steady, as are rates of intergenerational transmission. In each scenario, the groups begin with their current profiles in terms of age and gender. Christians, for example, are older than the religiously unaffiliated, on average, and include a higher share of women.
Finally, the models assume that migration remains constant, which helps explain why non-Christian groups follow the same trajectory in each of the four scenarios. Immigration has an outsized effect on the composition of non-Christian groups in the U.S. because adherents of religions like Islam and Hinduism make up a larger share of new arrivals than they do of the existing U.S. population.
Chapter 2 presents four additional scenarios that explore the impact of the factors held constant here. These additional projections show how the U.S. religious landscape might change if current switching patterns held steady, but intergenerational religious transmission occurred in 100% of cases; there were no fertility differences by religion; there was no switching after age 30; or there was no migration after 2020.
The alternative scenarios are intended to help isolate – and thereby illuminate – the impact of various factors. One might think of the projections as an experiment in which some key drivers of religious composition change are turned on or off, sped up or slowed down, to see how much difference they make. For more information about modeling assumptions and results, see Chapter 2 and the Methodology.
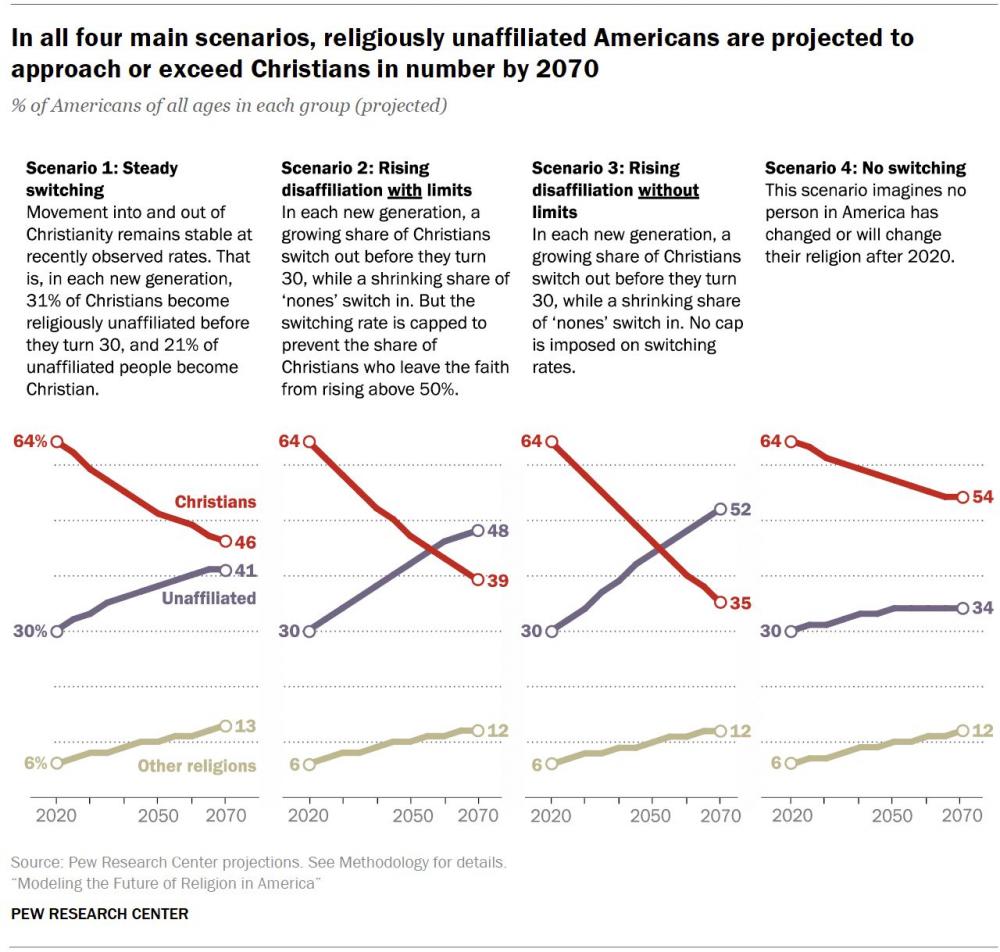
Scenario 1: Steady switching – Christians would lose their majority but would still be the largest U.S. religious group in 2070
Switching assumption: Switching into and out of Christianity, other religions and the religiously unaffiliated category (“nones”) continues among young Americans (ages 15 to 29) at the same rates as in recent years. Most significantly, each new generation sees 31% of people who were raised Christian become religiously unaffiliated by the time they reach 30, while 21% of those who grew up with no religion become Christian.
Outcome: If switching among young Americans continued at recent rates, Christians would decline as a share of the population by a few percentage points per decade, dipping below 50% by 2060. In 2070, 46% of Americans would identify as Christian, making Christianity a plurality – the most common religious identity – but no longer a majority. In this scenario, the share of “nones” would not climb above 41% by 2070.
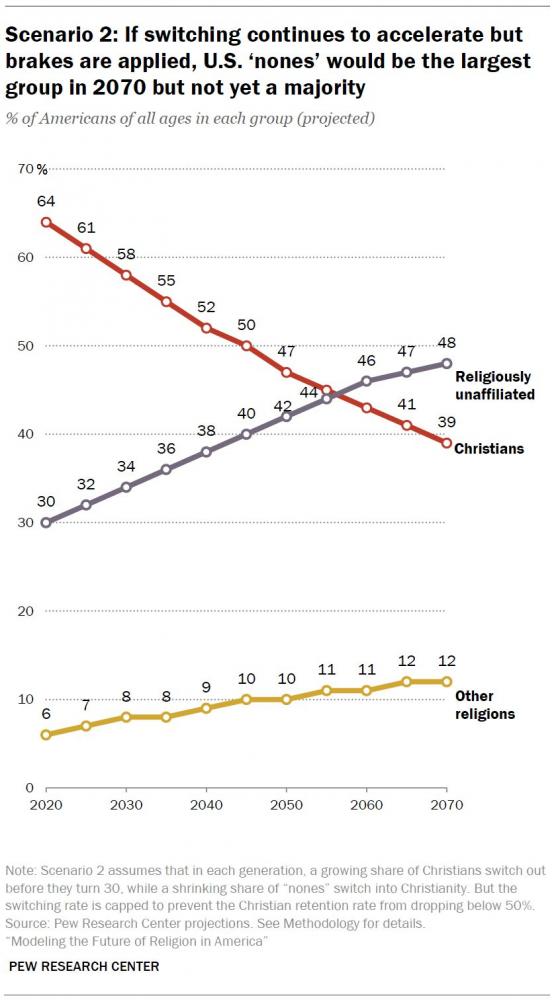
Scenario 2: Rising disaffiliation with limits – ‘nones’ would be the largest group in 2070 but not a majority
Switching assumption: Continuing a recent pattern, switching out of Christianity becomes more common among young Americans as each generation sees a progressively larger share of Christians leave religion by the age of 30. However, brakes are applied to keep Christian retention (the share of people raised as Christians who remain Christian) from falling below about 50%.3 At the same time, switching into Christianity becomes less and less common, also continuing recent trends.
Outcome: If the pace of switching before the age of 30 were to speed up initially but then hold steady, Christians would lose their majority status by 2050, when they would be 47% of the U.S. population (versus 42% for the unaffiliated). In 2070, “nones” would constitute a plurality of 48%, and Christians would account for 39% of Americans.
Scenario 3: Rising disaffiliation without limits – ‘nones’ would form a slim majority in 2070
Switching assumption: The share of Christians who disaffiliate by the time they reach 30 continues to rise with each successive generation, and rates of disaffiliation are allowed to continue rising even after Christian retention drops below 50% (i.e., no limit is imposed). As in Scenario 2, switching into Christianity among young Americans becomes less and less common.
Outcome: If the pace of switching before the age of 30 were to speed up throughout the projection period without any brakes, Christians would no longer be a majority by 2045. By 2055, the unaffiliated would make up the largest group (46%), ahead of Christians (43%). In 2070, 52% of Americans would be unaffiliated, while a little more than a third (35%) would be Christian.
Scenario 4: No switching – Christians would retain their majority through 2070
Switching assumption: This scenario imagines no person in America has changed or will change their religion after 2020. But even in that hypothetical situation, the religious makeup of the U.S. population would continue to shift gradually, primarily as a result of Christians being older than other groups, on average, and the unaffiliated being younger, with a larger share of their population of childbearing age.
Outcome: If switching had stopped altogether in 2020, the share of Christians would still decline by 10 percentage points over 50 years, reaching 54% in 2070. The unaffiliated would remain a substantial minority, at 34%.
Which scenario is most plausible?
The scenarios in this report present a wide range of assumptions and outcomes. Readers may wonder which scenario is most plausible. While there are endless possibilities that would lead to religious composition change that is different from the plotted trajectories, it may be helpful to consider how closely the hypothetical switching scenarios adhere to real, observed trends.
The “no switching” scenario (No. 4) is not realistic – switching has not ended and there is no reason to think it will come to an abrupt stop. The purpose of this scenario is to show the influence of demographic factors (such as age and fertility) on religious affiliation rates. Still, if fewer future young adults switch from Christianity to no affiliation, or if movement in the opposite direction increases, the future religious landscape might resemble the results of this projection.
The “steady switching” scenario (No. 1) is conservative. It depicts moderate, steady “net” switching (taking into consideration some partially offsetting movement in both directions) away from Christianity among young adults for the foreseeable future, rather than the extension of a decades-long trend of increasing disaffiliation across younger cohorts. Even long-standing trends can be unsustainable or otherwise temporary, and this scenario best represents what would happen if the recent period of rising attrition from Christianity is winding down or already has ended.
By contrast, the scenario of rising disaffiliation without limits (No. 3) assumes there is a kind of ever-increasing momentum behind religious switching. The visible rise of the unaffiliated might induce more and more young people to leave Christianity and further increase the “stickiness” of an unaffiliated upbringing, so that fewer and fewer people raised without a religion would take on a religious identity at a later point in their lives.
How we measured intergenerational transmission
Intergenerational transmission is the passing of religious identity from parents to children. It occurs (or fails to occur) in childhood. In this study, transmission rates are calculated based on the share of children who inherit their mother’s religion (or their mother’s unaffiliated identity) because mothers tend to successfully transmit their religious identities more often than fathers do. Also, roughly a quarter of children under 18 live in single-parent households, which are overwhelmingly headed by mothers.
The Center’s data shows the vast majority of teens (about 85%) have the same religious identity as their mother, while 16% report a different identity. Religious transmission, as measured in this study, can fail to occur for many reasons and in either direction. For example, if a mother doesn’t identify with any religion but her 14-year-old child identifies as Christian, it’s counted as a non-transmission of religious identity – just as it would for a Christian mother with a religiously unaffiliated teen.
Intergenerational transmission differs from switching because it describes what happens before the age of 15 and is measured by comparing the religious affiliation of mothers with the affiliations reported by their teenage children. Switching, by contrast, describes a change that happens after the age of 15; it is measured by comparing the religions in which respondents say they were raised with the affiliations they report today.
On the other hand, highly religious parents tend to raise highly religious children who are less likely than children of less religious parents to disaffiliate in young adulthood. As a result, there may continue to be a self-perpetuating core of committed Christians who retain their religion and raise new generations of Christians. It may be useful to consider the experience of other countries in which data on religious switching is available. In 79 other countries analyzed (with a variety of religious compositions), most of the 30- to 49-year-olds who report that they were raised as Christians still identify as Christian today; in other words, the Christian retention rate in those countries has not been known to fall below about 50%.4 The “rising disaffiliation with limits” scenario (No. 2) best illustrates what would happen if recent generational trends in the U.S. continue, but only until they reach the boundary of what has been observed around the world, including in Western Europe. Overall, this scenario seems to most closely fit the patterns observed in recent years.
None of the scenarios in this report demonstrate what would happen if switching into Christianity increased. This is not because a religious revival in the U.S. is impossible. New patterns of religious change could emerge at any time. Armed conflicts, social movements, rising authoritarianism, natural disasters or worsening economic conditions are just a few of the circumstances that sometimes trigger sudden social – and religious – upheavals. However, our projections are not designed to model the consequences of dramatic events, which might affect various facets of life as we know it, including religious identity and practice. Instead, these projections describe the potential consequences of dynamics currently shaping the religious landscape.
Is switching only for the young?
Most people don’t change their religious identity. But among those who do, the switch typically happens between the ages of 15 and 29. That is why this report focuses on switching among young Americans.
However, since the rise of the “nones” began in the 1990s, a pattern has emerged in which a measurable share of adults ages 30 to 65 also disaffiliate from Christianity. The Center’s analysis of U.S. and international data indicates that modest levels of disaffiliation among older adults could be a stage that Christian-majority countries go through when Christian identity stops being widely taken for granted – until about 30% of those raised Christian already have shed Christian identity by the time they reach 30.
Today, among Americans who recently turned 30 and grew up Christian, disaffiliation rates are already above 30%, so the projection models assume that, on average, they will not switch religions again. However, among groups of older adults born after World War II, we model ongoing switching in which 7% of Americans who were raised Christian will switch out between the ages of 30 and 65. This rate of switching among older adults is held constant in each projection model except the no-switching scenario, which does not include any switching among older or younger adults. Switching by religiously unaffiliated, older Americans into Christianity is not modeled in the projections because there is no clear trend in this direction.
For more details on later adult switching, see the Methodology and Appendix B.
Religious change in context
These projections indicate the U.S. might be following the path taken over the last 50 years by many countries in Western Europe that had overwhelming Christian majorities in the middle of the 20th century and no longer do. In Great Britain, for example, “nones” surpassed Christians to become the largest group in 2009, according to the British Social Attitudes Survey.5 In the Netherlands, disaffiliation accelerated in the 1970s, and 47% of adults now say they are Christian.
While the change in affiliation rates in the United States is largely due to people voluntarily leaving religion behind, switching is not the only driver of religious composition change worldwide. For example, differences in fertility rates explain most of the recent religious change in India, while migration has altered the religious composition of many European countries in the last century. Forced conversions, mass expulsions, wars and genocides also have caused changes in religious composition throughout history.
Moreover, the scenarios in this report are limited to religious identity and do not project how religious beliefs and practices might change in the coming decades.
Along with the decline in the percentage of U.S. adults who identify as Christian in recent years, Pew Research Center surveys have found declining shares of the population who say they pray daily or consider religion very important in their lives. Still, it is an open question whether the Christian population in the future will be more or less highly committed than U.S. Christians are today.
On the one hand, within each generation, Christians with lower levels of religious commitment may be most likely to shed their identity and become religiously unaffiliated, while new converts may bring greater zeal. These dynamics could lead to rising levels of commitment in the remaining Christian population. On the other hand, religious commitment could steadily weaken from generation to generation if people continue to identify as Christian but are less devout than their parents and grandparents. This dynamic could lead to steady or declining levels of belief and practice.
Meanwhile, religiously unaffiliated Americans today are not uniformly nonbelieving or nonpracticing. Many religious “nones” partake in traditional religious practices despite their lack of religious identity, including a solid majority who believe in some kind of higher power or spiritual force. It is also unclear how this may change in the future, and whether connections to these beliefs will weaken if disaffiliation becomes even more common in the broader society. At the same time, many observers have wondered what kinds of spiritual practices, if any, may fill the void left by institutional religion. We plan to continue exploring this question in future research.
This report marks the first time Pew Research Center has projected religious composition in the United States under multiple switching scenarios, and the first time that differing rates of religious transmission from parents to children have been taken into account.
These population projections were produced as part of the Pew-Templeton Global Religious Futures project, which analyzes religious change and its impact on societies around the world. Funding for the Global Religious Futures project comes from The Pew Charitable Trusts and the John Templeton Foundation.
1. How U.S. religious composition has changed in recent decades
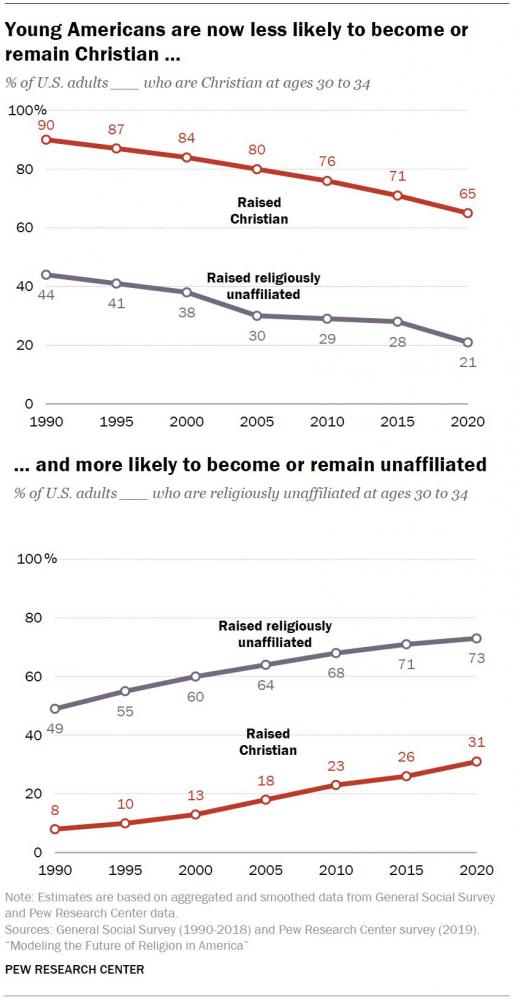
Only a few decades ago, a Christian identity was so common among Americans that it could almost be taken for granted. As recently as the early 1990s, about 90% of U.S. adults identified as Christians. But today, about two-thirds of adults are Christians.6 The change in America’s religious composition is largely the result of large numbers of adults switching out of the religion in which they were raised to become religiously unaffiliated.
In other words, a steadily shrinking share of young adults who were raised Christian (in childhood) have retained their religious identity in adulthood over the past 30 years. At the same time, having no religious affiliation has become “stickier”: A declining percentage of people raised without a religion have converted or taken on a religion later in life.
While religious switching is the focus of this report, other demographic forces that can cause religious change – transmission, migration, fertility and mortality – will be briefly discussed in the second half of this chapter.
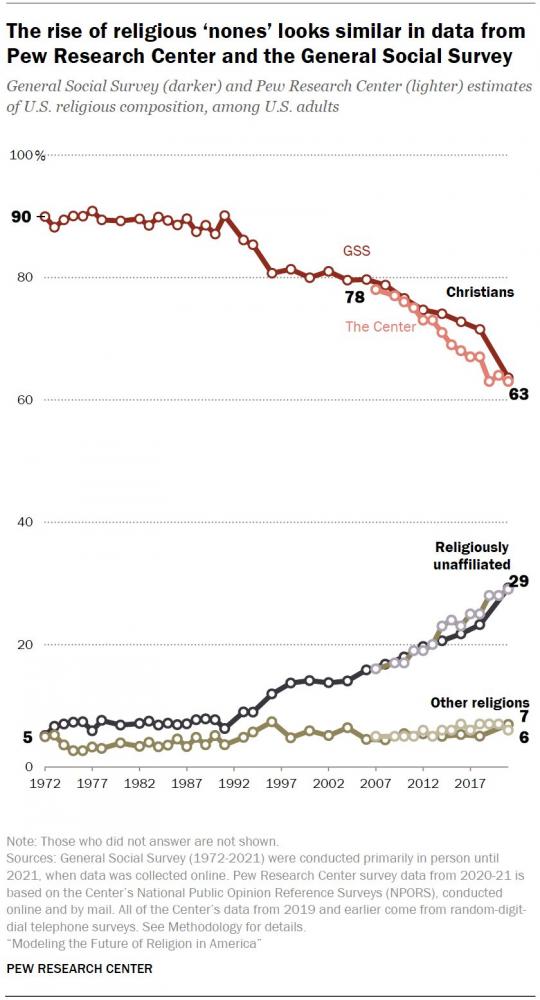
Switching gained significant momentum in the 1990s, according to the General Social Survey (GSS) – a large, nationally representative survey that has consistent data on religious affiliation going back several decades. In 1972, when the GSS first began asking Americans, “What is your religious preference?” 90% identified as Christian and 5% were religiously unaffiliated. In the next two decades, the share of “nones” crept up slowly, reaching 9% in 1993. But then disaffiliation started speeding up – in 1996, the share of unaffiliated Americans jumped to 12%, and two years later it was 14%. This growth has continued, and 29% of Americans now tell the GSS they have “no religion.”7
Pew Research Center has been measuring religious identity since 2007 using a slightly different question wording – “What is your present religion, if any?” – as well as a different set of response options. Since 2007, the percentage of adults who say they are atheist, agnostic or “nothing in particular” in the Center’s surveys has grown from 16% to 29%. During this time, the share of U.S. adults who identify as Christian has fallen from 78% to 63%.
There are many theories on why disaffiliation sped up so much in the 1990s and how long this trend might continue. For example, some scholars contend that secularization is the result of increasing “existential security” – as societal conditions improve and scientific advances allow people to live longer lives with fewer worries about meeting basic needs, they have less need for religion to cope with insecurity (or so the theory goes).8 Others say that in the U.S., an association of Christianity with conservative politics has driven many liberals away from the faith. Still other theories involve declining trust in religious institutions, clergy scandals, rising rates of religious intermarriage, smaller families, and so on. When asked, Americans give a wide range of reasons for leaving religion behind, Pew Research Center has found.
Generational ‘snowball’
Whatever the deeper causes, religious disaffiliation in the U.S. is being fueled by switching patterns that started “snowballing” from generation to generation in the 1990s. The core population of “nones” has an increasingly “sticky” identity as it rolls forward, and it is gaining a lot more people than it is shedding, in a dynamic that has a kind of demographic momentum.
Christians have experienced the opposite pattern. With each generation, progressively fewer adults retain the Christian identity they were raised with, which in turn means fewer parents are raising their children in Christian households.
One way of gauging the momentum behind the U.S. switching trend is to look at the other side of the coin – the rate at which Americans retain the religion in which they were raised, as opposed to switching out. By studying retention patterns, researchers can determine whether a religious identity is becoming more or less sticky.
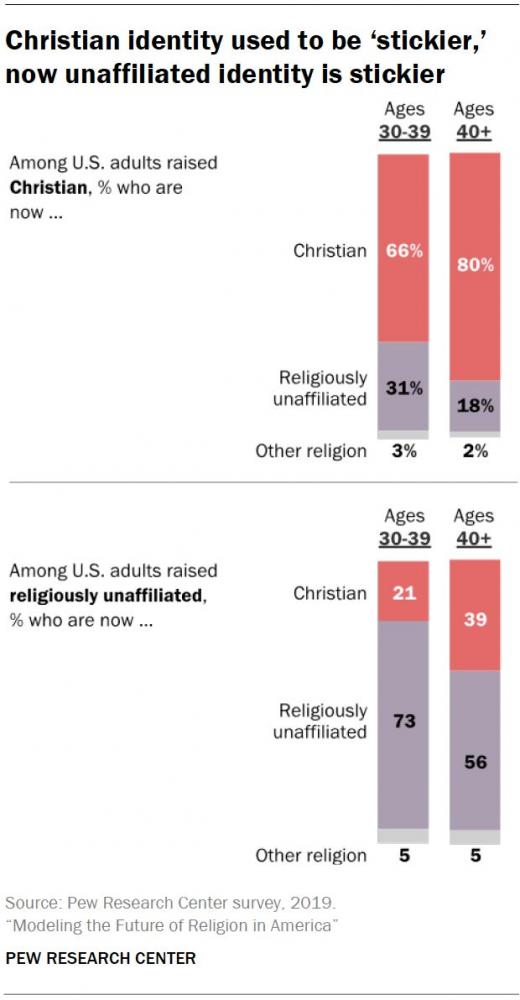
Until recently, Christian identity was stickier than unaffiliated identity, which means that the share of people who remained Christian after being raised as Christians was greater than the share of people who remained unaffiliated after being raised with no religion.
Today, Christianity still is the stickier affiliation for older Americans. But among younger adults, the unaffiliated identity has become the stickier one. Among people who are 40 and older, 80% of those raised as Christians are still Christian today, compared with just 56% of those who were raised unaffiliated (in childhood) and still do not identify with a religion today (in adulthood). However, among people in their 30s, only 66% of those raised Christian are still Christian today, compared with 73% of those raised unaffiliated who still are today.
An analysis of GSS data by birth decade shows a similar pattern: Roughly 90% of people who were born in the 1960s and raised Christian were still Christian when they turned 30. Among those born in the 1970s, fewer than 85% remained Christian at 30. Among those born in the 1980s, it is about 80%. Too few of those born in the 1990s have turned 30 to estimate their switching patterns, but Christians in this youngest cohort appear to be disaffiliating even more than older cohorts.
Disaffiliation among older adults
The “snowballing” dynamic is being driven by an acceleration in switching among young Christians – those ages 15 to 29. People under 30 tend to grapple with identities of all kinds, and young adulthood is often a time of major change, when many people leave their parents’ household, start careers and form lasting romantic partnerships.
But there is a second dynamic that began in the 1990s that added a new layer of change:
Starting in the mid-1990s, it became more common for adults in middle age and beyond to discard Christian identity. Before that, changing religions after 30 was rare.
About 95% or more of people who were born prior to the 1940s and were raised Christian were still Christian from ages 30 to 65. But among those born in the ’40s, ’50s and ’60s, there has been more substantial movement away from Christianity after age 30. For example, 91% of Americans born in the 1960s were still Christian at age 30, but 83% identify as Christian today. Recent switching among older U.S. adults may be the result of a period effect (when something about the environment affects people of all ages for a period of time, such as the COVID-19 pandemic’s consequences for the mental and physical health of people of all ages). It might also be the result of a tipping point: Once Christians began to lose their overwhelming majority, people of all ages who had ties to Christianity – but did not attend church, pray often or see religion as an important part of their lives – may have begun to identify as unaffiliated in larger numbers. As “nones” grew in size and visibility, being unaffiliated may have become more socially acceptable in some circles, opening the floodgates to further disaffiliation.
While this pattern is new – and it is unclear how long it might last – it indicates that disaffiliation is extending into segments of the population that may have been unaffected in the past. (For more information about late-adult switching, see Appendix B.)
Education, politics and geography tied to differences in religious switching
A closer look at the characteristics of adults who have left Christianity and are now religiously unaffiliated indicates that other traits – such as age, gender, education, political identity and region of residence – also are tied to disaffiliation.
Age
U.S. adults who have moved away from Christianity are younger, on average, than those who have remained Christian after a Christian upbringing. More than a quarter of former Christians (27%) are under 30, compared with 14% of all adults who were raised Christian and remain Christian. This age pattern aligns with a decades-long trend in which each cohort of young adults is less religiously affiliated than the preceding one.
Gender
Americans who have moved away from Christianity are more likely to be men, while women are more likely to retain their Christian identity. A slight majority of U.S. adults who were raised Christian and are now unaffiliated (54%) are male. Among people who have remained Christian, 57% are women.
Education
People who have become unaffiliated after a Christian upbringing are a little more likely to have graduated college than those who remain Christian, with 35% and 31%, respectively, holding college degrees. This reflects a broader pattern: In the U.S., people with higher levels of educational attainment tend to be less religious by some traditional measures, such as how often they pray or attend religious services.
Politics
Seven-in-ten adults who were raised Christian but are now unaffiliated are Democrats or Democratic-leaning independents, compared with 43% of those who remained Christian and 51% of U.S. adults overall. Some scholars argue that disaffiliation from Christianity is driven by an association between Christianity and political conservatism that has intensified in recent decades.9
Geography
People who have left Christianity are underrepresented in the South, where 33% of former Christians live, compared with 42% of people who have remained Christian and 38% of U.S. adults overall.10
Those who have disaffiliated after being raised Christian are more likely than others to live in the West (28% live there, compared with 20% of those who remain Christian and 23% of all U.S. adults). Surveys often find that U.S. adults tend to be more religious, on a number of measures, in the South, and less so in the West and Northeast. This may indicate that people adapt to the religious contexts in which they live and/or sort themselves into like-minded communities.
Other drivers of change
Switching is the primary, but by no means the only, process causing religious change in the U.S. Populations can grow or shrink through a few other mechanisms. Patterns of religious transmission, migration and fertility explain some of the shift in the religious landscape in recent decades.
Transmission
The share of Christians is in decline partly because religion is not always transmitted by Christian parents to their children.
For the purposes of the projections in this report, religious identities are considered to be “transmitted” when children are raised in their parents’ religion and identify with it as early adolescents. There are a variety of reasons why children of religiously affiliated parents may be raised without a religion and, therefore, that religion is not transmitted. For example, a child may have parents without strong religious commitment, or parents with different religions, or parents who have decided to let children explore and make decisions about religion on their own.
Consider the hypothetical case of an adult survey respondent who says her mother was Christian, her father was Jewish, she was not raised in any religion, and she currently does not identify with any religion. A person like this has not switched religions, since switching is defined as leaving the religion in which one was raised. However, in this example, neither parent transmitted their religion.
By the same token, not all unaffiliated parents transmit their identity. For example, a 14-year-old child of unaffiliated parents could acquire a Christian identity outside the parental home in various ways, such as from other family members, a teacher or a friend.
In this study, transmission rates are calculated based on the mother’s religion because mothers tend to successfully transmit their religion more often than fathers do, and roughly a quarter of teens live in single-parent households, which are almost exclusively headed by mothers.
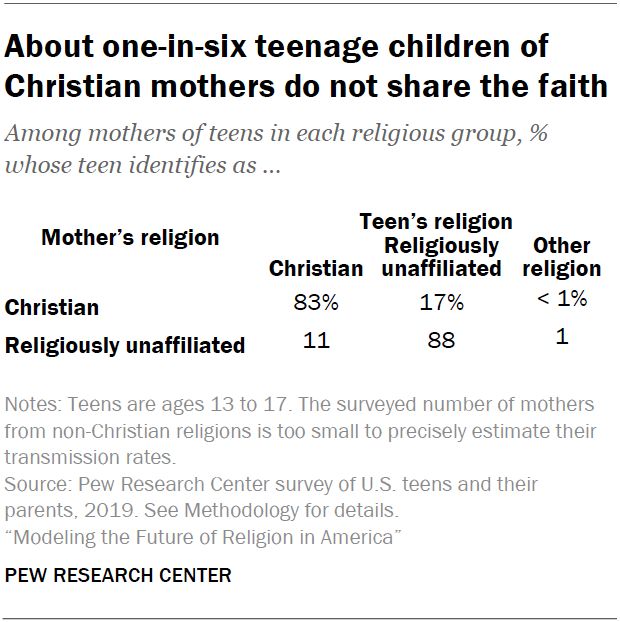
Today, transmission of the mother’s religious identity happens in the vast majority of families. In a 2019 Pew Research Center survey of teens and their parents, an overwhelming majority of both Christian and unaffiliated mothers had transmitted their religious identities to their teenagers. More than eight-in-ten Christian mothers had Christian teens, while 17% of their teens identified as atheist, agnostic or “nothing in particular,” and less than 1% said they were members of another religious group.
The teens of unaffiliated mothers show a similar pattern: 88% are unaffiliated themselves, 11% are Christians, and 1% identify with a non-Christian religion. The survey sample did not contain enough mothers who belong to non-Christian religions to report on their precise transmission rates, but their patterns seem broadly similar to those with Christian and unaffiliated mothers – the vast majority of teens raised by mothers of “other religions” also identify with a religion in this category.
Even though the shares of Christian and religiously unaffiliated mothers who transmit their affiliation (or lack thereof) are fairly similar, the impact of failed transmission in Christian families is far greater, numerically, because there are more than twice as many Christian mothers as unaffiliated ones. At these rates, and as long as Christians are the substantially larger group, many more people will adopt a religiously unaffiliated identity rather than a Christian one during childhood, which in turn increases the population share of the unaffiliated.
Migration
Migration contributes to U.S. religious change because the composition of immigrants and emigrants is not identical to that of the overall U.S. population.
About a million immigrants come to the U.S. each year, and one-in-seven people in the U.S. were born elsewhere. In the 1990s and early 2000s, the largest number of recent arrivals to the U.S. were from Mexico and other Christian-majority countries in Central and South America.
Today, new arrivals are more likely to come from Asia. In 2018, the top country of origin for new immigrants was China (which is majority unaffiliated), followed by India (which is majority Hindu). Most of the world’s people who identify as religiously unaffiliated, Hindu, Buddhist, Sikh and Jain live in either China or India, and this is reflected in the changing profile of immigrants.
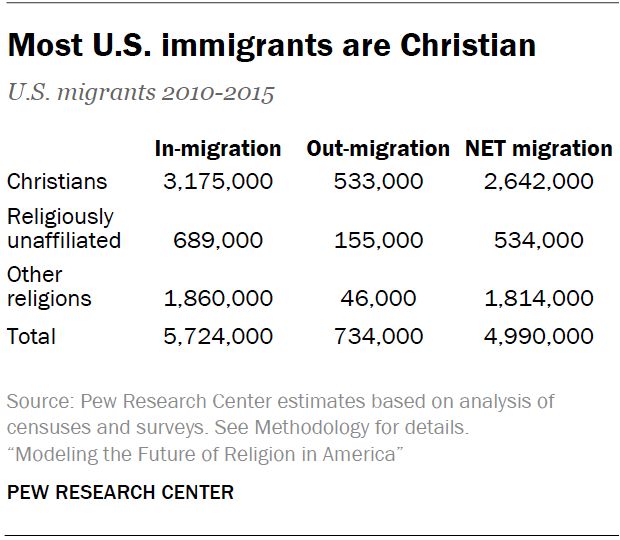
Christians still make up a majority of immigrants to the U.S., including a majority of immigrants from Mexico, the third-largest source of new immigrants in recent years. But the estimated share of new immigrants who are Christian (55%) is lower than the Christian share of the existing U.S population (64%), meaning that immigration is not boosting the Christian population share. The same is true of religiously unaffiliated people: 12% of new immigrants are estimated to be religiously unaffiliated, compared with 30% of the existing U.S. population.
But immigration is leading to growth in the share of other religions like Hindus and Muslims – 32% of new immigrants are estimated to be adherents of other religions (versus 6% of the U.S. population), according to recent data on the origin and size of migrant flows to the U.S. and an earlier Pew Research Center analysis of the typical religious composition of migrants from each country.11
Fertility
In countries with wide differences in fertility rates between religious groups, those differences can cause significant changes in religious composition over time.
Recently, religiously unaffiliated women in the U.S. have tended to have fewer children than Christians and women of other religions. In this report’s models, the average unaffiliated woman is expected to have 1.6 children in her lifetime, while the average Christian woman will have 1.9 children, and the average woman of other religions (an umbrella category that includes Jews, Muslims, Hindus, Buddhists and many smaller groups) will have 2.0 children (see Methodology for more details).
Since the U.S. has a very large population and mothers tend to transmit their religions to children, these small differences can add up to noticeable changes over time. However, higher fertility among Christians compared with the religiously unaffiliated has not been nearly enough to maintain the Christian share of the population, although it has slightly offset some of the impact of disaffiliation.
Age structures and mortality
The youthfulness of religious groups has an impact on the future that is intertwined with fertility because young populations have higher shares of people who are in, or soon will enter, their reproductive years. In other words, they have more growth potential than older populations. If two groups have identical total fertility rates, the group with the younger age structure can grow more rapidly because of the population momentum produced by having a larger share of women of reproductive age. Young populations also tend to have a smaller share of people who die each year.
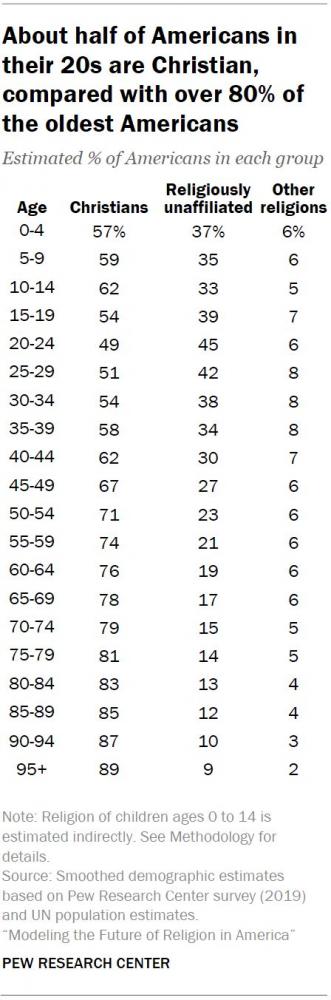
Christians are older, on average, than the unaffiliated or people of non-Christian religions. The average U.S. Christian is 43, compared with an average age of 33 among the unaffiliated and 38 among people of other religions. More than 80% of Americans older than 75 are Christian, compared with roughly half of people in their prime childbearing years (ages 20 to 34), many of whom will transmit their religion to the next generation, if past patterns hold. More than 40% of Americans between 20 and 34 are religiously unaffiliated, compared with under 15% of the oldest Americans. These are among the reasons why religious “nones” are projected to grow as a share of the U.S. population even in the scenario with no further religious switching.
Due to a lack of sufficient data on mortality differences between people in the three religious identity categories studied in this report, each group is assumed to have the same mortality patterns. In other words, for purposes of these projections, life expectancy is assumed to be similar among members of each group at a given age. It is also assumed to be rising over time, despite a dip caused by the coronavirus pandemic.12
2. Projecting U.S. religious groups’ population shares by 2070
The first half of this chapter provides details on the assumptions and results of each of the four main scenarios. These are not predictions for the future. Rather, projections show what would happen under a number of hypothetical scenarios.
Some scenarios are intentionally implausible and meant only to illustrate the impact of different demographic forces. Scenario 1 is conservative, because it assumes that disaffiliation will not speed up beyond the current rate, even though in recent decades each generation of people raised Christian has disaffiliated more than the generation before it. Scenarios 2 and 3 may be more realistic because they assume that switching will continue to accelerate. Scenario 4 is implausible because it imagines that all switching ended in 2020; it is nevertheless revealing because it demonstrates how demographic dynamics (such as the higher average age of Christians) would cause the Christian share of the population to continue to decline even without any further switching.
Though some scenarios are more plausible than others, the future is uncertain, and it is possible for the religious composition of the United States in 2070 to fall outside the ranges projected.
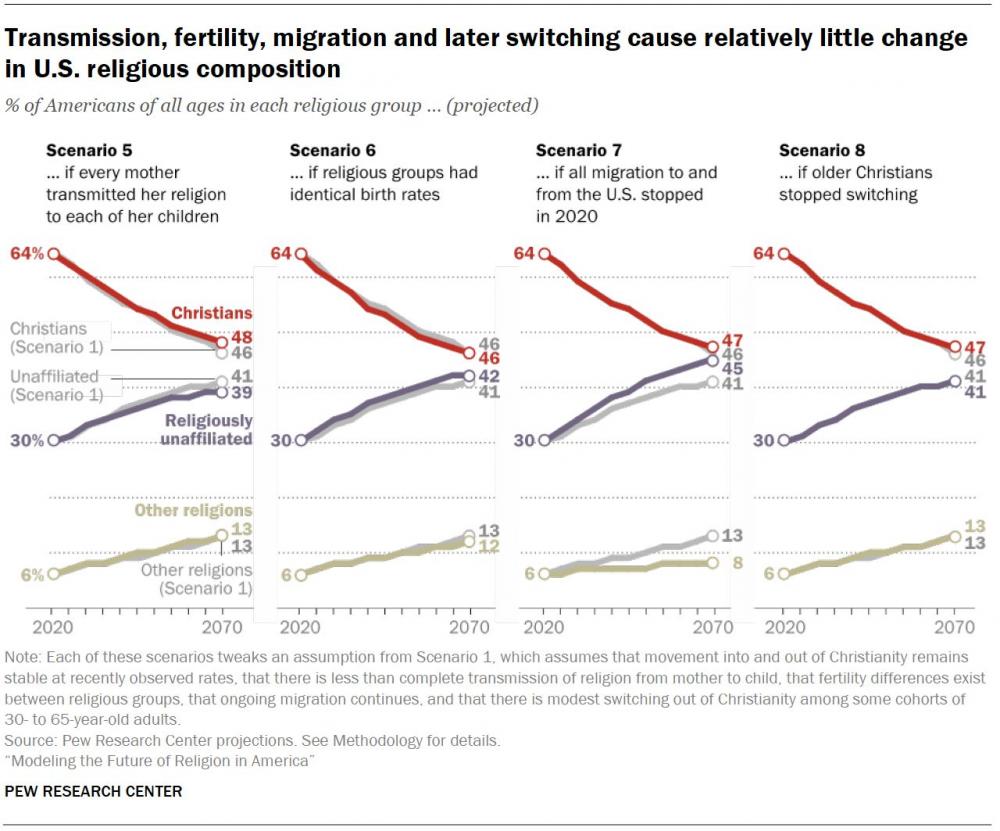
The second half of this chapter presents four additional projections (Scenarios 5-8), to demonstrate the effects of factors other than switching. These projections show how the U.S. religious landscape might change if current switching patterns among young adults held steady, but with religious transmission set to 100%, no fertility differences by religion, no switching after age 30, or no migration.
None of the scenarios project growth in the Christian share of the U.S. population because we do not have empirical measures of any recent switching patterns that favor Christianity in the United States. In other words, there is no data on which to model a sudden or gradual revival of Christianity (or of religion in general) in the U.S. That does not mean a religious revival is impossible. It means there is no demographic basis on which to project one.13
Baseline assumptions
All the scenarios in this report start with a 2020 data baseline. Estimates of U.S. migration, fertility, age and sex structure, and mortality patterns are based on the United Nations’ demographic estimates. Religious differentials in fertility are from the National Survey of Family Growth. Baseline religious composition data comes from Pew Research Center surveys. (For a full list of sources and explanations on how baseline data was prepared for analysis, see Methodology.)
Pew Research Center estimates that in 2020, Christians made up 64% of the U.S. population (including children) while “nones” accounted for 30% and other religious groups 6%. Based on observed data, the baseline scenario assumes that 34% of people who grew up Christian will discard their religion by the time they turn 30 (including 3% who switch to a non-Christian religion and 31% who identify with no religion) and among some older cohorts of Christians, 7% will leave at a later age.14 Meanwhile, 21% of people who were raised religiously unaffiliated will become Christian by the time they reach 30.
Each scenario assigns different future switching rates to young people (ages 15 to 29) but holds switching rates steady for the small share of older adults who switch after turning 30. (This later-adulthood switching applies only to cohorts born before 1990; disaffiliation has become so common in subsequent decades that the models assume that people born after 1990 who will switch already have done so by age 30.15)
All four main scenarios assume that transmission of religion from mothers to children continues at recent rates, migration remains constant, religious differences in fertility stay stable, and there are no mortality differences among religious groups. Switching among people raised in non-Christian religions is assumed to hold steady under all but the “no switching” scenario, because there is not enough data on people in the “other religions” category to model shifting retention rates across age cohorts.
The population structure for 2020 differs from earlier projections
Readers familiar with Pew Research Center’s 2015 global projections might note that the 2020 U.S. religious landscape described in this report differs markedly from what was projected seven years ago. In fact, the present religious landscape is similar to the 2015 projection for 2050, with Christians representing about two-thirds of the population and the religiously unaffiliated making up more than a quarter. The 2015 global projections assumed stability in switching patterns in each country and did not anticipate an acceleration in the U.S. switching rate. The pace of disaffiliation in the U.S. increased continuously between 2010 and 2020. The “steady switching” projection scenario in this report is most similar to the assumptions modeled in the earlier projections. Other scenarios in this report attempt to capture what would happen if U.S. religious switching continues to speed up.
In our 2015 global projections report, it would have been impractical to present customized scenarios that might be appropriate for individual countries (or regions), such as the additional U.S. switching scenarios included in this report. For the sake of feasibility and comparability, a steady switching assumption was applied to every country for which switching data was available, even though steady switching was not the likeliest path for all countries. At the time, we recognized that this approach was likely conservative for projecting the growth of “nones” in the United States. In this new report, we delve into the complex switching dynamics in the U.S. with greater specificity.
Updates to projections are appropriate when facts on the ground change. For example, soon after our 2015 global projections report was released, a large wave of asylum seekers came to Europe, resulting in a rapid increase in the region’s Muslim population that had not been anticipated in our models. In 2017, we updated our European projections in a report exploring how Europe’s Muslim population could continue growing under a variety of new migration scenarios.
Scenario 1: Steady switching
The first scenario differs from the others in that it assumes religious switching will continue at recent rates across all age groups. That is, in each new generation, 31% of people who were raised Christian become religiously unaffiliated between the ages of 15 and 29, while 21% of those who grew up with no religion become Christian. Moreover, 7% of people who were raised Christian disaffiliate between the ages of 30 and 65.16
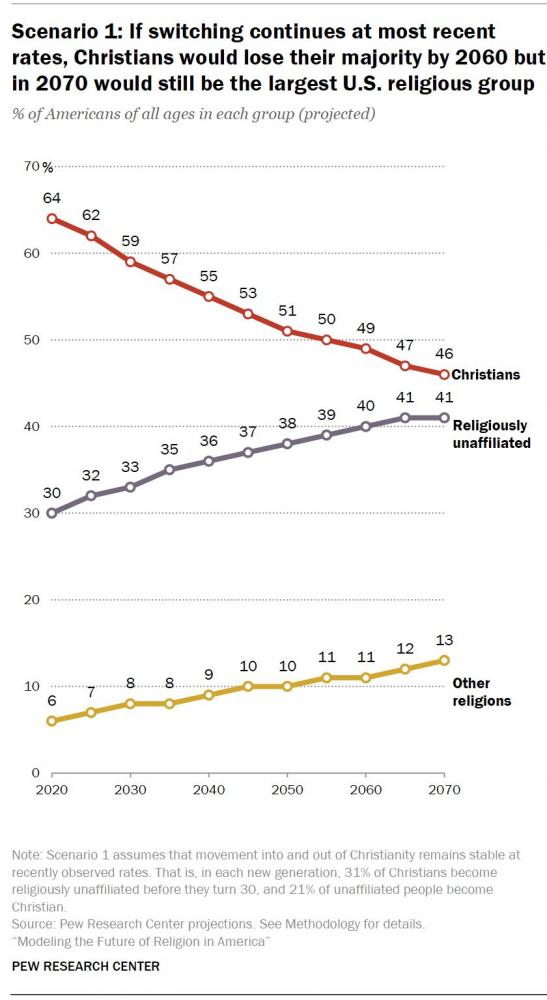
Other demographic forces that can affect religious composition – migration patterns, differences in religious groups’ birth rates, and the rate at which parents transmit religious identity to their children – are held steady. (These factors remain constant in each of the four main scenarios, but not in Scenarios 5-8, which begin later in this chapter.)
In these circumstances, the largest amount of change among Christians and the religiously unaffiliated would occur by 2050. Christians would decline as a share of the population by a few percentage points per decade, dipping below 50% by 2060. In 2070, 46% of Americans would identify as Christian, making Christians a plurality – the most common religious identity – but no longer a majority. In this scenario, the share of “nones” would reach 41%, and other groups would make up the remaining 13%.
(Scenario outcomes for non-Christian religions are closer than they may appear due to rounding. For example, people of other religions are projected to make up 12.53% of the U.S. population in 2070 under Scenario 1 and 12.48% under Scenario 2.)
Scenario 2: Rising disaffiliation with limits
In this scenario, leaving Christianity is assumed to become more common across each successive cohort of young adults, continuing recent trends. However, this scenario also assumes that Christian retention – that is, the share of people who were raised Christian and still identify as Christian after young adulthood – can only go as low as 50% for men and 55% for women.
This artificial “floor” is roughly equal to the lowest retention rate observed in an analysis of 79 other countries. Great Britain has a Christian retention rate of 49%, the lowest in this analysis, followed by France at 52%. The “limits” in this scenario only assume there may be a cap on how rapidly change can take place within a generation for people raised Christian or raised with no religion. No predetermined limit is imposed on the eventual size of populations of Christians, the religiously unaffiliated or of all other religions.
The scenario also assumes that at least 5% of people raised without a religion will convert into one, either to Christianity or another faith. Having no religious affiliation is very quickly becoming “stickier,” but this assumption recognizes that retention among the unaffiliated is unlikely ever to reach 100%.
With these assumptions, the trend in which each cohort of young adults disaffiliates from Christianity at higher rates than the preceding cohort continues and reaches an imposed “floor” retention rate of 53% overall (50% for men and 55% for women) in 2050, among the cohort born between 2016 and 2020.
Under these conditions, people who do not identify with any religion would become the largest group around the year 2060, though they would not represent a majority of Americans. By 2070, “nones” would be a plurality of 48%, Christians would account for 39% of the U.S. population, and 12% of Americans would belong to other religions.
Scenario 3: Rising disaffiliation without limits
Since the 1990s, each cohort of young adults has disaffiliated from Christianity at higher rates than the one before it. At the same time, steadily fewer people have become affiliated with any religion after growing up with no religion. If this trend of change between cohorts continues, growing shares will continue to become unaffiliated during young adulthood, and declining shares will offset this attrition through conversion into a religion.
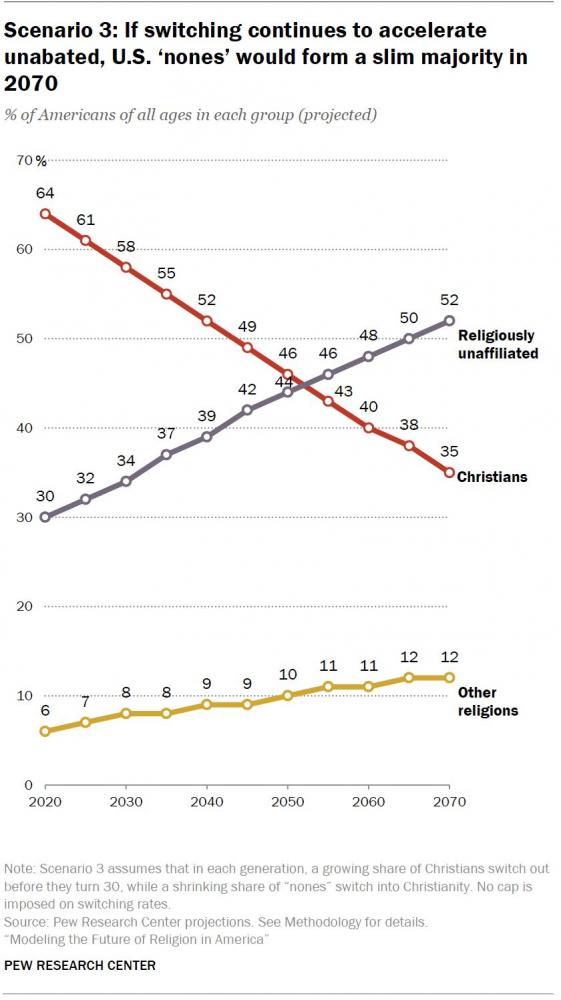
In this scenario, the share of Christians who disaffiliate by the time they reach 30 continues to rise with each successive generation and is allowed to grow without any imposed limit.
If the rate of disaffiliation among young adults continues to increase unabated, there would be a steep, rapid drop in the share of Christians who retain the identity they were raised with. The unaffiliated would surpass Christians as the largest group by 2055, when 43% of Americans would be Christian, compared with 46% who would be religiously unaffiliated. By 2070, a slim majority of Americans (52%) would be unaffiliated, while a little over a third (35%) would be Christian.
By 2070, this scenario projects that the pace of disaffiliation would have sped up so that 65% of Americans who were raised Christian would switch out before the age of 30 (up from 31% in 2020), mostly in the direction of the unaffiliated. Christian retention – the share of people raised Christian who are still Christian – would fall to 35%. Under these conditions, the share of young adults switching from an unaffiliated upbringing to a Christian adulthood would fall to 2% by 2070, compared with the recent rate of 21%.
These assumptions result in the largest shift toward disaffiliation of any projection scenario. This scenario projects an unaffiliated plurality in 30 years and is the only one to result in an unaffiliated majority in 2070.
Scenario 4: No switching
For the sake of demonstrating the impact of switching on religious change, this scenario assumes that all religious switching stopped in 2020. If all other factors of change – including intergenerational transmission, migration and fertility – continued steadily but there was no further movement into and out of any religion, Christians would still make up a 54% majority of Americans in 2070. This is the only scenario modeled under which Christians maintain a majority over the next 50 years.
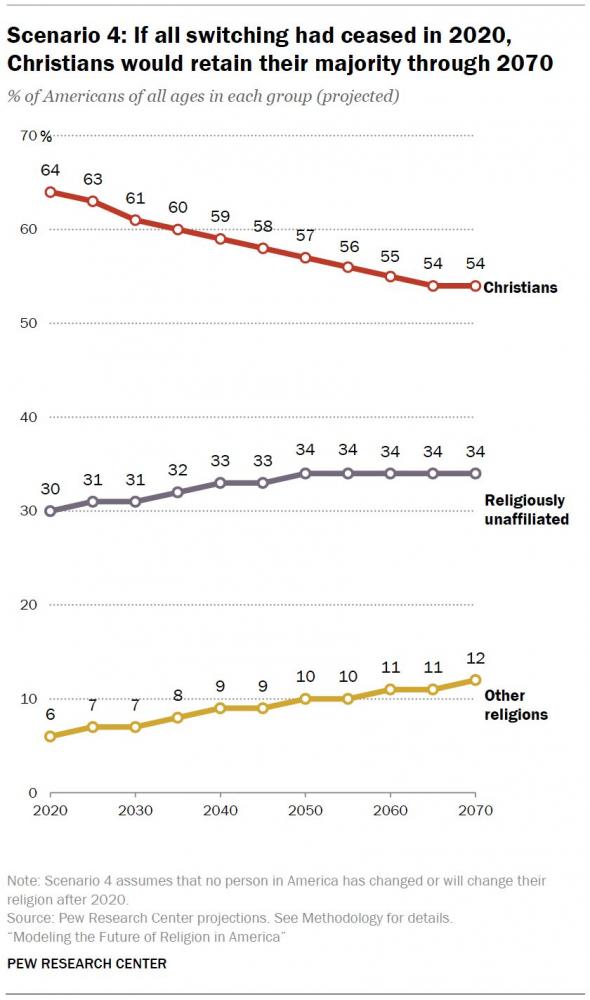
But the share of Christians would still decline, while the religiously unaffiliated would continue to edge up (from 30% to 34%). This is largely because Christians are older than the other groups, on average. About half of Americans in their early 20s are Christian, compared with more than three-quarters of those in their early 60s and even greater shares of older adults. As older people die, and as younger, unaffiliated people become parents to unaffiliated children, the Christian share of the population would naturally fall due to Christian deaths outnumbering Christian births.
Other religions would remain on their trajectory to reach 12% by 2070, mainly because immigration is still projected to continue in this scenario.
Why the flow of people out of Christianity may eventually lose momentum
There are many different ways of measuring the momentum of switching into and out of Christianity. This analysis focuses on switching among people under 30, because that is when most religious switching happens, and also because it helps researchers quantify the trend among young people to project forward.
Another helpful way of measuring switching momentum is by looking at all U.S. adults who have left or joined Christianity, regardless of when they did so. This wider lens amplifies an interesting fact about the way demographic change works: When a majority group starts losing members to a minority group, even small percentages of people leaving the majority group can have a large impact on the total numbers in the minority group. However, as the groups become more similar in size, the net impact of roughly equal percentages of people switching from each group to the other diminishes. Accordingly, the change in the projected sizes of these populations becomes more gradual over time in most projection scenarios, as the groups converge in size.
Let’s take switching rates for all U.S. adults as an example. In 2019, among all U.S. adults, 23% of all people who had been raised Christian had become unaffiliated, while 27% of those who had been raised without a religion had become Christian.
Though these percentages are similar (and may even seem to favor movement into Christianity) they represent vastly different numbers of people and a much larger gain for the unaffiliated. Only 12% of adults – approximately 30 million – were raised unaffiliated, and 83% – or roughly 215 million – were raised Christian. This means that by 2019, about 50 million adults (23% of 215 million) had discarded a Christian identity, and fewer than 8 million (27% of 30 million) had become Christian after an unaffiliated upbringing. Even if 100% of adults who were raised unaffiliated (all 30 million) had become Christians, the unaffiliated category still would have gained more members than it lost.
The same dynamic applies to the transmission of religion from mothers to children. In 2019, 17% of Christian mothers were raising children who – by the time they reached the teenage years – were not affiliated with any religious group. A similar share of unaffiliated mothers (11%) had teens who identified as Christians. The consequences of this 6-point gap are exaggerated because there are so many more Christian mothers than unaffiliated mothers. The difference in the number of children moving into each group would be much smaller if the two groups were of comparable size.
As the unaffiliated grow to represent a share of the population that is similar to the Christian share, relatively modest shifts in transmission and retention rates could reverse the groups’ trajectories. For example, among all U.S. adults, Christianity has attracted a greater share of people raised unaffiliated than vice versa (27% compared with 23%). The pattern is opposite among young adults, for whom being raised unaffiliated is “stickier” than being raised Christian. However, a shift back to the pattern currently observed among all adults (with higher retention rates among Christians than among the unaffiliated) could be enough – depending on other patterns – to begin growing the Christian population from a new starting point at which Christians are smaller in number than, or similar in size to, the unaffiliated. While this bottoming out and regrowth of Christianity is theoretically possible, it would require a reversal of the current trends in switching.
Projecting to 2100
If trends are projected for an even longer period, change slows under most scenarios. Even in the most extreme switching scenario, in which each cohort of young adults disaffiliates more than the one before it, with no floor imposed for Christian retention, Christians would still represent about a quarter of the population in 2100. Under other scenarios, the rate of growth of the religiously unaffiliated (and decline of Christians) is curbed by 2080. This is due to switching dynamics. If the Christian and unaffiliated populations become similar in size – an eventuality under most scenarios – and if the gap between their retention rates remains small, then the growth of the unaffiliated eventually would slow, and the religious groups could reach equilibrium rather than one group ascending completely and the other disappearing.
Additional scenarios: What if migration stops or people stop switching after the age of 30?
This report focuses on four main scenarios that explore how the U.S. religious landscape might change if switching out of Christianity among young adults were to speed up, keep a steady pace or stop entirely. These scenarios seek to explore the effect of religious switching in late adolescence and early adulthood, and they hold steady other demographic forces that can cause a country’s religious composition to change – namely intergenerational “transmission” (the passing of religious identity from parents to children), switching later on in adulthood, migration, fertility and mortality.
But how impactful are these other factors, and how could variations in them affect the future of religion in America? To measure the relative impact of some of the assumptions built into the model, researchers created four more scenarios that turn off one mechanism of change at a time. Otherwise, these four scenarios are identical to Scenario 1, in that they assume a steady rate of religious switching among young adults, without any acceleration. (This does not necessarily mean that Scenario 1 is the most plausible.) Turning off one mechanism of change at a time is the best way to assess whether it has any meaningful sway on the overall outcome.
The results of this statistical exercise produce small deviations from Scenario 1, on which they all are based. In other words, even if we vary our assumptions about migration – or fertility rates, or transmission rates, or the future rate of switching among older adults – the projections would be similar to those from Scenario 1.
Turning off any one of these mechanisms of demographic change results in a projected Christian share ranging from 46% to 48% in 2070. The religiously unaffiliated share would rise to between 39% and 45%, depending on which component stopped. And people of all other religious groups would be projected to make up between 8% and 13% of the U.S. population in 2070.
The scenarios in this report demonstrate that switching is the driving force behind religious change in the U.S. today. Scenario 4 illustrates that age structure is also consequential – Christians are expected to shrink and the unaffiliated to grow in part because Christians are older and the unaffiliated are younger, on average. However, Scenarios 5-8 demonstrate that other demographic factors are expected to have less impact on the overall direction and pace of change.
Transmission is the process of children taking on the same religious identity as their parents. Today, about 85% of teens with a religious identity classified as Christian, unaffiliated or other religion have a mother whose identity is classified in the same group, according to analysis of surveys that measure the religious identities of both teens and parents in the same household. In projections, transmission is based on the share of mothers who successfully transmit their religion. Fathers matter, too, but mothers tend to be more successful at transmission, and about a quarter of U.S. children live with single parents, who are overwhelmingly mothers.
If rates of religious transmission between mothers and children increased to 100% – in other words, if every mother transmitted her religious identity to every child she has – the unaffiliated would grow slightly less, to 39% of the U.S. population by the end of the projection period (compared with 41% under Scenario 1). This indicates that over the long term, it makes little difference whether all teens or just 85% inherit their mother’s faith (or lack thereof).
Scenario 6: What if religious groups had children at identical rates?
Over a 50-year period, the impact of fertility is also small. Scenario 6 is identical to the “steady switching” scenario except that differences in fertility rates across religious groups are turned off. If there were no differences in fertility among Christians, the religiously unaffiliated and people of other religions, Christians would be projected to shrink to 46% of the U.S. population in 2070 (the same as in Scenario 1), while the unaffiliated would grow by 1 percentage point more. The percentage estimate for people of other religions would be 1 point lower without fertility differences, as long as all other conditions mirrored Scenario 1.
Scenario 7: What if all immigration and emigration ceased?
People of non-Christian faiths make up a larger proportion of recent immigrants than they do of the overall population, and their numbers would be most affected in a “no migration” scenario. If no migrants entered or left the U.S. after 2020, people of other (i.e., non-Christian) religions would grow to represent only 8% of the population by 2070, rather than the 12% or 13% projected under scenarios accounting for steady migration. The unaffiliated would make up a slightly larger share of the population (45%) compared with Scenario 1 (41%). The 2070 Christian share of the U.S. population is similar in Scenarios 1 and 7, suggesting that continuation of the current migration patterns would have a relatively small long-term impact on the size of the Christian population, though immigrants are adding substantially to the population that identifies with other religions.
Scenario 8: What if older Christians stopped switching?
Most of the scenarios assume that about 7% of adults in some older cohorts who were raised Christian leave Christianity between the ages of 30 and 65, as they have since the 1990s. As noted above, however, there are reasons to believe that this pattern of religious switching in older adulthood is the result of a period effect and may not continue forever.17 Under a “no switching after 30” scenario, future religious identity change occurs only in young adulthood, steadily at recently observed rates. The end result of Scenario 8 is similar to Scenario 1: 47% of the U.S. population would be Christian in 2070 (versus 46% in Scenario 1), while the share of nones (41%) and people with other religions (13%) is the same in both scenarios. Without ongoing defection from Christianity among adults over 30, the Christian population would only be slightly larger.
Acknowledgments
This report was produced by Pew Research Center as part of the Pew-Templeton Global Religious Futures project, which analyzes religious change and its impact on societies around the world. Funding for the Global Religious Futures project comes from The Pew Charitable Trusts and the John Templeton Foundation (grant 61640).
This report is a collaborative effort based on the input and analysis of the following individuals. Find related reports online at pewresearch.org/religion.
Primary Researchers
Stephanie Kramer, Senior Researcher
Conrad Hackett, Associate Director of Research and Senior Demographer
Marcin Stonawski, Director, Center for Advanced Studies of Population and Religion (CASPAR)
Research Team
Anne Fengyan Shi, Senior Researcher
Yunping Tong, Research Associate
Gregory A. Smith, Associate Director of Research
Justin Nortey, Research Analyst
Joshua Alvarado, Research Assistant
Alan Cooperman, Director of Religion Research
Editorial and Graphic Design
Dalia Fahmy, Senior Writer and Editor
Michael Lipka, Editorial Manager
Rebecca Leppert, Editorial Assistant
Bill Webster, Senior Information Graphics Designer
Communications and Web Publishing
Stacy Rosenberg, Associate Director, Digital
Reem Nadeem, Associate Digital Producer
Anna Schiller, Senior Communications Manager
Kelsey Beveridge, Communications Associate
Others at Pew Research Center who provided guidance include Andrew Mercer, senior research methodologist; Phillip Connor, former senior researcher; and Jacob Ausubel, former research assistant.
Methodology
This study projects the future population sizes of Christians, religious “nones” and people of other religions in the United States. Since recent religious change in the U.S. has been driven primarily by voluntary changes in religious identity – religious switching – we modeled for the first time how the religious landscape could change in scenarios with different patterns of future switching, as well as additional scenarios quantifying the relative impact of other dynamics, including migration, fertility and transmission of religion from parent to child. Methodologically, the study builds on the multistate cohort component methods used in previous Pew Research Center studies projecting the future of world religions, as well as how migration may shape Europe’s growing Muslim population.
Previous religious population projections by Pew Research Center assumed that all children inherit their mother’s religion (or lack of religion). We were aware that this is an oversimplification of the process of intergenerational religious transmission, but in most countries, we did not have input data on which to model more nuanced transmission dynamics. We do not know of any prior population projections that have attempted to model anything aside from perfect transmission of religious identity from parent to child. This study uses Pew Research Center data about levels of religious transmission between parents and their children to model the potential breakdown of intergenerational religious transmission.
While religious switching is typically concentrated among young adults, Center researchers have found that in recent decades, there also has been a modest amount of switching among adults over age 30. In a theoretical innovation, this study posits that later adult switching may be a part of the process whereby societies in which 90% or more of adults once identified as Christian transition to a society with significantly lower Christian retention rates. In a methodological innovation, we model this phenomenon of later adult switching continuing for cohorts that still had levels of Christian identification over 70% at age 30.
This Methodology section provides details on the input data and methods used in the projections. The first section explains how the baseline (2020) religious composition estimates were derived. The second section describes how key input data (age and sex composition, fertility, mortality, migration, transmission and religious switching) were gathered. The third part of this Methodology details the projection methods. Appendix A describes the survey sources used in this report. And Appendix B presents U.S. religion trends from a range of surveys and discusses analysis of international retention rates that influenced projection assumptions in this report.
Input data
This is an overview of input data used for the baseline population and projections in this report. In the projections, results for men and women are modeled separately because men and women vary in religious composition, switching rates, rates of inheriting their mother’s religion (intergenerational transmission) and life expectancy. In the report, these results are aggregated to report on men and women together. We do not have enough data on people who say their gender is different from their sex assigned at birth to separately project religion trajectories for people who are transgender or nonbinary.
Baseline structure
The baseline religious composition of the U.S. by age and sex is based on data from the American Trends Panel (ATP) and Pew Research Center’s survey of teens (for the age group including 15- to 19-year-olds). The religious composition of children ages 0 to 14 is estimated based on the age structure of women in each broad religious category, fertility patterns by religion, and the assumption that children generally inherit their mother’s religion. (In this step, we assume rates of religious inheritance similar to those used in our projection modeling, as described later in this Methodology.)
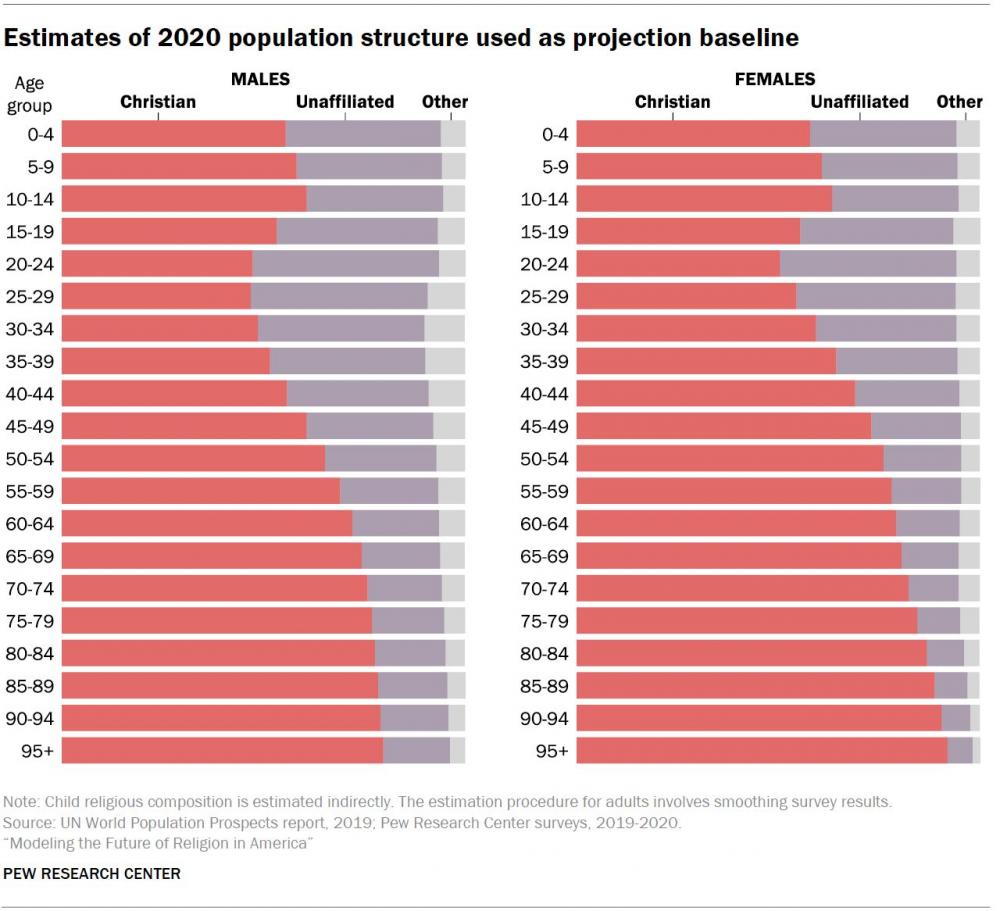
Religious composition is estimated for each five-year age and sex group, such as women ages 25 to 29 and men ages 60 to 64. For age groups older than 80, we have a modest number of respondents. The religious composition of these older age groups was estimated indirectly using a decomposition procedure, which involved extrapolating trends observed in younger cohorts to older age groups.
The religious compositions of each adult five-year age and sex group were smoothed and raked to match the overall religious composition from the ATP. This procedure minimizes jumps between age groups that may be due to statistical noise.18 To estimate the count of people in each religious group, we multiply estimates of the share of Christians, “nones” and those who identify with other religions in each age and sex group by the estimated count of total people in each cohort, according to the UN’s 2019 World Population Prospects statistics. The smoothed 2020 age, sex and religious composition is shown in the above table. This age and sex composition is the baseline for each projection scenario. (Refer to Appendix B for more information about sources of religion data.)
Fertility
Population projections use estimates of current and future fertility rates among women of different ages. In this and other Pew Research Center projections of religious change, country-level estimates of current and future fertility come from the United Nations (UN total fertility rate projections under their medium fertility scenario). According to this UN data, updated in 2019, the overall total fertility rate in the U.S. is expected to increase very slightly, but throughout this century, the UN’s expected fertility rate rounds to 1.8 children per woman.19
Data on religious differentials in fertility are based on several waves of the National Survey of Family Growth (NSFG). Estimates of fertility used in this report for Christians, religious “nones” and other religious groups are the product of differentials observed in the NSFG applied to current and future overall U.S. fertility rates estimated by the UN. Total fertility rates used for the 2020-2025 period are 1.9 for Christian women, 1.6 for the religiously unaffiliated and 2.0 for women of other religions, and these differentials remain stable throughout the projection period.
Vital Statistics data from the U.S. reveals a recent decline in fertility that is not reflected in the input data from the NSFG and the UN. According to the CDC, the fertility rate has already fallen to 1.7 children per woman. However, Vital Statistics data provides no information on religious differences in fertility and it reports only on past fertility patterns.
In Pew Research Center’s 2015 projections of religion around the world, the central projection scenario assumed that over the course of a century, fertility differences among religious groups would diminish and eventually disappear. However, past patterns suggest that the extent to which fertility rates converge may vary significantly by context. If we assume that the fertility rates of Christians, “nones” and other religious groups in the United States will converge with one another, this would lead to an uptick in the fertility of the unaffiliated, who currently have the lowest fertility rates. But we do not have clear precedent for an uptick in fertility among the unaffiliated, and since we lack clear reasons to think that fertility rates will converge among groups in the U.S., fertility differentials are assumed to remain constant in all scenarios.
Mortality
Survival rates are calculated based on mortality data from the UN’s 2019 World Population Prospects report. Mortality rates vary over time, by sex and five-year age group, but the same rates are applied regardless of religious affiliation. The UN projects that life expectancy at birth in the U.S. will increase from 79 in 2020 to 86 in 2070. The life expectancies of most other age groups are expected to increase significantly during this period as well. For example, today’s 40-year-olds can expect to live another 41 years, and people who turn 40 in 2070 are expected to have another 47 years of life, on average.
Migration
The estimated size of future migrant flows into and out of the United States are based on global migration flow estimates produced by Shanghai University professor Guy Abel, based on the UN’s 2015 estimates of migrant stocks by origin and destination. The religious composition of migrants from other countries to the U.S. is based on Pew Research Center analysis conducted for the 2012 report, “Faith on the Move – The Religious Affiliation of International Migrants,” which drew on U.S. sources including the New Immigrants Survey and the Center’s “Religious Landscape Study.” Data collected for the “Faith on the Move” report included the religious composition of U.S.-born people living in other countries. This aggregated information on the religious composition of emigrants from the U.S. is used to estimate the religious composition of people who will move away from the U.S. in future decades.20
Migration both into and out of the United States is assumed to stay constant at 2010-2015 levels throughout the projection period. Based on these estimates, migration will account for net population growth of about 5 million people in each five-year period.
Transmission
New analyses across several datasets revealed that transmission of religious identity from mothers to children falls short of the 100% transmission rate assumed in previous projection models. Transmission of mothers’ religious identity is less common when parents do not share a religion or when neither parent is highly religiously committed. The data on current transmission rates in the U.S. come from Pew Research Center’s 2019 survey of teens. In this dataset, there are many teens, often with loosely affiliated parents or with one Christian and one unaffiliated parent, who do not share their mother’s religious affiliation. This mirrors transmission patterns observed in retrospective data from older cohorts in the General Social Survey (GSS) and the National Study of Youth and Religion (NSYR). Projection scenarios compare the impact of full transmission (100% of children inherit their mother’s affiliation) to observed transmission rates from the teens survey.
It would be ideal to have measures of religious socialization and transmission in preteen years to clearly distinguish between the phenomenon of parental transmission of religion and religious switching that typically begins in adolescence and continues in young adulthood. However, the teens survey was the best source available to us about transmission that has (or has not) occurred by age 13. In the teens survey, teens ranged from ages 13 to 17. We were concerned that the religious composition of older teens might have been influenced by the religious switching that often occurs in adolescence and young adulthood. However, we found that older and younger teens in this sample were about equally likely to share their mother’s religion. Therefore, we used data from all teens in the survey to estimate transmission rates. In reality, religious transmission is a complex process that may involve a mix of intentional and unintentional actions and messages communicated by parents and others to children over the course of many years. In our model, patterns of whether teens had adopted their mother’s religion in the teens survey are used as input data to model rates of transmission as something that does or does not occur at birth. Modeling transmission or non-transmission at birth is, of course, a simplification for projection purposes.
Due to the large size of Christian and unaffiliated populations in the U.S., we have data from many more Christian and religiously unaffiliated mothers than mothers in the “other religion” category. We model the imperfect transmission of religious identity from mothers in the other religion category to their children based on data from an effective sample size of fewer than 100 respondents. Since we therefore have less confidence in other religion transmission numbers than the transmission patterns for Christian and unaffiliated mothers, transmission data for mothers affiliated with other religions is not displayed in this report. Furthermore, transmission in the other religion category may be difficult to interpret because it combines all religious identities aside from Christian and religiously unaffiliated identities.
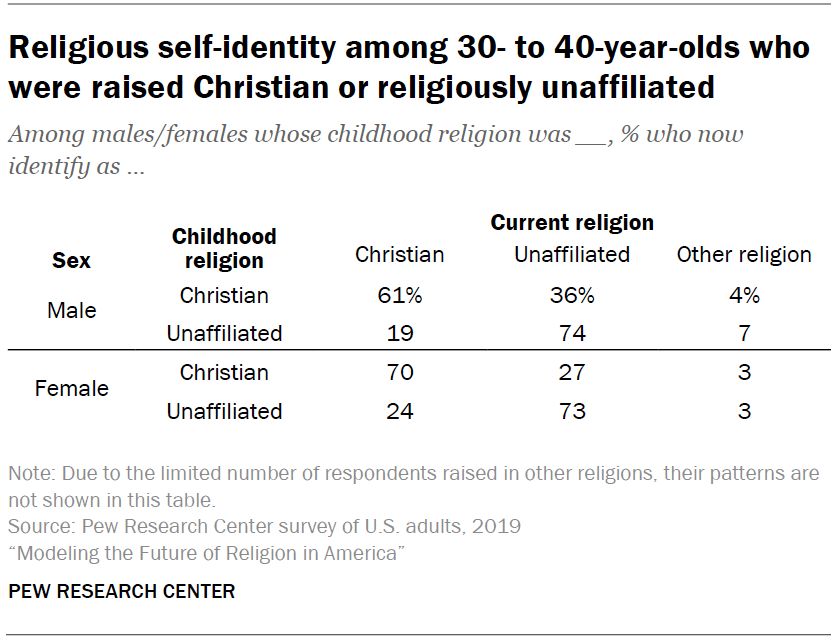
The scenarios in this report assume one of five future switching patterns: no switching at all, steady switching, rising switching rates with limits, rising switching rates without limits, and no switching after age 30. The pattern in which religious switching continues to occur among young adults (ages 15 to 29) at constant, recently observed rates is based on the amount of switching measured among people ages 30 to 40 in the ATP. These panelists are the cohort to have moved through young adulthood most recently, and also are a large enough group to base estimates on. Within this group, Christianity has retained the smallest shares of its members, with 61% of men and 70% of women who say they were raised Christian still identifying as Christian in their 30s. For the projections, probabilities of switching are distributed equally across the young adult switching period. For example, the 30% of women who would be expected to leave Christianity during early adulthood are modeled as equally likely to leave in the 15 to 19, 20 to 24, and 25 to 29 age groups.
Two scenarios account for trends in switching across cohorts and extrapolate them into the future, with or without caps on how high or low switching and retention rates could go. This is because disaffiliating from Christianity has become steadily more common across successive cohorts, and this trend could continue. Switching inputs for cohort models are based on observations in the GSS since 1973.21 Rates at ages 30 to 34 (right after the young adult switching period closes) for five-year birth cohorts are estimated using rolling averages across three observations. Depending on the scenario, this trend is either allowed to continue in a linear model or to flatten out once Christian retention reaches a low of 53% by 2050 and unaffiliated retention reaches a high of 95% by the year 2100. These shares were chosen as plausible boundaries based on the range of retention rates observed in cross-national analyses of 79 other countries from Pew Research Center, the International Social Survey Program (ISSP) and the British Social Attitudes Survey (BSAS). (The most recent data was analyzed when more than one dataset per country was available.) A lower bound for Christian retention within each generation is consistent with the supposition that the Christians remaining after a period of widespread disaffiliation will be relatively committed, rather than increasingly likely to defect.
In all of the scenarios, steady rates of switching are assumed for members of other religions due to the limited number of respondents available to provide data on patterns of retention and switching among those who grew up in other religions.
Switching after age 30
Most religious switching happens in early adulthood, but older American adults also have been disaffiliating from Christianity in recent decades. We think that disaffiliation after age 30 may be largely due to a period effect in the U.S., in which loosely affiliated people of all ages are leaving the faith now that a Christian identity is no longer so common that it is taken for granted and perceived as socially necessary. An analysis by birth cohort in the GSS revealed that, starting in the 1990s, Christian retention rates declined by about 7 percentage points after the young adult switching period in several 10-year birth cohorts.
There is not much cross-national survey data that could show what tends to happen when countries go through a period like this. The highest-quality data comes from the British Social Attitudes Survey, and Britain transitioned away from an 85-90% Christian majority much earlier than the U.S. The BSAS has been conducted every year since 1983 with a similar sample size to the GSS. (The BSAS includes a two-step question on religious affiliation, unlike the GSS.) Based on the same method as the GSS analysis, there was little further attrition from Christianity after age 30 in any Great Britain cohort going back to those born in the 1930s. The highest Christian retention rate for any cohort was about 80%.
In 20 ISSP countries where religious switching could be measured across multiple years and (relatively large) age groups, there were only two examples of further disaffiliation from Christianity among adults older than 30 once retention was already at 70% or below: France and Australia.
For scenarios that allow for more switching after age 30, an additional 7-point drop in retention – based on the pattern in the GSS over the past couple of decades – is applied to cohorts that leave young adulthood with Christian retention rates higher than 70%. This later attrition is applied evenly across ages 30 to 65. About three-quarters of American adults who were born in the 1980s and were raised Christian were still Christian in their 30s, so this will be the last birth cohort to receive an adjustment allowing for further adult attrition. People born in the 1990s and raised Christian are entering their 30s with a lower retention rate than the prior cohort, continuing the recent trends (refer to Appendix B for details on trends that inform these modeling assumptions).
Since the analysis for this report was completed, new data from Australia suggests that, at least in Australia, switching out of Christianity may continue beyond age 30, even among cohorts already at 70% or lower retention by age 30.
A July 2022 Australian Bureau of Statistics report comparing responses to Australia’s religion census question in 2016 and 2021 finds a considerable overall change in this short period. The report says that in 2016, 52% of the population identified as Christian, 30% identified with no religion, 8% identified as “other religion” and 9% didn’t answer the religion question.22 In 2021, the Christian share of respondents dropped to 44%, the religiously unaffiliated rose to 39%, 10% identified as “other religion” and 7% didn’t answer the question.
The Australia census doesn’t measure childhood religion (measuring childhood religion in any census is uncommon but Scotland included such a measure in 2001), so it isn’t possible to calculate retention rates directly from one year’s census data. But it is possible to consider how counts for groups of Australians vary from one census to the next. Because census data is gathered from the entire Australian population and since there has been considerable change in this period, it is possible to detect that among adults ages 30 and older, at each 2016 age, fewer Christians were counted in 2021. For example, 170,425 50-year-olds identified as Christian in 2016. Five years later, when this cohort was 55, they numbered only 157,097. Conversely, counts of unaffiliated older adults rose. There were 79,468 50-year-olds who identified with no religion in 2016 and five years later, their number swelled to 100,919.
In the Australia data, as in many previous studies, religious change is once again concentrated in young adult years. However, this new data reveals that in this country, where only about half of the population identified as Christian in 2016 and Christian retention among 30- to 49-year-olds had already dropped to 55% in 2018, modest levels of switching from Christianity to no religion seem to have continued among middle-aged and older adults.23
By contrast, as described previously, most scenarios in this Pew Research Center report assume that older adult switching will cease for Americans born in the 1990s and later. If these rising cohorts in the U.S. instead follow this newly observed Australian pattern of ongoing switching throughout the life course, then this report’s assumption about the end of older adult switching will have been premature.
Modeling of switching
Projections of switching used in the scenarios are based on data from the 1973-2018 GSS and the 2019 ATP. Using these sources, we estimated retention for subsequent cohorts averaging results at ages 30 to 34 at each time t; 35 to 39 at time t+5; and 40 to 44 at time t+10,assuming that most switching events occur before age of 30. Thus, averaged results from ages 30 to 44 for cohorts give us good approximation of retention. In the next step, we fit the mathematical model to these estimates. We chose the four-parameter Weibull model, which enables us to put the limits on retention levels used in some chosen scenarios. Then, the models for each religious group are used for projections of retention achieved in subsequent cohorts in the future. The retention numbers are transformed into switching rates equally distributed among five-year age groups of the main switching period of life of individuals (ages 15 to 29).
The projection approach
The technical calculations for the projections in this report were made in collaboration with the Center for Advanced Studies of Population and Religion (CASPAR) and its director, Marcin Stonawski, using an advanced variation of the standard demographic method of making population projections. The standard approach is called the cohort-component method, and it takes the age and sex structure of a population into account when projecting the population forward in time. This has the advantage of recognizing that an initial baseline population can be relatively “young,” with a high proportion of people in younger age groups (such as the unaffiliated) or relatively “old,” with a high proportion of older people (such as Christians).
Cohorts are groups of people that had an experience in a particular time. A birth cohort, the type of cohort referenced in this context, comprises people born during a certain period. Birth cohorts can also be described as males or females who have reached a certain age in a particular year. For example, the cohorts of females ages 15 to 19 in the year 2000 and males ages 15 to 19 in the year 2000 shared the experience of being born between 1981 and 1985.
Components are the three ways in which populations grow or shrink: new entrants via births, exits via deaths and net changes from migration. Each cohort of the population is projected into the future by adding likely gains – births and people moving into the country (immigrants) – and subtracting likely losses – deaths and people moving out (emigrants) – year by year. The very youngest cohorts, those ages 0 to 4, are created by applying age-specific fertility rates to each female cohort in the childbearing years (ages 15 to 49).24
The cohort-component method has been in existence for more than a century. First suggested by the English economist Edwin Cannan in 1895, then further improved by demographers in the 1930s and ’40s, it has been widely adopted since World War II. It is used by the United Nations Population Division, the U.S. Census Bureau, other national statistical offices, and numerous academic and research institutions.
The advanced variant of this approach, multistate cohort component projection, became viable starting in the 1970s thanks to the availability of mainframe computers and work by the American geographer Andrei Rogers, among others. The multistate approach permits simultaneous projection of the religious groups included in this study, taking into account variation by religion in age, sex, childbearing patterns, and propensity and direction of migration. This approach also enables modeling of religious switching as a transition between religious “states.”
Appendix A: Sources of religion data
This report relies on religion data from several sources. Data on current patterns of religious switching come from Pew Research Center’s American Trends Panel (ATP). Adult religious composition data in the ATP is weighted to results from Pew Research Center’s National Public Opinion Reference Survey (NPORS). Data on patterns of religious transmission between parents and children come from analysis of a 2019 Pew Research Center survey of teens and their parents. Religious switching trend data come from NORC’s General Social Survey. Each of these sources is described below.
The American Trends Panel
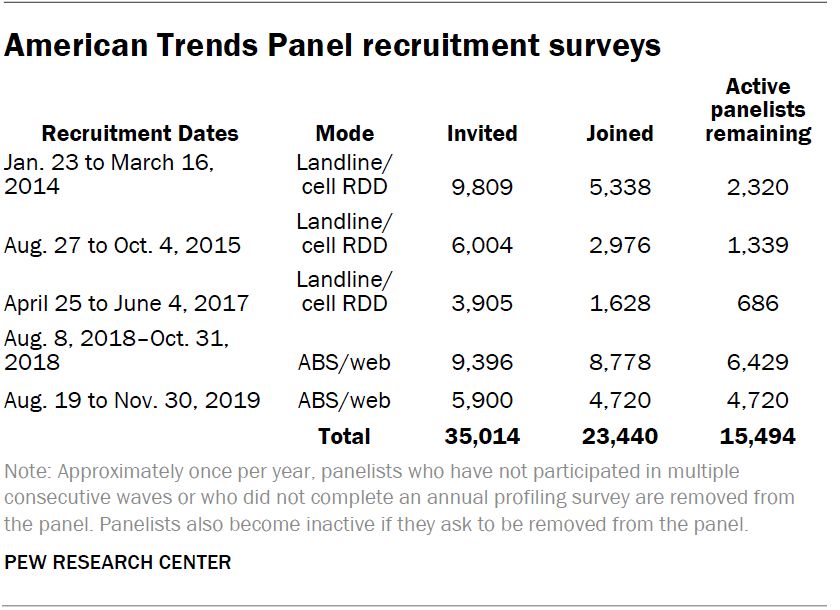
The American Trends Panel, created by Pew Research Center, is a nationally representative panel of randomly selected U.S. adults. Panelists participate via self-administered web surveys. Panelists who do not have internet access at home are provided with a tablet and wireless internet connection. Interviews are conducted in both English and Spanish. The panel is being managed by Ipsos.
The analysis in this report is based on demographic profile data for all 15,494 active panel members as of Nov. 30, 2019. For 10,744 panelists who joined the panel prior to 2019, the data was collected on the ATP’s 2019 annual profile survey conducted Aug. 7 to Sept. 29, 2019. For 4,720 panelists who were recruited in 2019, the data was collected on the 2019 recruitment survey conducted Aug. 16 to Nov. 30, 2019.
The ATP was created in 2014, with the first cohort of panelists invited to join the panel at the end of a large, national, landline and cellphone random-digit-dial survey that was conducted in both English and Spanish. Two additional recruitments were conducted using the same method in 2015 and 2017, respectively. Across these three surveys, a total of 19,718 adults were invited to join the ATP, of which 9,942 agreed to participate.
In August 2018, the ATP switched from telephone to address-based recruitment. Invitations were sent to a random, address-based sample (ABS) of households selected from the U.S. Postal Service’s Delivery Sequence File. In each household, the adult with the next birthday was asked to go online to complete a survey, at the end of which they were invited to join the panel. For a random half-sample of invitations, households without internet access were instructed to return a postcard. These households were contacted by telephone and sent a tablet if they agreed to participate. A total of 9,396 were invited to join the panel, and 8,778 agreed to join the panel and completed an initial profile survey. The same recruitment procedure was carried out in August 2019, from which a total of 5,900 were invited to join the panel and 4,720 agreed to join the panel and completed an initial profile survey.
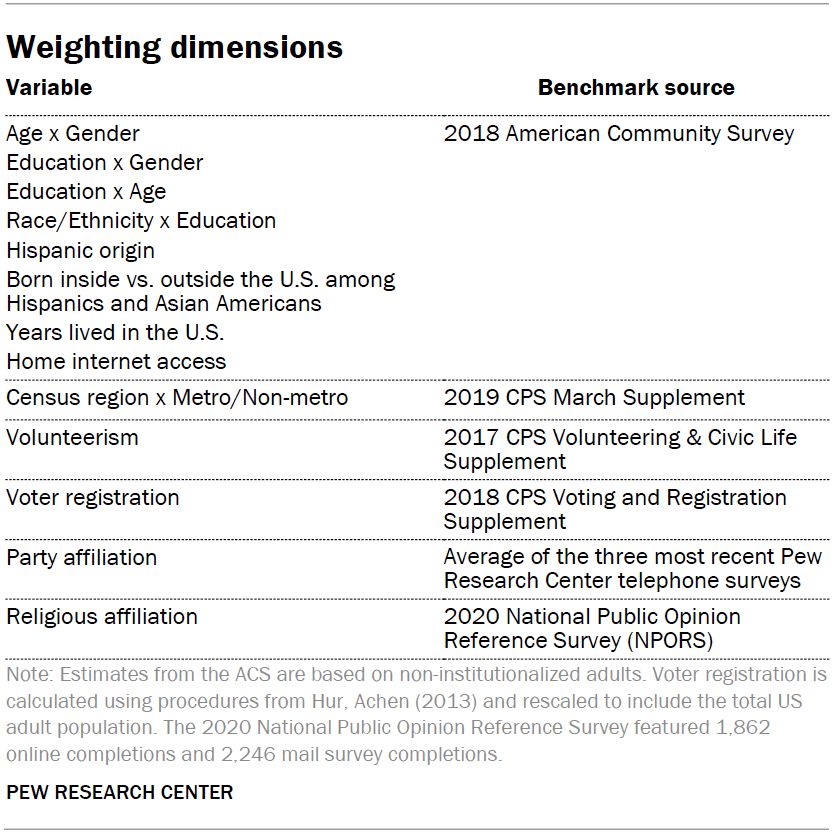
The U.S. Postal Service’s Delivery Sequence File has been estimated to cover as much as 98% of the population, although some studies suggest that the coverage could be in the low 90% range.25
Weighting
The ATP data was weighted in a multistep process that accounts for multiple stages of sampling and nonresponse that occur at different points in the survey process. First, each panelist begins with a base weight that reflects their probability of selection for their initial recruitment survey. The base weights for panelists recruited in different years are scaled to be proportionate to the effective sample size for all active panelists in their cohort. To correct for nonresponse to the initial recruitment surveys and gradual panel attrition, the base weights for all active panelists are calibrated to align with the population benchmarks identified in the accompanying table to create a full-panel weight.
In addition to sampling error, one should bear in mind that question wording and practical difficulties in conducting surveys can introduce error or bias into the findings of opinion polls.
National Public Opinion Reference Survey
The ATP may underrepresent a portion of the population that would participate by paper and pencil (if given the option) but would be reluctant to be surveyed online, and which is presumably more highly religious than the rest of the U.S. public. As a result, Pew Research Center has decided, for the foreseeable future, to adjust (or “weight”) ATP samples to religious affiliation parameters derived from the NPORS. For more explanation, please refer to the report “Measuring Religion in Pew Research Center’s American Trends Panel.” For details on the design and administration of NPORS, see the survey methodology.
Survey of teens and parents
The analysis of how religious identity is transmitted between parents and children in this report is based on a self-administered web survey conducted by Pew Research Center in 2019, among a sample of 1,811 pairs comprised of one U.S. adolescent ages 13 to 17 and one parent per adolescent. The survey was conducted by Ipsos Public Affairs in English and Spanish using KnowledgePanel, its nationally representative online research panel. Here is the survey methodology.
The General Social Survey
The General Social Survey (GSS), conducted by NORC at the University of Chicago, began in 1972 and primarily collected survey data in face-to-face interviews for most of its history. When the pandemic made face-to-face data collection infeasible, in 2021 the GSS switched to use address-based sampling for recruiting participants, who were invited to take the GSS online. This change in mode could explain some change in religious affiliation between 2018 and 2021. Complete GSS documentation and data is available at https://gss.norc.org/.
Appendix B: Supplemental analyses
Pew Research Center conducted analyses not detailed elsewhere in this report to make decisions that shaped projections. This appendix contains an overview of some of these analyses.
Trends in other sources of religious composition data
This report considers how the rapid and continuous rise of religious “nones” in the United States might continue or change in the future. However, in 2021, one report suggested the number may have already begun to decline. To evaluate this possibility, data from the American National Election Survey, Gallup and Public Religion Research Institute (PRRI) was compared with the Pew Research Center and General Social Survey (GSS) trends that form the basis of the report. While each of these data sources have shown occasional small declines in unaffiliated shares from year to year, the common pattern is a steady increase in unaffiliated shares over the decades. What appear to be occasional small declines may be statistical noise, including effects of changing survey and sampling methodologies.
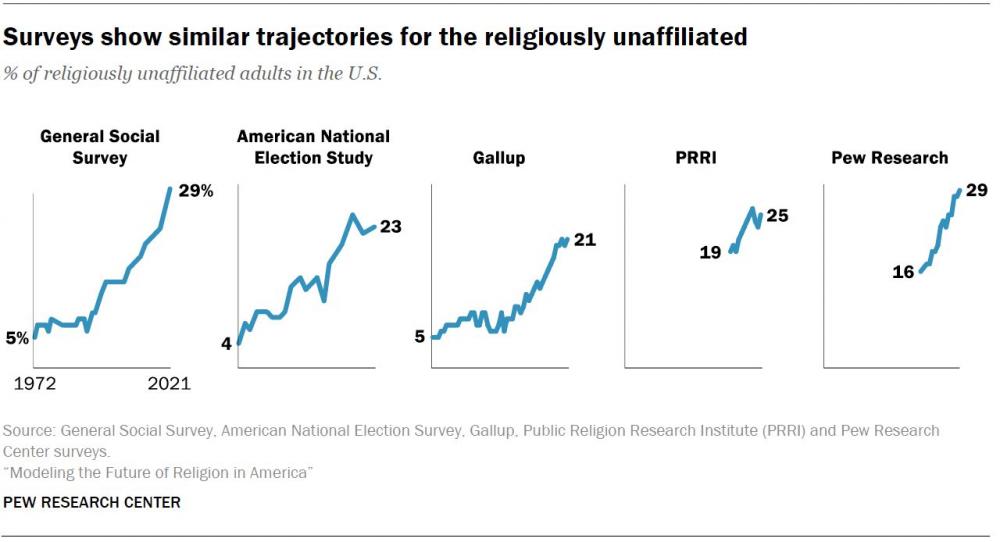
While the unaffiliated share reported by PRRI was lower in 2021 than the organization reported in previous years, PRRI again reported an increasing share of “nones” in 2022. Considering the general trend across surveys and the declining rates of religious affiliation among young cohorts, the preponderance of evidence suggests the share of “nones” is not declining and, as described in the “no switching” scenario of this report, should be expected to grow for demographic reasons alone (e.g., the younger age structure of “nones” compared with the religiously affiliated).
While different surveys show the same general rise of Americans identifying with no religion, scholars have noted that the specific estimate varies across surveys. In 2002, sociologists Michael Hout and Claude Fischer noted that Gallup estimates were lower than estimates from the National Election Study, Pew Research Center and the GSS. They observed, “One important distinction between Gallup and the other surveys: Gallup interviewers accept ‘no religion’ as an answer but do not suggest it to their respondents.” The other surveys offered explicit “no religion” options.26 Gallup has since adjusted its response options, though it continues to have a relatively low estimate of religious “nones.”
International retention
The “rising disaffiliation with limits” scenario imposes a floor of 50% retention for men raised Christian and 55% for women raised Christian. This limit was chosen after an analysis of Christian retention rates in 79 countries outside the U.S. This analysis relied on data from the International Social Survey Program, the British Social Attitudes Survey, and regional Pew Research Center surveys covering sub-Saharan Africa, Latin America, Central and Eastern Europe, and Western Europe. (We analyzed the most recent survey when multiple data sources were available for a country.) Every survey included a question about which religion respondents were raised in as well as a question about their present religious affiliation.
Among people ages 30 to 49, the average country had a Christian retention rate (the percentage of people raised Christian who still identify as Christian) of 87%. The lowest rates of Christian retention were in Great Britain (49%), France (52%) and the Netherlands (53%). Countries with large Christian majorities also tended to have high retention rates, but high retention rates were also found in some countries in which Christians are a minority.
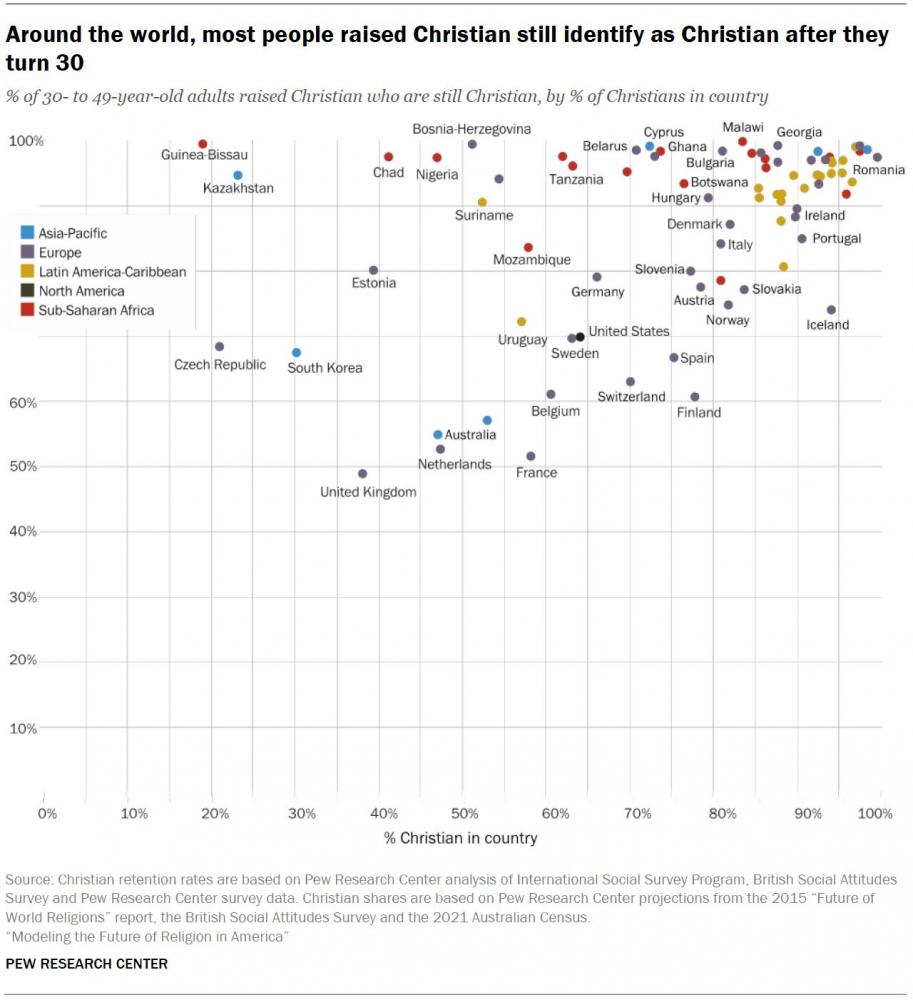
The report’s “rising disaffiliation with limits” scenario also imposes a ceiling for unaffiliated retention at 95%. This threshold arose from a similar analysis of 30- to 49-year-olds in 22 countries (fewer countries had sufficient samples of people who were raised with no religion to analyze). Great Britain and the Czech Republic had the largest shares of people who remained unaffiliated after being raised without a religion, with a little over 95% retention each. Across countries, the average unaffiliated retention rate was 73%.
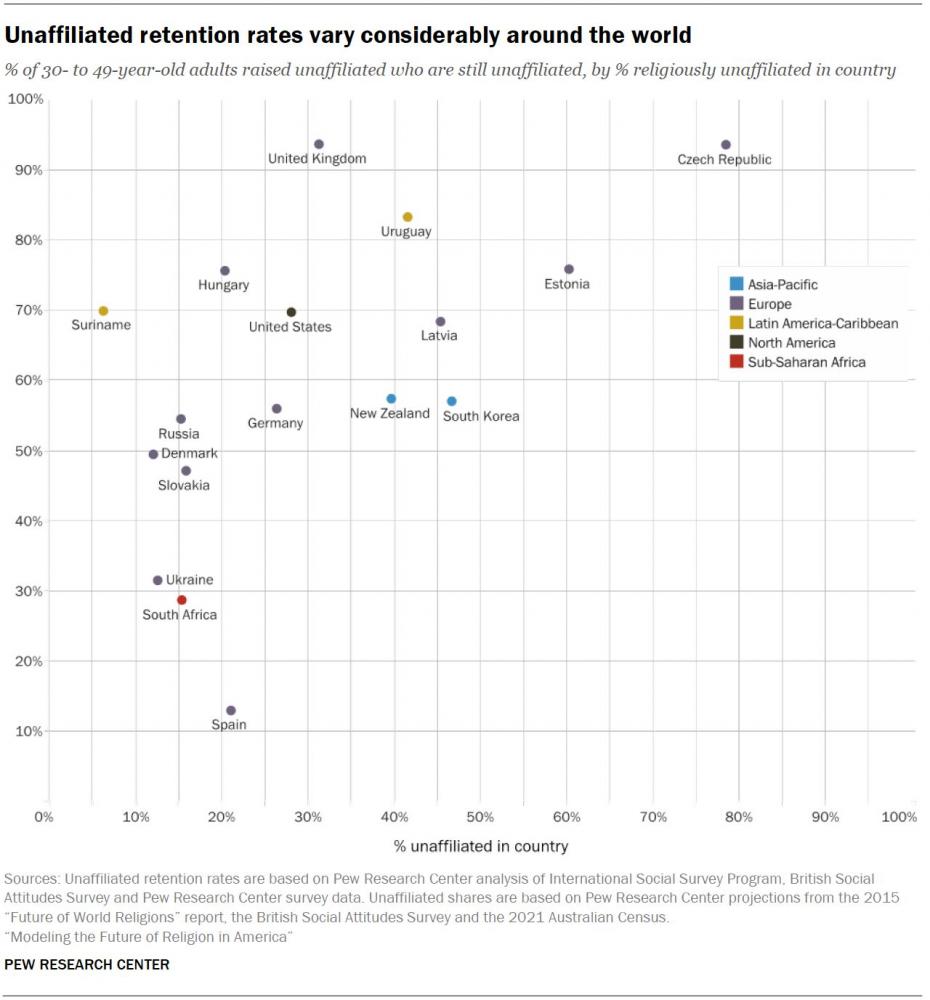
Disaffiliation after age 30
Most scenarios assume that cohorts with members between the ages of 30 and 65 in 2020 will lose 7 percentage points in Christian retention by age 65. This figure is based on an analysis of later switching by 10-year birth cohort. People born in the 1950s, ’60s and ’70s had lost an average of about 7 points in Christian retention between the year their oldest members turned 30 and 2018.27
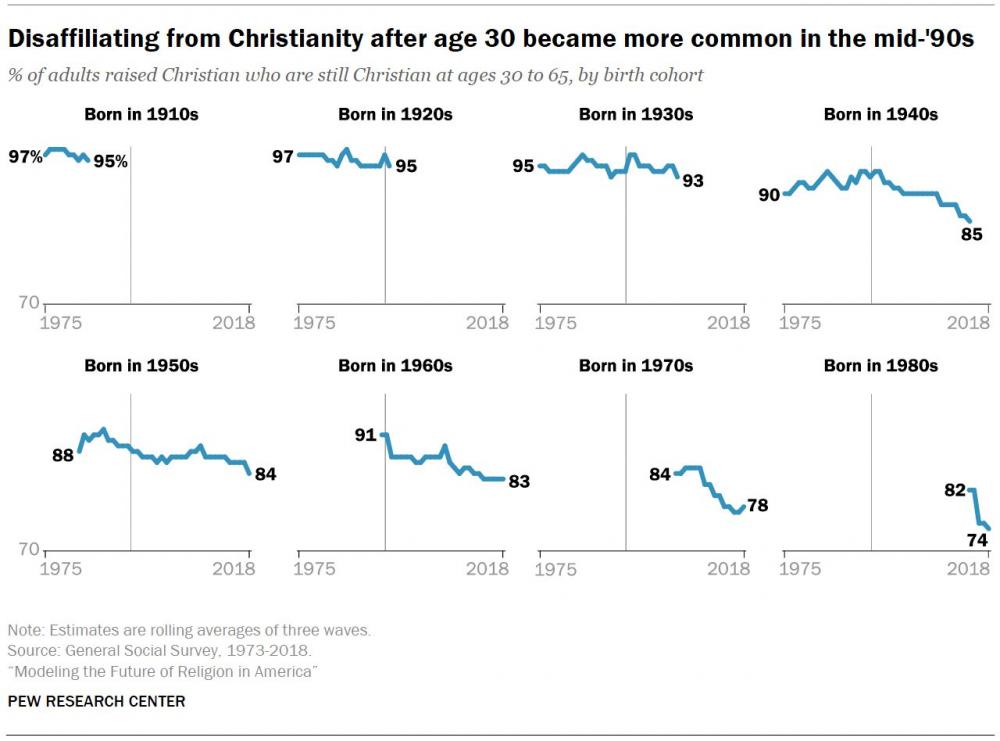
This pattern of later attrition began in the 1990s among people born in the ’40s and later, at about the same time as the broader trend of disaffiliation from Christianity. It may be based on a period effect in which adults of all ages who were loosely affiliated with Christianity felt free to disaffiliate as the unaffiliated grew in numbers. After this period, switching may return to being almost exclusively a phenomenon of young adulthood, but it is unclear when this period will end.
To get a rough idea of when later attrition could end, we looked for later switching in 21 countries outside the U.S. with sufficient data to compare retention rates across birth cohorts for at least two time points. The best cross-national comparison to the U.S., both in terms of conditions/histories and data quality, come from the British Social Attitudes Survey (BSAS). This social survey is similar to the GSS in sample size, and it has been conducted every year since 1983, but its flaws are outlined in the earlier discussion of data issues. Based on exactly the same method as in the GSS cohort data analysis, the British data shows falling retention by cohort at age 30 (i.e., increases in attrition from Christianity during young adulthood) until retention got down to about 50%, but no attrition from Christianity among people ages 30 and older in any cohort going back to those born in the 1930s. For example, rolling averages of three waves for retention were between 73% and 80% for Brits born in the 1930s and raised Christian in every survey year, with the highest retention rate in 2016. People born in the 1940s started and ended the measurement period with retention rates in the high 60s, and this pattern of consistency held for 60% of people born in the 1950s, 50-57% born in the 1960s, and about 50% for those born in the 1970s and 1980s.
This may indicate that Britain – which became a country where Christian identity could no longer be taken for granted far earlier than the U.S. – reached a floor for attrition among people ages 30 and older by the mid-1990s. Since the British data starts with retention rates in the high 60s to low 70s and none of the cohorts show any substantial drops in retention after age 30, this may be a reasonable threshold at which to assume that switching ends for adults over 30.28
In 20 other countries for which we analyzed smaller sample sizes for larger cohorts over two or three survey waves, there were only two countries where Christian retention was 70% or below and there was still decline within cohort after age 30: People born in the 1950s and early ’60s in France who were raised Christian showed a drop in retention from 56% to 52% between 2008 and 2018 – a relatively small amount of change. The same cohort in Australia, however, declined from 61% to 46% retention. Data for these 20 countries comes from the ISSP, and there are large and difficult to explain fluctuations in some countries, but the patterns in most countries converge with the retention floor suggested by the British data – i.e., the 70% Christian retention floor at which point switching after 30 ends.
After the projections in this report were completed and shortly before the report was released, we became aware of 2021 census data from Australia showing that the count of Christians had dropped among adults of all ages since 2016, though declines were concentrated among young adults. At the same time, the count of religiously unaffiliated Australians had increased among adults of all ages, though this pattern too was concentrated among young adults (see discussion in Appendix A). After reading about these census patterns, we were able to gain access to 2018 ISSP religion module data for Australia that was excluded from the international release of 2018 ISSP religion module data. Australia’s ISSP data confirmed the ongoing decline in retention rates suggested by 2021 census data (see earlier discussion of ISSP results).
If the United States follows Australia’s example of people who were raised Christian continuing to disaffiliate after young adulthood even among cohorts with retention rates below 70% at age 30, then the adult switching patterns included in this report could prove to be conservative. This report introduces new innovations in projections of the religious future of the United States. We hope future studies will build on this work, taking advantage of new data that will become available in the years ahead.
1. Precise estimates are rounded to integer values in the text for ease of reading. In 2020 – the starting point for the scenarios in this report – U.S. children were slightly less likely than adults to be religiously affiliated. (One reason for this is that parents of childbearing age are more likely to be religiously unaffiliated than are older adults). For the purposes of the models in this study, we present estimated and projected shares of Americans of all ages, including children. Throughout the rest of this report, figures that apply only to the adult population are specified accordingly. In Pew Research Center’s survey report on religious affiliation in 2021, 63% of U.S. adults (ages 18 and older) identified as Christian, 29% identified as religiously unaffiliated, 6% identified with other religious groups, and 2% were missing religious identity information. After excluding respondents who were missing religion information, the shares from the 2021 survey match our 2020 baseline (64% Christian, 30% religiously unaffiliated and 6% other religion)
2. Our base model includes estimated rates of switching in all directions, not just from Christianity to unaffiliated. For example, we estimate that 3% of people raised Christian switch to a different (i.e., non-Christian) religion during their young adult years, and that 21% of people who are raised with no religion (i.e., as atheist, agnostic or “nothing in particular”) become Christian in young adulthood.
3. The retention rate is the percentage of people raised in a religious group (in childhood) who remain in that group in adulthood. A Christian retention rate of 66% would mean that two-thirds of people raised as Christians remain Christians in adulthood. A Christian retention rate below 50% would mean that fewer than half of people raised as Christians remain Christians in adulthood. This “floor” of 50% is roughly equal to the lowest retention rate observed in an analysis of people ages 30 to 49 raised Christian in 79 other countries. It is reasonable to expect that some people will retain a Christian identity even if disaffiliation becomes more common. For more details on this analysis, see Chapter 2 and the Methodology.
4. Recent survey data indicates that the Christian retention rate in Britain is 49%, the lowest found in any of the 80 countries, including the U.S., for which data is available
5. The percentage of adults in Britain who identify as Christian depends, in part, on how the question is asked. Identification with Christianity remains higher in censuses than in surveys that measure religion by first asking respondents whether they have a religion and then, as a second step, collecting affiliation data only for those who answer that, yes, they do have a religion. Like census measures that directly ask, “What is your religion, if any?” Pew Research Center’s 2017 survey of religion across Western Europe relied on a one-step question and found higher levels of affiliation than two-step surveys like the British Social Attitudes Survey, the European Social Survey and the European Values Survey.
- This chapter focuses on results of public opinion surveys of U.S. adults. Most other population shares presented in this report are estimates for Americans of all ages. See Methodology for details on estimating the religious affiliations of children.
- Prior to 2020, the General Social Survey (GSS) was conducted primarily through face-to-face interviews. Due to the COVID-19 pandemic, in 2020 and 2021, the GSS gathered panel and cross-sectional survey data primarily online. Since most data for the cross-sectional survey was collected in 2021, NORC now describes the cross-sectional survey data as the 2021 GSS (see page 4 of the codebook for the latest GSS data). The change in the “mode” of survey administration was concomitant with the GSS finding a rise in religious “nones” from 23% in 2018 to 29% in 2021 and a corresponding drop in the share of U.S. adults who identified as Christian from 72% to 64%. Some of the change in the GSS between 2018 and 2021 may be due to this “mode effect.” For a basic explanation of mode effects, see Pew Research Center’s video “Methods 101: Mode Effects.” For more details on the GSS data used in this report, see the Methodology.
- Norris, Pippa, and Ronald Inglehart. 2011. “Sacred and Secular: Religion and Politics Worldwide.”
- Some research indicates that Americans tend to develop firm, enduring political identities earlier than religious ones, and their political views may influence their religious beliefs more than the other way around. See Margolis, Michele. 2018. “From Politics to the Pews: How Partisanship and the Political Environment Shape Religious Identity.” In addition, some scholars assert that the rise of the “nones” since the 1990s is due in part to a reaction or “backlash” following an increase in the visibility of the “religious right” and its conservative positions on polarizing issues. See Hout, Michael, and Claude S. Fischer. 2014. “Explaining Why More Americans Have No Religious Preference: Political Backlash and Generational Succession, 1987-2012.” Sociological Science.
- Regions are based on the U.S. Census Bureau’s definitions of South, Northeast, Midwest and West.
- Recent and future migration flows are estimated based on the most recent five-year period with complete global migration data at the time of analysis (mid-2010 to mid-2015).
- Due primarily to the COVID-19 pandemic, life expectancy decreased by 1.5 years between 2019 and 2020, according to the CDC. This reduction is expected to be temporary, so unadjusted UN estimates were used in projections.
- Some social scientists expect that a large revival of Christianity or another religion will not take place. According to the secular transition model developed by University College London professor of social science David Voas, big declines in religious affiliation are unlikely to be reversed. Voas contends that societies experience, at different times from country to country, a secular transition, a permanent large-scale change. “A transition,” Voas says, “is not cyclical or recurring; once out, the toothpaste will not go back in the tube.” See Voas, David. 2008. “The Continuing Secular Transition.” In Pollack, Detlef and Daniel V.A. Olson, eds. “The Role of Religion in Modern Societies.”
- Projections do not assume later switching into Christianity because there is no clear trend in this direction.
- Across scenarios that model switching at ages 30 to 65, the 7% further disaffiliation is only assumed for cohorts with retention rates above 70% at age 30. Of course, among cohorts in which Christian retention rates have already dropped to 70% or lower by the time members reach age 30, some individuals will still change religious identity after turning 30, including changes into and out of Christianity. However, such switching may be largely offsetting and rare.
- This later-adulthood switching applies only to cohorts born before 1990; disaffiliation has become so common in the decades since then that the models assume people born after 1990 who are going to switch will have done so before turning 30. Across scenarios that model switching at ages 30 to 65, the 7% further disaffiliation is only assumed for cohorts with retention rates above 70% at age 30.
- Across scenarios that model switching at ages 30 to 65, the 7% further disaffiliation is only assumed for cohorts with retention rates above 70% at age 30, i.e people born between 1956 and 1989.
- We smooth data using lowess (locally weighted scatterplot smoothing) across age groups. Lowess smoothing is a common technique used by statisticians and demographers. After smoothing the data, iterative proportional fitting (raking) is used to match the ATP measure of religious composition for the adult population.
- After the analysis for this report was complete, the United Nations released the first update to its 2019 World Populations Prospects. The 2022 revision was released on July 11, 2022. In this new update, the UN’s total fertility rate estimate for the U.S. in 2020 is 1.64 births per woman.
- For details on deriving migration estimates see Abel, Guy J. 2018. “Estimates of global bilateral migration flows by gender between 1960 and 2015.” International Migration Review. See also Abel, Guy J., and Joel E. Cohen. 2019. “Bilateral international migration flow estimates for 200 countries.” Scientific Data; and Abel, Guy J. 2013. “Estimating global migration flow tables using place of birth data.” Demographic Research.
- The first wave of the GSS, in 1972, did not ask about the religion in which respondents were raised.
- In the Australian Bureau of Statistics report, people who did not answer the religion question are included in the denominator of all percentages. If people who did not answer the religion question were excluded, all percentages would be slightly higher.
- Retention rate information comes from the 2018 ISSP religion module included on the Australian Survey of Social Attitudes. As of July 2022, this data was not available directly on the main GESIS ISSP data archive. However, we were granted access to the data by the Australian Data Archive.
- The number of children ages 0 to 4 projected to join a population is also influenced by infant and child mortality rates and migration rates, which are incorporated in the projection model.
- AAPOR Task Force on Address-based Sampling. 2016. “AAPOR Report: Address-based Sampling.”
- See Hout, Michael, and Claude Fischer. 2002. “Why more Americans have no religious preference: Politics and generations.” American Sociological Review
- The most recent data available to us for analyzing switching patterns in the GSS was from 2018. The 2020 GSS wave was delayed until 2021 because of the COVID-19 pandemic and when the 2021 data was released, the variable with information on the religion in which respondents were raised (relig16) was not initially available.
- For another perspective, see the discussion in Appendix A about switching patterns among older adults in a July 2022 report on religion data in the Australian census.
Spread the word