
The economically turbulent 2000s have redrawn America’s geography of poverty in more ways than one. After two downturns and subsequent recoveries that failed to reach down the economic ladder, the number of people living below the federal poverty line ($23,492 for a family of four in 2012) remains stubbornly stuck at record levels. Today, more of those residents live in suburbs than in big cities or rural communities, a significant shift compared to 2000, when the urban poor still outnumbered suburban residents living in poverty.1
But as poverty has spread, it has not done so evenly. Instead, it has also become more clustered and concentrated in distressed and high-poverty neighborhoods, eroding the brief progress made against concentrated poverty during the late 1990s.
The challenges of poor neighborhoods—including worse health outcomes, higher crime rates, failing schools, and fewer job opportunities—make it that much harder for individuals and families to escape poverty and often perpetuate and entrench poverty across generations.2 These factors affect not only the residents and communities touched by concentrated disadvantage, but also the regions they inhabit and the ability of those metro areas to grow in inclusive and sustainable ways.
This brief updates the 2011 report, The Re-Emergence of Concentrated Poverty, using the latest neighborhood-level poverty data from the American Community Survey for 2008 through 2012, to examine where and how poor populations have shifted at the neighborhood level. The 2008-2012 period captures the peak of the Great Recession and the sluggish recovery that followed, which as of 2012, had yet to translate to declines in the nation’s record-high poor population. These data reveal the extent to which concentrated disadvantage has grown since 2000 in the nation’s 100 largest metro areas, and how these trends have played out across city and suburban lines.3 In particular, the brief examines the changing incidence of both distressed neighborhoods, in which at least 40 percent of residents live below poverty, and high-poverty neighborhoods, where at least 20 percent of residents are poor.
For full metro area data, click here to use our interactive feature.
I. BETWEEN 2000 AND 2008-2012, THE NUMBER OF PEOPLE LIVING IN DISTRESSED NEIGHBORHOODS GREW BY 5 MILLION.
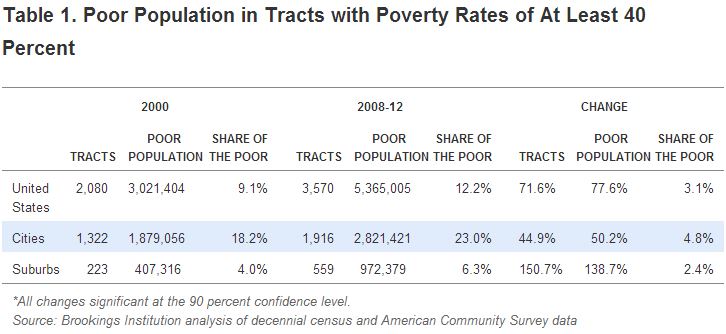
As poverty increased and spread during the 2000s, the number of distressed neighborhoods in the United States—defined as census tracts with poverty rates of 40 percent or more—climbed by nearly three-quarters (Table 1). The population living in such neighborhoods grew by similar margins (76 percent, or 5 million people) to reach 11.6 million by 2008-2012. Of those residents, 5.4 million were poor. By 2008-2012, the concentrated poverty rate—or share of poor residents living in distressed tracts—had reached 12.2 percent, up from 9.1 percent in 2000. This trend indicates that an increased share of poor individuals today face the “double burden” of not only their own poverty, but also the disadvantages of those around them.
The nation’s 100 largest metro areas are home to 70 percent of all distressed census tracts, along with similar proportions of the total population and poor residents living in such neighborhoods. That’s not surprising, considering that, historically, concentrated poverty has been a largely urban phenomenon. However, larger shifts in the geography of poverty within these metro areas during the 2000s have also made concentrated poverty an increasingly regional challenge.
II. THE SUBURBAN POOR ACCOUNTED FOR A GROWING SHARE OF RESIDENTS LIVING IN CONCENTRATED POVERTY IN THE 2000S.
The concentrated poverty rate remains highest in big cities, where almost one in four poor residents (23 percent) lived in a distressed neighborhood in 2008-2012, compared to 6.3 percent in suburbs. However, suburban communities experienced the fastest pace of growth in the number of poor residents living in concentrated poverty over this time period. Between 2000 and 2008-2012, the number of suburban poor living in distressed neighborhoods grew by 139 percent—almost three times the pace of growth in cities. Of poor residents living in concentrated poverty in the nation’s 100 largest metro areas, 26 percent lived in the suburbs in 2008-2012, up from 18 percent in 2000.
As distressed neighborhoods and their residents increased in number, so, too, did high-poverty neighborhoods—or census tracts with poverty rates between 20 and 40 percent. Research by George Galster has shown that the negative effects of concentrated poverty begin to emerge as neighborhoods pass the 20 percent poverty threshold.
In cities, the poor population living in high-poverty neighborhoods grew by 21 percent to reach 5.9 million in 2008-2012, while in suburbs it more than doubled, growing by 105 percent to reach 4.9 million. By 2008-2012, surburbs were home to nearly as many high poverty tracts as cities (4,313 versus 5,353), and almost half (46 percent) of all metro area poor residents living in high-poverty tracts lived in suburbs. Thus, a growing share of urban and suburban residents faced challenges related to concentrated disadvantage in the 2000s.
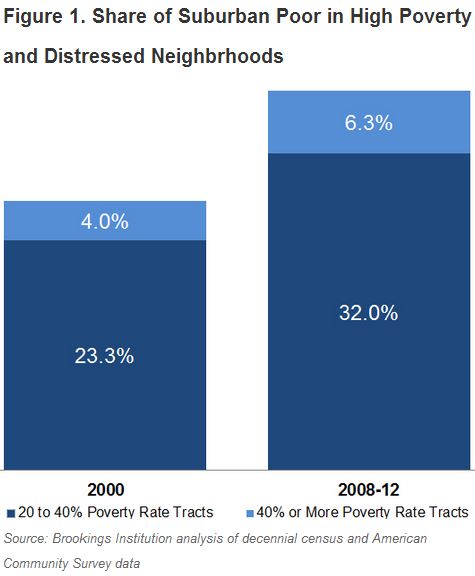
All together, the growing prevalence of high-poverty and distressed neighborhoods in suburbs meant that, by 2008-2012, 38 percent of poor suburban residents lived in tracts with poverty rates of 20 percent or more—up from 27 percent in 2000 (Figure 1).
III. SUBURBS IN THE SUN BELT EXPERIENCED SOME OF THE STEEPEST INCREASES IN CONCENTRATED DISADVANTAGE.
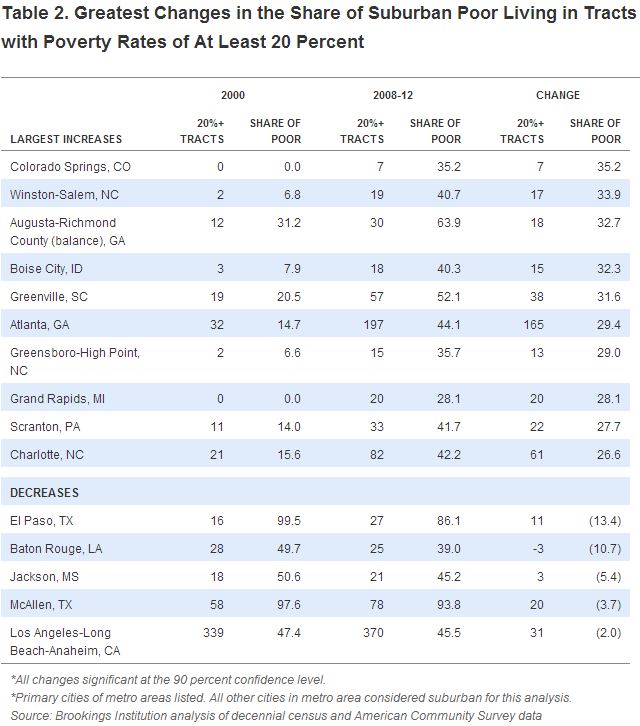
Among the nation’s 100 largest metro areas, all but three saw the number of suburban poor living in high-poverty or distressed neighborhoods grow during the 2000s, and 90 experienced an increase in those tracts’ share of the suburban poor population (for detailed metro area, city, and suburban data, see the Appendix). Southern metro areas posted some of the largest increases in the share of poor suburban residents living in such neighborhoods, including Winston-Salem, Augusta-Richmond County, Greenville, and Atlanta (Table 2).
Metro areas in which the overall suburban poor population grew quickly also tended to experience increases in the share of those individuals living in high-poverty and distressed neighborhoods.4 Seven of the top 10 metro areas in Table 2 also ranked in the top 10 for percentage change in the suburban poor population over the same period. Atlanta, in particular, stands out, as it ranked among the top three metro areas for growth in its suburban poor population during the 2000s and, at the same time, saw its number of high-poverty and distressed tracts grow from 32 to 197. The rapid rise of concentrated disadvantage in Atlanta’s suburbs (even as it continued to grow in the city) signals a particular challenge in light of research by Raj Chetty and others, which finds low rates of intergenerational mobility in the region, in part because of its already pronounced levels of racial and income segregation.
However, while all metro areas saw suburban poverty grow during the 2000s, not all saw it become more concentrated. Baton Rouge experienced a significant decrease in the actual number of poor suburban residents living in high-poverty and distressed tracts. In another four metro areas (El Paso, Jackson, McAllen, and Los Angeles), the share of poor suburban residents in high-poverty and distressed tracts fell, indicating that poverty spread out as it suburbanized.
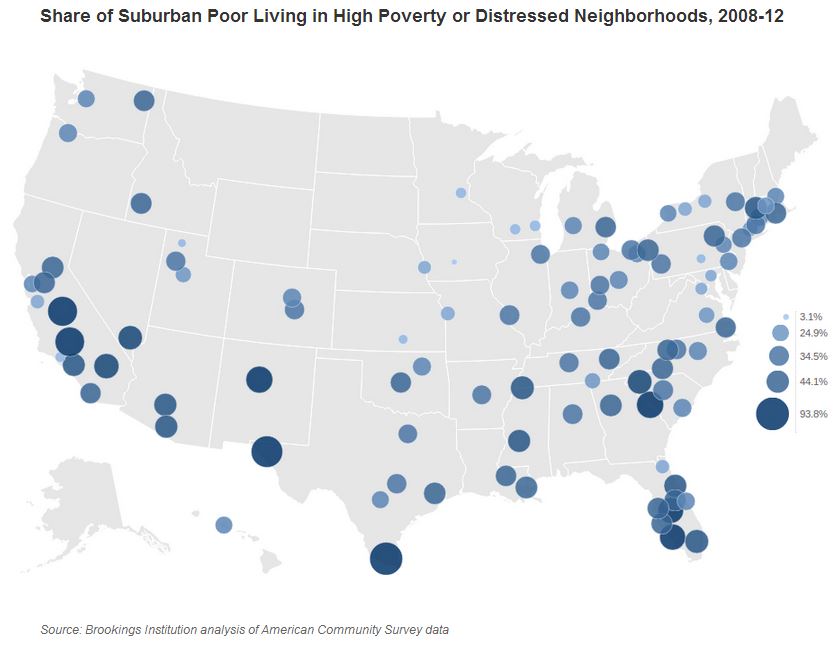
Southern and Western metro areas continued to register the highest shares of poor suburban residents living in high-poverty or distressed tracts in 2008-2012 (See map). McAllen, Texas leads the list, with a striking 94 percent of its suburban poor living in neighborhoods with poverty rates of 20 percent or higher. El Paso, Fresno, and Bakersfield also ranked highly, with more than three-quarters of their suburban poor in high-poverty or distressed tracts. And in Cape Coral, Lakeland, and Greenville, more than half of the suburban poor lived in census tracts with poverty rates of at least 20 percent.
The regions that rank highest on this measure generally do not have “suburbs” in the sense of the more conventional suburban forms found in the Northeast and Midwest. Instead, they tend to have largely rural (often unincorporated) areas surrounding geographically large cities that contain both urban- and suburban-style neighborhoods. However, they often resemble suburbs in the sense that they lack the service delivery infrastructure more common to big urban centers.
IV. DEMOGRAPHIC DIFFERENCES BETWEEN LOWER-POVERTY AND HIGHER-POVERTY SUBURBAN NEIGHBORHOODS NARROWED DURING THE 2000S.
The demographic makeup of residents in high-poverty and distressed neighborhoods differs from that found in lower-poverty suburban tracts, but the gaps between the two have narrowed as poverty—and concentrations of poverty—affected more people and places during the 2000s (Table 3). For instance, although education levels tend to be higher in lower-poverty suburban neighborhoods, the disparity with higher-poverty tracts narrowed significantly as the share of residents without a diploma dropped by double digits in tracts with poverty rates of 20 percent or higher. Likewise, homeownership rates in higher-poverty tracts increased, and the shares of teenagers dropping out of high school, working age men not in the labor force, and households receiving public assistance—all traditional measures of “underclass” characteristics—fell by statistically significant margins.5
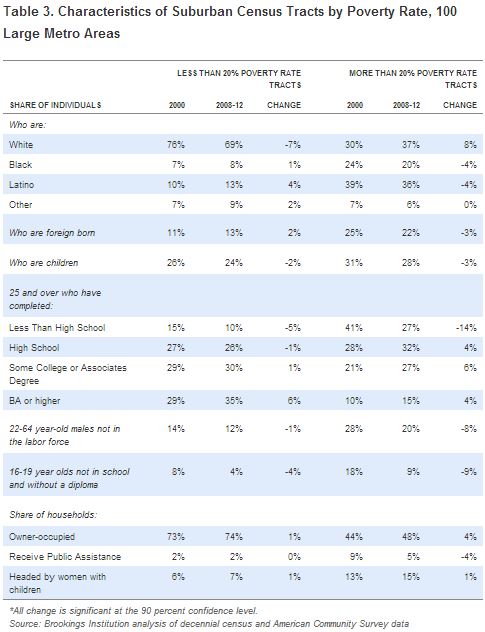
At the same time, the racial and ethnic profile of both lower-poverty and higher-poverty suburban neighborhoods changed. Lower-poverty neighborhoods became somewhat more diverse, although residents of those neighborhoods remain largely white. In contrast, higher-poverty neighborhoods became more white. However, minorities continued to make up a disproportionate share of residents in higher-poverty suburban tracts and experienced concentrated disadvantage at higher rates than white residents. In 2008-2012, 23 percent of poor white suburban residents lived in higher-poverty tracts, compared to 53 percent of poor blacks and 54 percent of poor Latinos in suburbs.
V. IMPLICATIONS
Although severely concentrated disadvantage remains a predominantly urban phenomenon, suburbs now have nearly as many poor residents in high-poverty neighborhoods as cities. If these communities are ignored, they could become areas of concentrated poverty over time. Combatting poverty in distressed neighborhoods remains a pressing priority, but policymakers, practitioners, and regional leaders should also be looking “upstream” to halt the progression of concentrated disadvantage before it crosses the 40 percent threshold. The fact that so many of these neighborhoods and residents are located in suburbs only adds to the challenge and the need for urgency, because many of these communities are ill-equipped and unprepared to deal with the needs of a growing and increasingly concentrated low-income population.
Given the limited resources at hand to address these challenges, effectively tackling the scope of today’s need necessitates more integrated and cross-cutting approaches. Policymakers and practitioners can learn from regional leaders who are finding innovative ways of making limited resources stretch further to confront the regional scale of poverty. These leaders are crafting approaches that work across urban and suburban boundaries and connect decisions around housing, transportation, workforce development, and jobs to provide stronger pathways between low-income residents and regional economic opportunity, regardless of where they live.
Spread the word