
The Huge Decline in Large Strikes
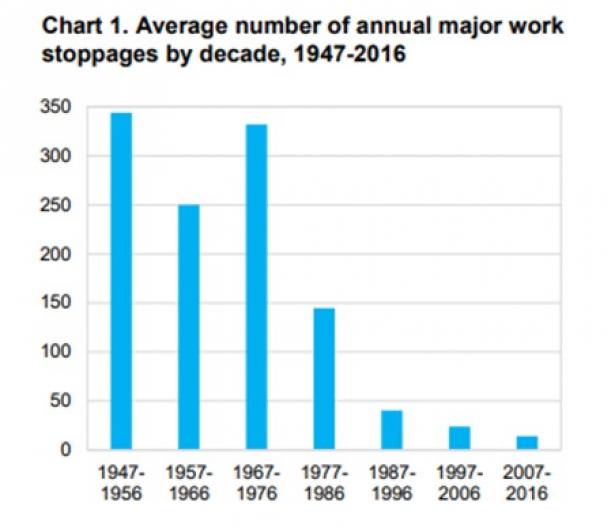
In a recent post I discussed the dramatic drop in large U.S. work stoppages (mostly strikes, but also some lockouts) over the past 70 years, as reported by the Bureau of Labor Statistics. In 2017 it published this chart which shows the decline.
The labor movement has been shrinking for decades and strikes are inherently risky, but this is an alarming drop in the number of large strikes. Though there are a number of factors contributing to this decline, this is generally interpreted as unions being increasingly unwilling to strike because of more effective employer union-busting strategies. However this data only covers work stoppages of over 1,000 workers. What does the trend for all strikes look like?
Welcome to the FMCS
It turns out there is another government agency that has data on a larger number of work stoppages. The Federal Mediation and Conciliation Service (FMCS) was established as part of the notorious anti-union Taft-Hartley Act of 1947. It’s goal, not surprisingly, is to mediate during contract negotiations between labor and management to prevent strikes. From the FMCS History Timeline:
1947: Congress enacts the Labor-Management Relations Act of 1947 (Taft-Hartley Act). The Federal Mediation and Conciliation Service is created as an independent agency of the U. S. government. The agency is given the mission of preventing or minimizing the impact of labor-management disputes on the free flow of commerce by providing mediation, conciliation and voluntary arbitration.
As part of this work, the agency collects really interesting information on mostly private sector union contracts and work stoppages. I spent some time digging through their website to find out what they have and what it means. Here’s what I think is going on.
When a contract is expiring, unions and employers are required to notify FMCS at least 30 days beforehand by submitting a Collective Bargaining Notice form. The agency then assigns a mediator to help with some of these negotiations. FMCS also collects information from the NLRB on union election wins that lead to first contract negotiations and assigns mediators to these as well. And lastly, federal, state and local governments sometimes ask the agency for help with public sector contract negotiations, and those are included in the data set. When a contract negotiation ends up in a work stoppage, FMCS collects that data.
So we have a fairly complete set of private sector contract negotiations and work stoppages per year, and a much smaller, incomplete set of comparable public sector information. In nearly 20 years of reading labor news and statistics, I have hardly ever seen anyone use or refer to this FMCS data.
See the Notes at the end for an explanation of how I got the various FMCS data and what I did for this analysis.
This Data Also Shows Work Stoppage Decline
To start, here is the FMCS data on the number of work stoppages that ended each year going back to 1984, which is all the data available on their website.
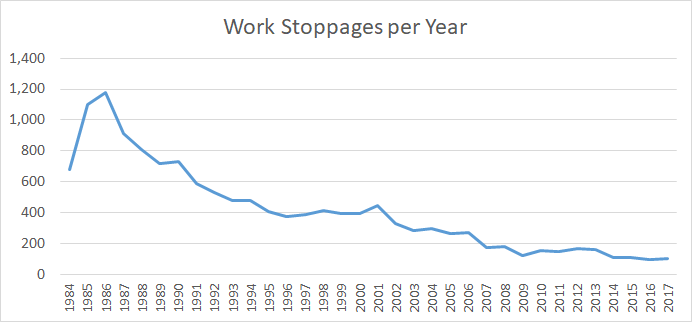
Now I’m not sure what’s up with 1984, which is very low compared to 1985 and 1986. Or perhaps those two years were unusually high. But the trend here is clear — the annual average number of work stoppages from the five year period 1984–1988 is 937/year and from 2013–2017 is 115/year, an 88% decrease. For the BLS large work stoppage data, the comparable numbers are 53 and 12, for a 77% decrease. That’s huge.
The other data I found on FMCS let’s us look a little deeper. As stated above, FMCS collects information on the contracts that are being negotiated each year. These are either a renegotiation of an existing contract or the first negotiation for a newly formed union. Each contract negotiation is a potential opportunity for a work stoppage to happen. So I was interested in what % of contract negotiations involved a work stoppage, which in most cases are strikes, so we could call this the strike rate.
Now of course strikes can also happen outside of contract negotiations, for example, union recognition strikes or walkouts that protest something happening at work. So this strike rate is not the full picture, but at least answers the question of how often contract negotiations lead to strikes. Furthermore we want to know is this strike rate declining over time?
The Strike Rate is Declining
You know where this is going. I made some data adjustments that involved primarily eliminating the small amount of public sector data, so that we have a fairly complete set of only private sector data to work with. Now we can look at the contract negotiation strike rate over time from 1996 which is the furthest back I could get all the data needed.

This is pretty fascinating. We see a strike rate of about 1.5% in the 1990s dropping to a current strike rate of close to 0.5% today. The average rate for the three year period of 1996–1998 was 1.46%, and for 2015–2017 was 0.57%, which is a 61% drop. For this entire time period, the strike rate averaged 1.1%, so for every 91 contract negotiations, about one would lead to a work stoppage. The numbers for 2017 were 100 work stoppages for 17,567 contract negotiations, which is a rate of 0.57% and one work stoppage for every 176 contract negotiations.
So Why is This Happening?
As discussed in previous posts, the conventional explanation for this decline is that the labor movement has grown smaller and weaker and thus more reluctant to strike over time. Also in the post-WW2 era, there was much more of a culture of labor militancy which has eroded over time. Reagan’s busting of the PATCO strike in 1981 started a new era of union-busting, failed strikes, and more strike reticence referred to at the time as the “PATCO Syndrome.”
Now we have a labor movement where, it may be safe to say, a majority of union members have never been on strike. This is a huge problem since striking is critical for workers to win better wages, benefits and working conditions and generally defend the interests of the working class. I recommend Reviving the Strike by Joe Burns for more about this.
But what about 2018? In my last post I discussed the great news that large strikes have risen dramatically this year to levels not seen in about 20 years. It will take more time to fully understand this recent increase and if it’s sustainable. However, the current FMCS data for 3/4 of the current federal fiscal year does not show an increase in the overall contract strike rate — right now it’s 0.50%. The Teamsters’ great win in their massive 1997 UPS strike was hailed as the end of the PATCO Syndrome, but this declining trend shows little sign of abating.
We should also raise an alternative explanation for this declining strike rate, which is that unions are getting stronger over time and thus able to win what they want in negotiations without striking. This theory is counter to just about everything I’ve seen in 20 years in the labor movement, but if someone wants to argue this case, please let me know!
The goal of the FMCS is to reduce, and if possible, eliminate work stoppages, so it must be pretty happy with this trend. This strike decline may be good for the “free flow of commerce” but it’s not good for the nation’s workers or society in general.
NOTES ON THE DATA
Because FMCS changes the way it presents data over time, and it made certain data available for different time periods, I obtained different data for various years from a number of sources.
I downloaded FMCS Work Stoppage data from FY1984–2017 in Excel and summed the number of work stoppages that ended by year. I also downloaded contract data in Excel in the form of lists of Collective Bargaining Notices from FY2005–2017, the years FMCS provides. Both sets of data can be found here. For the strike rate calculation, we also need to add NLRB union election wins, so I obtained that data for FY2005–2017 from the NLRB site — for years 2005–2007, here, and for years 2008–2017, here.
Because we want just private sector info for the strike rate calculation, I removed all the public sector data from work stoppage and collective bargaining notices. This was only about 2% of the total.
In addition, I found data on FMCS private sector cases (which include current contract renegotiations and new contract negotiations) for years FY1996–2004 in the available FMCS annual reports here. Data for years prior to 2000, the oldest report available, was included in the year 2000 report.
Also FYI, I emailed FMCS a request for older data and they responded that this is all they have.
Eric Dirnbach is a Labor Movement Researcher, Activist, Campaigner, Organizer, Educator, Writer & Socialist, based in New York City. @EricDirnbach
Spread the word