“I don’t see race,” Stephen Colbert used to say. Since the phrase was clearly a satirical device, he would regularly add punch lines such as, “People tell me I’m white, and I believe them because I just devoted six minutes to explaining that I’m not a racist.” When it comes to politics, however, many in the media and political establishment also don’t see race, and the results are not so funny. In fact, they’re deadly serious, in terms of their impact on who controls this country and what direction it heads.
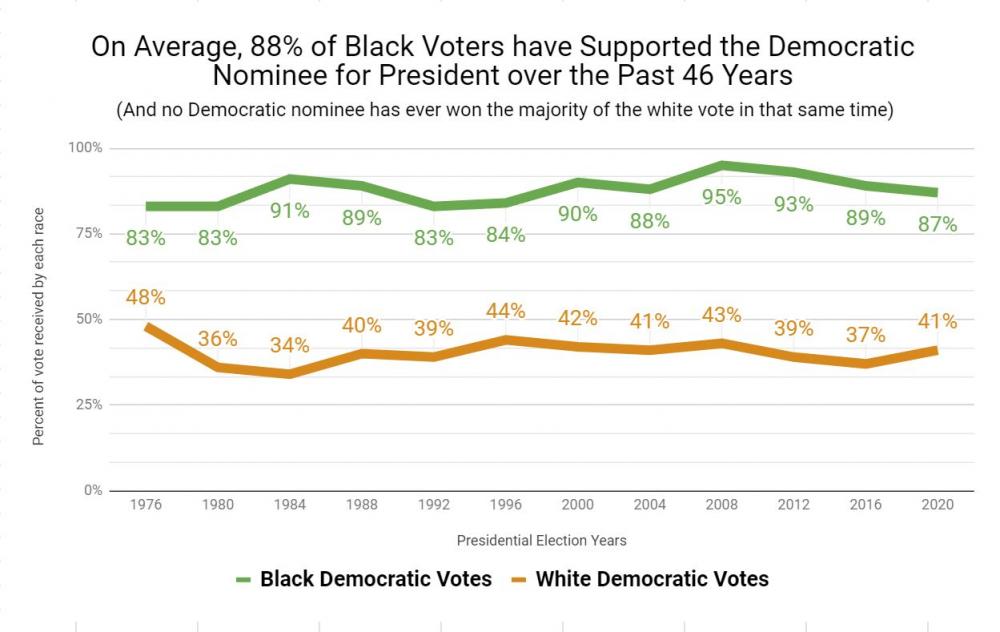
Racial identity is one of the most salient and predictive data points that exist. Exit polling in presidential elections began in 1976, and over the subsequent 44 years, voter behavior has diverged sharply along racial lines, with 88 percent of African Americans backing the Democratic presidential nominee and just 40 percent of whites siding with the Democrats.

Yet, despite this mountain of evidence affirming the centrality of race in US politics, it is essentially ignored in almost all electoral analysis, projections, strategy, and planning. Perhaps most notable is the invisibility of race at Nate Silver’s website, FiveThirtyEight, which has established a reputation as a go-to resource for data-driven forecasts about electoral outcomes. It describes its mission as using “data and evidence to advance public knowledge.”
In Silver’s 4,749-word description of his methodology of modeling and forecasting, there is just one passing reference to racial demographics. FiveThirtyEight makes available on Github nearly 200 underlying data sets that inform its work. The array of data is vast and sprawling, spanning pollster ratings, congressional election forecasts over the past several years, and, among other things, a statistical analysis of 381 paintings featured in the Bob Ross show, The Joy of Painting (56 percent of the paintings contained a “deciduous tree”). But nothing on racial demographics and how they affect election outcomes
The Cook Political Report, to its credit, does make available to its subscribers race-specific data on individual congressional districts, and Dave Wasserman often expresses awareness of racial dynamics in his commentary about various races, but Cook’s benchmark Partisan Voting Index (PVI) is decidedly race-neutral.
It’s not just journalists and pundits who ignore racial data. Many top Democratic strategists and leaders also fail, to their own detriment, to look at the electorate in living color. In the first half of 2020, the Democratic group Senate Majority PAC spent nearly $8 million in Iowa, a state where just 8 percent of the voters are people of color. It allocated nothing to Georgia, where whites are just 51 percent of the population, and where Democrat Stacey Abrams had come much closer to winning in 2018 than the Iowa gubernatorial candidate did in the same year. Similarly, the Biden presidential campaign made minimal investment in Georgia, leading Biden to marvel on election night, “We’re still in the game in Georgia, although that’s not one we expected.”
In an electorate with a cavernous racial vote gap, failing to account for that gap leads to distorted and inaccurate analyses. Specifically, it often paints a picture of a voting population that is whiter—and more conservative—than what it really is. For example, The Cook Political Report rated now–US Senator Raphael Warnock’s contest as “Lean Republican” less than a month before the November election. What happened in Georgia is that the analysts and strategists overlooked and underestimated the electoral significance of the voter turnout operation that Abrams had been building for a decade as a way to reduce and ultimately eliminate the racial vote gap in a state undergoing a demographic revolution. Since African Americans vote overwhelmingly for Democrats, applying a race-conscious lens to the Peach State’s electoral battles would have revealed that the contests were much more competitive than most analysts believed.
Given the enormous stakes of the midterm elections, there is little margin for error in assessing the competitiveness of congressional races and making smart decisions about strategy and spending over the next 12 weeks. That’s why I have spent the past several months working with a team of talented data scientists to develop the New Majority Index—the first election rating system to specifically incorporate racial demographic data in assessing and rating how competitive a given district is. In addition to the data points that PVI uses—past election results compared to the national average—the NMI goes further and deeper by analyzing a district’s racial diversity and the racial gap in voter turnout among its respective demographic groups (the full methodology of the NMI is described here).
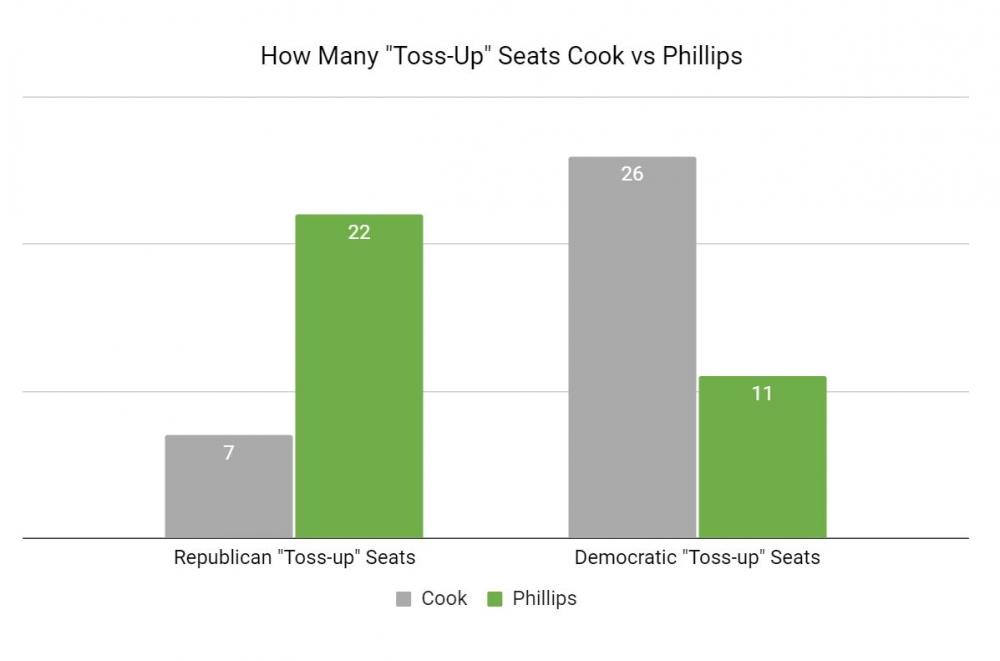
When the additional racial data points are factored in, the picture that emerges is more complete and less dire in terms of Democrats’ prospects for retaining their majority in the House. The Cook Political Report identifies 26 Democratic-held seats as vulnerable, versus just seven Republican-held seats. The NMI, by contrast, shows 11 Democratic seats are most in peril, and 22 Republican seats that could be flipped by addressing the racial voter turnout gap.

Conventional wisdom about the midterm elections misses the mark because it is based on the entirely incorrect premise that the electorate consists of one undifferentiated mass of people—“the voters”—whose political allegiances are buffeted back and forth between the political parties by macro-environmental factors such as inflation and gas prices. Voter behavior differs dramatically by racial group, however, and omitting the data on the racial composition of the electorate leads to incomplete and often inaccurate electoral predictions. The data is there for the analyzing. It’s high time that we retire the notion that there is virtue in “not seeing race.” If we want to understand and have an impact on elections, we need to open our eyes to the racial realities of American politics.
Steve Phillips is the host of Democracy in Color with Steve Phillips, a color-conscious podcast about politics. He is a senior fellow at the Center for American Progress and is the author of Brown Is the New White: How the Demographic Revolution Has Created a New American Majority. He is a regular contributor to The Nation.
Copyright c 2022 The Nation. Reprinted with permission. May not be reprinted without permission. Distributed by PARS International Corp.
Please support progressive journalism. Get a digital subscription to The Nation for just $24.95!


Spread the word