
In 2016, Trump shocked the world by tearing down the “Blue Wall” states of Michigan, Pennsylvania and Wisconsin. Quickly, a new consensus congealed around the idea that despite having lost the national popular vote, and only barely having won the Electoral College, Trump had improved Republicans’ fortunes for the foreseeable future with his unique appeal to “uneducated” voters. Suddenly, white non-college voters became the “it” constituency. For the last seven years, even as their proportion of the population shrinks, the focus on them increases, most recently with assertions that Democrats have been continuously hemorrhaging working class voters. Despite everything we know about Trump, earlier this year there were a rash of stories about how Trump could win again in 2024 despite being the only president to ever incite a deadly attack on the Capitol to overturn an election he lost. In all those stories, “working class” voters were the basis for those predictions.
Yet, since 2016, Republicans have lost 23 of the 27 elections in the five states everyone agrees Democratic hopes in the Electoral College and the Senate depend on. When Trump was sworn in, Republicans held four of those five states’ governorships, and six of the ten Senate seats. Moreover, Republicans defied history by losing nearly across the board in those states last year, the only time anything like that has happened to a Party running against such an unpopular president in a midterm.
How could all of this happen?
As the unique voter file analysis in this post confirms, it didn’t happen because very many of those who had voted for Trump in 2016 had buyers’ remorse. (Indeed, the number of 2016 voters switching sides has been historically low, and a wash as some have moved from Clinton to Trump.) Instead, Republicans have lost because of the emerging anti-MAGA majority consisting of those who did not vote in 2016. The literally unprecedented surge in new voters over the last three elections has two components: 1) young people are aging into the electorate, and are voting at a higher rate than previous generations at their age, and reject MAGA by 20-point margins, and 2) those who skipped 2016 (the so-called “Obama-none” voters) have returned. Those margins with young voters have two components – that young voters are much more diverse than the rest of the population, and young white people are far more anti-MAGA than their parents.
How has this eluded nearly all the political analysts?
The conventional wisdom prefers national surveys to election results – a demographic essentialism that insists it is more sensible to anticipate how any demographic group in, say, Wisconsin, will vote by looking at how that group is voting in the latest national survey, than it is to pay attention to how voters in that state have been casting their ballots in the last three elections. There is no room for region or vote history in this Procrustean bed.
The Emerging Anti-MAGA Majority
This post is based on the Catalist voter files for the eight elections beginning in 2008 and including 2022. All of the figures for this post are based on the 178 million people who are currently registered and have cast at least one vote between 2016 and 2022. 1 The key concepts I will be using are:
-
Vote History. The just-referenced 178 million people fall in either of these two categories:
-
Legacy voters. They cast a ballot in 2016, and are still registered to vote in the state they cast that ballot in. They constitute 70 percent of the 178 million.
-
Post-2016 voters. These are people who did not vote in 2016, cast a ballot after 2016, and are still registered to vote in the state they cast their last ballot in. Half of the Post-2016 voters are young - either Gen Z or Millennials. The other half consist of returning voters (they voted before 2016, but skipped 2016) and those who could have voted before 2016, but didn’t.
-
-
Democratic Margin. Catalist computes what they call VCI (Vote Choice Index) 2, which intends to express each voter’s partisanship. When aggregated, VCI consistently tracks Democrats’ performance in House races throughout the eight cycles. While Catalist’s figures are by far the best we have to go on, any partisanship score is still a model. For that reason, throughout, I usually express results graphically to show that the highlighted differences between groups of voters are well outside any possible margin of error.3 Whenever I say, “Democratic margin,” I have just shortened “Democratic margin based on VCI” for clarity and style.
-
Regions. Regular readers know that I think it’s essential to think of Red, Blue, and Purple states as separate groups of states – that, in fact, America is more like two separate nations (Red and Blue) with two different ways of life, and that this has defined our politics since the founding.4 In all my other writing, I define a state as Red, Blue, or Purple based on which party controls the state government.5 In this post, however, I follow the conventional taxonomy of Red, Blue and Purple states, based on states’ voting patterns over the last several cycles.
The following graph of VCI by state and vote history explains why Red states and Blue states are so consistently Republican and Democratic, respectively, in federal elections – and helps us understand the most important reason that Purple states are always up for grabs. In most Red and Blue states, the days of competitive statewide federal elections are gone. In 2018, 2020, and 2022, nearly every Senate race in a Red or Blue state rated as among the most competitive on Election Day by Cook and others was decided in favor of that state’s “color” even when the loser was an incumbent.6
Here is how the chart is organized:
-
Order. The states are arranged from the most Republican (based on VCI) – Wyoming – to the most Democratic – Vermont.7
-
Democratic Margin. The orange dot represents the Democratic margin among Legacy Voters (again, those who voted in 2016). The green dot represents the Democratic margin among Post-2016 Voters.
The two dashed lines demarcate Red states (above the line), Purple states (between the lines) and Blue states (below the second line).

This one graph serves as a powerful MRI we can use to diagnose the nation’s partisan divisions. Here are the major takeaways:
-
In every state but Hawaii, Washington, and West Virginia, Post-2016 Voters are more Democratic than Legacy voters.
-
In every Purple state but Pennsylvania (barely), Legacy voters tilt Republican and Post-2016 voters tilt Democratic. This is the defining tension in electoral dynamics today.
-
In every Blue state, both Post-2016 and Legacy voters are Democratic. (As we would expect.)
-
In every Red state but Kansas, Mississippi, Texas, and Iowa, both Post-2016 and Legacy voters are Republican. And in those four Red states, Post-2016 voters are so barely Democratic that it is of no consequence for Democrats’ electoral prospects. This shows that voting cohorts do not predict partisan ideology as much as region.
-
The partisan gaps between Post-2016 and Legacy voters are generally much narrower in Blue states than in Red and Purple states.
-
The Red states in which new voters are most Democratic are also the states that are doing as much as they can to make it more difficult for students to vote. And that’s where voter suppression has been shown to be the most easily effective. The difference in turnout if you have a polling place on campus or not, for example, is substantial.
We can now see clearly that in Purple states, Democrats can only win when enough Post-2016 voters turn out. Which is why the Red Wave never washed over those states. Had analysts wanted to look, even their go-to source for the Midterms, AP’s VoteCast exit poll, made that clear.

Voters coming of age in the last eight years are having a unique generational introduction to politics. Everybody understands the lasting partisan impact inspirational leaders like FDR, Jack Kennedy, Ronald Reagan, and Barack Obama had on the generations coming of age when they were president. But for this generation, Trump is the opposite – they are coming of age at a time when everybody around them, as well as the popular culture, loathe and ridicule him. Especially in the Blue states, where MAGA candidates dominate the uncompetitive GOP primaries, there is no exemplar of a reasonable Republican to be seen.
Furthermore, it’s crucial to understand that young people in Red states are much less Democratic than young people elsewhere, so this analysis does not suggest that by itself, this backlash will dislodge Republicans in Red states. The following graph shows the Democratic margin of each of those groups by region. In each category, those in Blue states are very Democratic, and those in Red states are either Republican or break even.

I wrote about this before the election, and after the results but before the voter files were available (Red Wave, Blue Undertow).
Making America Vote Again
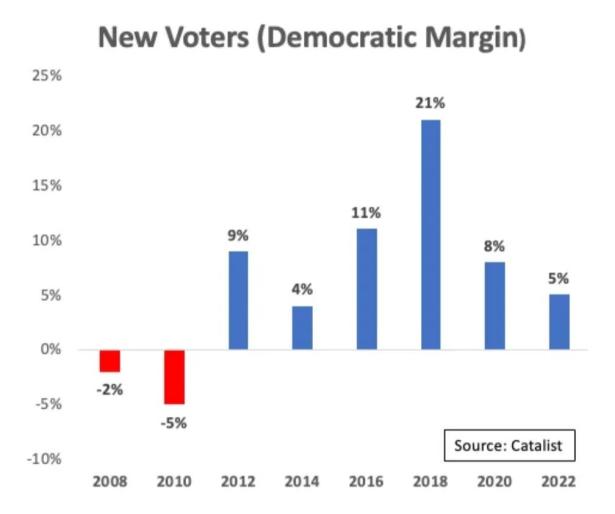
Donald Trump’s Electoral College victory triggered the greatest increase in voting in midterms in American history and nearly the greatest increase for presidential elections. Turnout in the last three elections has literally been off the charts.
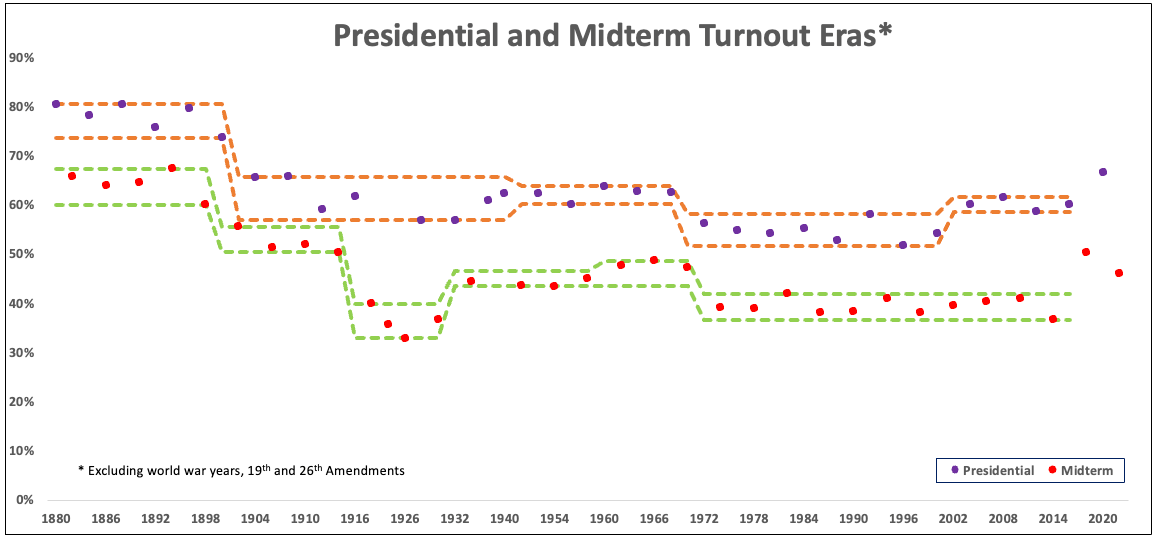
Since Reconstruction, turnout rates have varied little over long stretches of time (excluding the elections immediately after first women and then 18 year olds were given the vote, when the denominator grew suddenly, and during World War II). But every now and then, turnout rates suddenly increase or decline by more than 5 points. Whenever that has happened, it has signaled the beginning of a new “turnout era,” in which turnout stabilizes at either a higher or lower level than before.
The Three Types of Post-2016 Voters
So far, I have discussed Post-2016 Voters as a single category. But, in fact, the group has three components:
-
Young Voters. This component consists of those Gen Z and Millennials who voted for the first time after 2016. They constitute half the Post-2016 Voters.
-
Returning Voters. These are voters who had voted before 2016, but skipped 2016. As you’ll see by their partisanship, they are to a great extent the Obama-to-nobody voters. They constitute about one-fifth of the Post-2016 Voters.
-
Recent Joiners. These are voters who were old enough to vote before 2016 and didn’t, but did so after 2016. Depending on the region and demographic, these are less Democratic-leaning, and in some cases are even Republican-leaning. This group could include both those more extreme in ideology who were apathetic to the two-party candidates prior to Trump, or those who were apolitical until Trump gave them a compelling reason to be political. They constitute about 30 percent of the Post-2016 Voters.
Again, here is the Democratic margin of each of those groups by region.
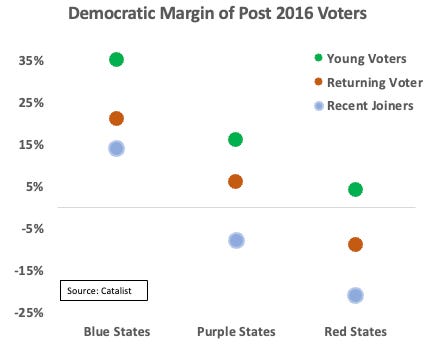
I want to draw special attention to the Recent Joiners in the Purple states, who shed light on something I was writing about in October 2020. At that time, all the polling averages had Biden much further ahead than he actually was. In this October 4, 2020 “Weekend Reading” email, I drew attention to signals in administrative records that strongly suggested that in those states, Trump was bringing new voters into the electorate. Turnout is a behavior, not an opinion, which means that behavioral signals are much more reliable than polling (Turnout RCTs). It’s also why special elections are such good signals as well.
The Blue-ing of the Electorate
Picture the 2016 electorate as a seesaw, with (net) Democrats from Blue states on one side and Republicans from Red on the other – it’s in near perfect equipoise. But then add those who have voted since 2016 – Democrats gain more from Blue than Republicans gain from Red, and Purple has moved over to the Democratic side.
Now, let’s look at how this developed over time. The first column in the chart below reflects the Democratic margin among those who voted in 2008 and are still on the file, and the last column reflects the Democratic margin among all those on the file who did not vote in 2008 but have voted at some point since then. The six columns in between show how Blue became Bluer, Red became somewhat less Red, and Purple flipped.
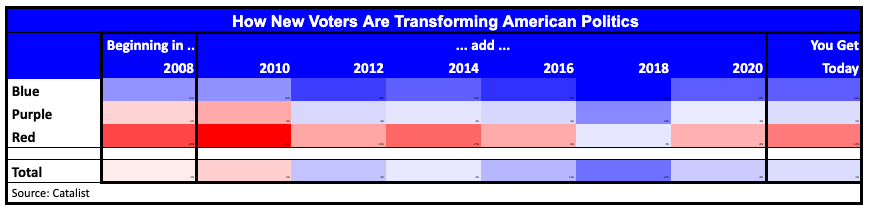
Notice that in every cycle except 2018, new voters in Red states were still net Republican. The chart above also makes clear that the Trump effect actually began with the 2016 election.
To provide some context as to how the numbers and trends of new voters have changed through the course of the period shown above, the following graph shows the number of new voters in millions (left) and their VCI Democratic margin (right) by the first year they voted in the state they live in now.8 Note that here, new voters include those who moved to their current state in that period as well as those who aged into the electorate. The 2008 election is not shown in the left panel since there is no way to separate those who voted for the first time in 2008 from those who had voted in previous elections. About half of those currently on the file voted in 2008.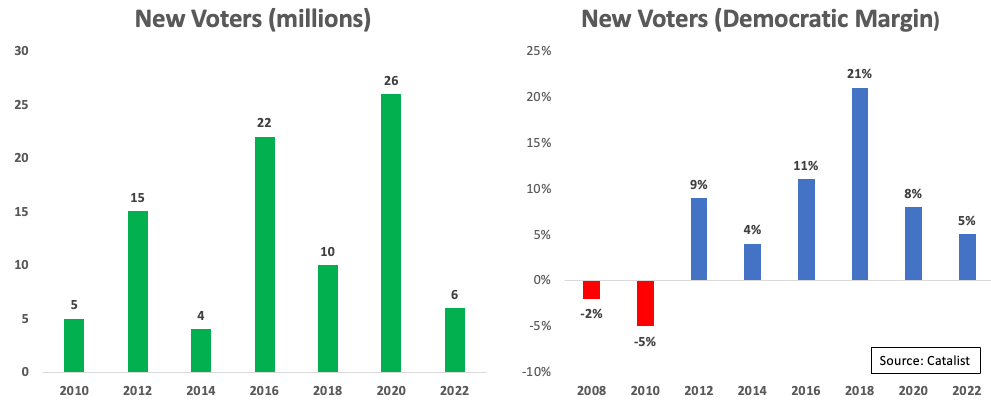
The VCI of Legacy voters who voted in 2016 is just D+1. The Post-2016 voters are D+10. But, that pattern has varied greatly by region.
![]()
The following chart breaks down Democratic partisanship by region and vote history. (How to read: 46 million voters in Blue states are identified as Democratic by VCI and 29 million as Republican, or D+22 points.) As you can see, the nationwide Democratic margin by VCI (4 points) is slightly lower than Biden’s actual margin in 2020 (4.5 points), which reflects his slight advantage over congressional Democrats in 2020 (2.7 points).
Again, Post-2016 voters in Blue and Red states still substantially favor Democrats and Republicans, respectively. On the other hand, in Purple states, new voters favor Democrats, while legacy voters favor Republicans.

Red State, Blue State
This graph shows how stable presidential preferences have been in the states over the last two presidential elections. Remarkably, not only do the states array in nearly the same order as the VCI Margin, there’s little difference from year to year in states, and the margin in nearly every state is between D+5 and R+5.

As it turns out, where you live is more strongly associated with how you vote than most of the demographic categories we hear about in election analyses. It is true that in general, we know that those with a college education are more Democratic than those without; people who live in cities are more Democratic than those who live in rural areas; women are more Democratic than men; Black, Latino, and AAPI voters are more Democratic than white voters; and that younger voters are more Democratic than older voters. But when we look at these categories in the context of which region of the country voters live in, the picture gets more complicated.
It shouldn’t be surprising that the neighborhood you grew up in, the parents you have, the schools you went to, and the general politics that you are introduced to are big factors in how you vote later in life. If you grow up in Brooklyn, no matter how old you are, you are swimming in Blue water – and the same goes for someone growing up in rural Alabama swimming in Red water. Yet, aside from the rural/urban divide, regional variation is almost never mentioned in stories about what “Americans” believe based on national surveys.
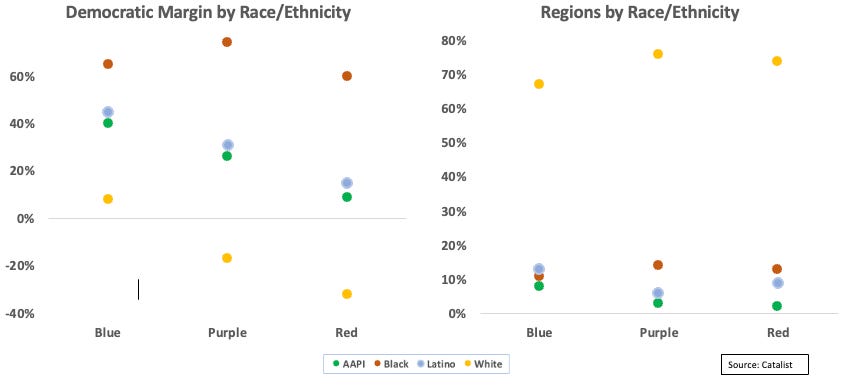
The following four graphs show Democratic margin, as well as composition of the electorate, by two of the most used demographic categories – race/ethnicity and generation. The left panels, Democratic margin, follow the same drop down across the regions we’ve seen already, but the right panels show that there is little to no regional variation in those categories. In other words, Biden didn’t win the Blue states by two dozen points while Trump won the Red states by more than a dozen points because the states are different demographically; that happened because they are fundamentally two different political ecosystems – two nations, as I’ve described them.

Yet instead of recognizing that regional divide, much has been made in recent years about the growing “diploma divide” between more-educated Democratic voters and less-educated Republican voters. But, as this next chart based on Nationscape data shows, looking at education levels by region throws a wrench into the conventional understanding about education and partisanship. Biden’s margin with white non-college voters in Blue states (0) was 13 points better than with white college voters in Red states (-13).

Here’s a thought experiment: Let’s look at the 2020 presidential map as if each race-education group in each state had voted as that group voted nationally. For example, Biden won 37 percent of the white non-college vote nationally, so we will give him 37 percent of the white non-college vote in each state, and the same for the other 9 combinations.9 If the national figures were typical of any given state instead of the average of very different figures in every state, we would expect this exercise to yield a calculated outcome not much different from the actual outcome.
But doing the calculation shows how far off these averages are from any given state. Had each race-education group voted as it did nationally in each state, Biden would have beaten Trump by an even greater Electoral College margin (344 to 194) – and the map would have been upside-down from what we would expect:

We see this sort of trend with nearly every one of the demographic categories that we typically think of as being more or less Democratic or Republican across the board. In many cases, the less-Democratic group in a Blue state (like non-college voters) is more Democratic than the more-Democratic group (like college-educated voters) in a Red state.
Conclusion
After Trump won in 2016, it was clear that Democrats had to find a path to winning more votes in the battleground states. In that panic, many argued that Democrats had to win back the alternately labeled “Obama-Trump” voters, “working class” voters, etc. But seven years later, two things are clear:
-
The 10 million people who did not vote in 2016, but have since, have rejected Trump and MAGA in every one of the last three elections by large enough margins to overcome Republicans’ original advantage in those states; and
-
Despite literally billions of dollars of effort, very few of those who defected to Trump in 2016 came back, and those basically are a wash with those who have defected from Clinton to Trump.
Thus, there’s no reason to listen to those who still think Democrats need to focus on winning back Trump-leaning voters instead of simply doing everything necessary to maintain the support of those who have already rejected Trump/MAGA and continue to turn them out, along with mobilizing those voters aging into the electorate. Nor is there any reason to listen to those who panic at any survey which shows Biden substantially behind, unless that survey also shows massive defections from people who voted for him in 2020.
Invariably, those prophesying doom unless new Trump-leaning voters are brought over rely on polling results that reflect the generalized disaffection of the moment with all politicians, rather than election results which consistently show that the voters in the key Purple states reject MAGA/Trump when the choice is clear. But those doomsayers stubbornly ignore those facts, arguing that the path to victory requires Democrats to split themselves between left and center, rather than emphasize the differences between themselves and a party advancing a fascist movement’s agenda.
(Note: This piece has been updated since its initial posting, with additional edits for clarity and new graphs on race/ethnicity and generation.)
1 Another 45 million are registered but have not cast ballots and are not included in this analysis.
2 From Catalist: “Vote Choice Index is a ranked, modeled score running from 0 to 100 estimating how likely a voter is to cast a ballot for a Democratic candidate at top-of-the-ballot races. In states with partisan voter registration, Republican or Democratic or independent status is a matter of public record. These data inform Vote Choice Index scores when they are available.”
3 For more on Catalist’s methodology, see their just-released What Happened in 2022. Fortunately, Catalist has done an unparalleled job maintaining the vote history of those registered to vote beginning with the 2008 election.
4 For more on this thesis, read Ron Brownstein’s “America is Growing Apart, Possibly for Good” in The Atlantic, or listen to my interview with Felicia Wong and Michael Tomasky on the “How To Save a Country” podcast.
5 For governing purposes, the 17 Blue states are California, Colorado, Connecticut, Delaware, Hawaii, Illinois, Maine, Maryland, Massachusetts, Minnesota, New Jersey, New Mexico, New York, Oregon, Rhode Island, Vermont, and Washington. The 27 Red states are Alabama, Alaska, Arizona, Arkansas, Florida, Georgia, Idaho, Indiana, Iowa, Kansas, Kentucky, Louisiana, Mississippi, Missouri, Montana, Nebraska, North Carolina, North Dakota, Ohio, Oklahoma, South Carolina, South Dakota, Tennessee, Texas, Utah, West Virginia, Wyoming. The six Purple states are Michigan, Nevada, New Hampshire, Pennsylvania, Virginia, Wisconsin. Note that Arizona and Georgia remain Red states in terms of governing even though they have become Purple in terms of voting for statewide office.
6 Consider 2022: Senators Bennet, Hassan, and Vance were in what were considered marginal races, but won by 14, 9, and 7 points, respectively. In 2020, Senators Gardner, Ernst, Daines, Graham, Sullivan, Cornyn and the open Kansas seat were considered competitive, but all were settled by margins of 6.6 to 12.7 points – four of those races being won by more than a 10 point margin (Gardner lost). In 2018, four Democratic senators in Red states (Nelson, Donnelly, McCaskill and Heitkamp) lost in their own party’s wave election.
7 DC is even more Democratic, but not on the chart for aesthetic reasons. (Showing it would force the axis so far to the right that the distinctions in the rest of the states would not be as clear, especially in a Substack format.)
8 This does not include people who voted in this period but are no longer on the voter file.
9 Catalist provides national estimates for five race/ethnicity groups (AAPI, Black, Latino, white and other), so there are 5 x 2 race/ethnicity-education combinations.
Michael Podhorzer writes about politics, economics, history, and democratic crises. @MICHAELPODHORZER
Subscribe to Weekend Reading.
Spread the word