

Two major shifts are occurring in U.S. workers’ attitudes toward labor unions: the rise of workers who are interested in, but unsure about, unions and an emerging generation gap between younger and older workers.
Key findings
-
Americans’ approval of unions and willingness to vote for them at their workplaces have increased although union membership has continued to drop in recent years.
-
Even more remarkable than the growth of union support has been the decline of outright opposition to unions and the rise of the “union curious.”
-
A large generational divide that was not apparent even a few years ago is emerging. Workers 30 and under are far more likely than older workers to report both support for and uncertainty about unionization.
Why this matters
The ranks of the “union curious” are large and growing. They are a pivotal group that will help determine whether the current increase in union interest will lead to sustained gains for working people.
By some measures, support for labor unions among the U.S. public is at its highest level in over half a century. In this report, we investigate this trend. Looking at multiple surveys over nearly 50 years, we find that U.S. workers today are much less likely to oppose union representation in their workplaces. Although there is evidence of greater support for unionization among workers, the most remarkable change is the much larger share of workers who report being unsure about whether they would vote for union representation. We call this trend “the rise of the ‘union curious.’” To better understand what today’s workers think about unions and where their ambivalence lies, we analyze the data from a recent, original survey of workers in five low-wage industries. Although many of the predictors of union support today mirror those from the past, we uncover a large generational divide that was not apparent even a few years ago. Workers 30 and under are far more likely than older workers to report both support for and uncertainty about unionization. The ranks of the “union curious”—workers who are open to, but uncertain about, the possibility that unionization can improve their lives—are large and growing. They are a pivotal group that will help determine whether the current increase in union interest results in sustained gains for working people. Whether the ambivalent ultimately become unionists will depend on whether unions are able to reach, educate, and organize these workers in traditional and perhaps new ways.
Introduction
U.S. workers are increasingly interested in unions, and in response, unions have stepped up their organizing activities. The number of strikes and strike threats has also risen, with over 450,000 workers striking in 2023. Several recent collective bargaining agreements secured large wage increases in industries ranging from parcel delivery to auto manufacturing, health care, and education, along with breakthroughs on nonwage issues. Is this upsurge a temporary, post-COVID-19 flash? And will it be smothered by employer resistance or lead to a sustained process of rebuilding worker power?
To answer these questions, we draw on recent survey data that we collected under the auspices of the Worker Empowerment Research Network (WERN) in 2022, and we compare the results of this survey with similar ones conducted recently and in prior decades. We first investigate the U.S. public’s attitudes toward labor unions, putting our new estimates in the context of longer-term trends in public opinion. We find that outright opposition to unionization has dramatically declined, with some suggestions that support may have increased.
However, we also find that an increasingly large share of workers are uncertain in their attitudes about unions and unionization. This ambivalence matters. For a union to organize, negotiate a contract, and strike successfully, a large majority of the relevant workplace must be actively supportive (McAlevey 2016). Most union organizers won’t “go public” with their campaign until at least 70% of the relevant workforce has signed a union interest card. We argue that these high levels of uncertainty—shown, for instance, in many workers responding that they “don’t know” whether they would vote for a union at their workplace—might arise from workers being unsure about whether unions can deliver the gains in wages and working conditions that they promise. These high rates of uncertainty are also consistent with the idea that, as unionization has declined, fewer and fewer workers have direct (or indirect, through family) experience with how labor unions and collective bargaining work. Ignoring the workers who express an ambivalent stance risks overstating the strength of union support while also masking the challenges and opportunities in the organizing environment.
We further investigate the correlates of workers’ support for, opposition to, and uncertainty about labor unions. We find that younger workers are both more supportive and more uncertain about unions compared with older workers. This is an especially important finding given young workers’ activism in recent organizing efforts at firms such as Amazon and Starbucks and nonprofits such as universities. In many areas of U.S. politics and policy, millennials and members of Gen Z have distinct attitudes (Grumbach and Hill 2022). These generations appear to be especially active in social movements and are turning out to vote at higher rates than members of earlier generations did in their 20s and 30s (though still at low rates overall). As we detail later in this report, harnessing the energy of young workers is a key challenge and opportunity for the labor movement.
Union approval
To put the data from our current survey in context, it is helpful to review prior polls that asked workers about their views of unions.1 For over 60 years, Gallup regularly asked about “approval” of labor unions, the longest such consistent series available. Figure A displays the percentage of respondents reporting that they approve of unions as well as those who don’t have an opinion in these historical Gallup polls (the remainder disapproved). For reference, we also include a line that shows the long-term decline in union density.2
For nearly the entire time Gallup has asked this question, clear majorities declared their approval of labor unions. More noteworthy is the marked and sustained increase in union approval since 2010, with support in 2022 higher than at any time since 1965. Figure A also displays another important but understudied quantity: the percentage of respondents who were unsure about whether they approve or disapprove of labor unions, an issue we will take up in some detail. In the Gallup data, this proportion hovers around 10%, but it declines to about 5% in recent surveys, perhaps reflecting increased union activism and a corresponding uptick in media coverage of labor and labor issues in recent years.
FIGURE A
Generic union approval has been rising, while union density continues to declinePercentage of responses to the Gallup survey question ‘Do you approve or disapprove of labor unions?’
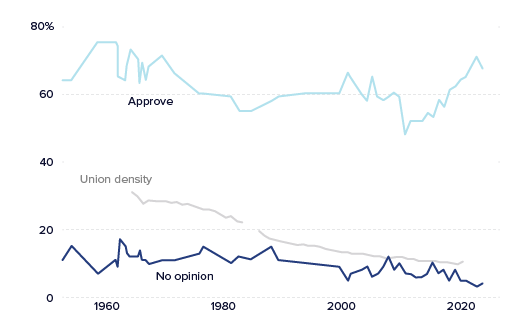
Sources: Gallup 2024 and OECD/AIAS 2021.
Encouraging as these estimates are, there are some concerns with the Gallup approach. The headline number masks important differences in union approval among various groups. For example, the Gallup numbers include both union members and nonunion members. Union members are (unsurprisingly) much more favorable to unions than nonmembers; Democrats and independents are more favorable than Republicans. But more importantly, as Figure A shows, union approval is disconnected from union membership. Indeed, the sustained increase in union approval since 2010 contrasts with the decrease in union membership rates from 12.4% in 2008 to 10.1% in 2022. It is, therefore, difficult to know exactly how to interpret trends in union approval.
Recent events suggest that workers supporting unions are putting their views into action. The National Labor Relations Board has certified and supervised more union organizing campaign elections each year since 2019, and the percentage of unions winning these elections increased each year, reaching 76% in 2022. The Cornell ILR Labor Tracker reported that the number of strikes and number of workers involved in strikes increased in each of the past three years (Ritchie, Kallas, and Iyer 2023). Some observers described the collectively bargained wage increases and benefit improvements as the “hot labor summer” (Dean 2023) and the year of the “great reset” (Greenhouse 2023). Yet, despite all this organizing activity and higher settlements in collective bargaining, the percentage of workers organized into unions has not increased. We will return to this important observation as we discuss the key lessons we take away from these developments to date.
Would you vote for a union?
If union approval is hard to interpret, are there other ways we could learn about whether nonunion workers want to be in a union? The Gallup question asks about unions in general. We turn to a regularly used survey question that instead asks workers whether they would vote for union representation at their own workplace. This is a helpful way to ask about union support rather than mere abstract approval, especially when we are concerned with building worker voice.
We found six prior national surveys that asked whether workers would vote for union representation at their jobs.3 The selected surveys include all those for which we could find the data for calculating the proportion of employed nonunion workers answering “yes,” “no,” or some variation of “don’t know.” The first dates back to the Quality of Employment (QoE) Survey in 1977 (Kochan 1979; Quinn and Staines 1977). Similar versions of the union vote question were asked of different populations using different survey modes in 1994 (Freeman and Rogers 2006), twice in 2018 (Hertel-Fernandez 2020; Hertel-Fernandez, Kimball, and Kochan 2020), 2022 (Ahlquist, Grumbach, and Thai 2023), and 2023 (Diaz-Linhart et al. 2023). Table 1 summarizes important differences across these surveys, including the survey mode and target population.
TABLE 1
Surveys asking about whether a worker will vote for union representation
| Survey | Year | Mode | Survey Partner | Target population | N= |
|---|---|---|---|---|---|
| QoE | 1977 | In-person | Michigan SRC | Employed U.S. adult workers | 1,071 |
| Freeman/ Rogers | 1994 | Phone | Princeton SRA | U.S. adults | 1,715 |
| Hertel-Fernandez | 2018 | Internet panel | YouGov | Employed U.S. adult workers | 1,030 |
| WOS | 2018 | Internet panel with phone follow-up | NORC/AmeriSpeaks | Employed U.S. adult nonexecutive workers | 3,591 |
| WERN | 2022 | Internet panel | Qualtrics | Employed U.S. adult nonexecutive workers in five industries | 2,012 |
| Diaz-Linhart et al. | 2023 | Online labor market | Prolific | Employed U.S. adult nonexecutive workers | 521 |
Note: “N=” refers to valid responses from nonunion respondents, weighted where applicable.
Figure B displays the estimated level of union support across these surveys. In contrast to past research, which tends to ignore the “don’t know” (DK) responses, we explicitly call them out here.
FIGURE B
Workers have become less resistant to unions at their workplaces over timeProportion of employed nonunion workers' responses to the survey question ‘If an election were held today to decide whether you should be represented by a union, would you vote for or against the union?’
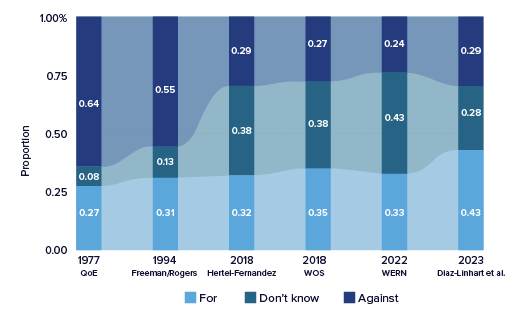
Note: Totals may not sum to 1 due to rounding.
Figure B uncovers three important facts. First, across surveys, willingness to vote for a union is substantially lower than “union approval” as reported in the Gallup data. It appears that Americans approve of unions in general, but when nonunion workers are asked whether they personally want unionization at their workplace, there is more uncertainty and weaker support.
Second, regardless of differences in the survey mode or target population, Figure B suggests that there has been large and sustained erosion of opposition to unionization among nonunion workers. In the last few years, outright opposition to unionization is a distinctly minority position in contrast to the late 1970s, when large majorities of the nonunionized stated that they would not vote for a union. In the late 1970s, opponents outnumbered supporters by nearly 2.4 to 1 if one were to look only at those expressing an opinion for or against unionization. In the 2022 Worker Empowerment Research Network survey, we see 1.4 union supporters for every worker opposed—a remarkable change in support.
Third, and most intriguing, the data also suggest that much of the opposition to unionization may have been replaced by the rise of the “union curious”—those expressing uncertainty or ambivalence—as opposed to an increase in outright support. In three of the four most recent surveys, “don’t know” is the most frequently chosen response by a substantial margin. We investigate this trend in further detail in the next section.
Workers’ uncertainty about unions
How should we interpret this increase in uncertainty about whether or not to unionize?
One possibility is respondent reluctance to answer definitively on a sensitive topic. Respondents may choose “don’t know” when in fact they lean in a particular direction.4 The evidence suggests that this is not the case with the “union curious” in these surveys. The 2017 Worker Voice Survey (Kochan et al. 2019) asked the union vote question without allowing for a “DK” option. In that survey only 3% of respondents refused to answer, suggesting that reluctance is not a major concern. When respondents were forced to choose, the Worker Voice Survey found a roughly even balance between union supporters and opponents (48% versus 52%).
Two of the surveys in Table 1 asked “DK” respondents for more information to better understand their responses. In both cases, most “DK” respondents are, in fact, legitimately uncertain about what unions do or what effects they might have on their jobs. Specifically, in the 2022 WERN survey, we probed a subset of the respondents who answered “don’t know” to the union vote question, asking whether they “leaned” toward voting for or against unionization. Over 80% of those we asked said they were actually uncertain. Similarly, Diaz-Linhart et al. (2023) asked those responding “don’t know” to provide a reason for that response and found that 70% of the “DK” responders indicated they didn’t know enough about unions or how they might affect their job to make a definitive “yes” or “no” response.
In a third survey, which is not included in Table 1, the think tank American Compass asked U.S. workers if they would vote for a union in their workplace and allowed respondents to answer “lean toward” or “lean against” unionization. They also find that opposition to unionization is the minority position and that “undecided” is the modal response among lower income workers.5 Thus the “union curious” appear to be a group that holds potential for building worker voice if they can be persuaded that unions can effectively address their concerns.
The apparent rise of the “union curious” poses important questions as we seek to understand the recent wave of union activism and the prospects for union renewal. But we need to be cautious about overstating the case. Recent national surveys tend to be administered over the internet rather than by telephone or in person. There is some suggestive evidence that survey mode may affect the frequency of “don’t know” responses (Ansolabehere and Schaffner 2014; De Leeuw and Hox 2014). It is possible that a visible response option for “don’t know” in an online survey produces greater rates of “don’t know” responses than when respondents are interacting with a survey administrator by telephone or in person. However, the 2018 Worker Organization Study (WOS) was administered by the National Opinion Research Center (NORC), which goes to greater lengths to track down and interview respondents who are online less often. The WOS survey nevertheless found “union curious” respondents at about the same rate as the other recent surveys using purely web-based samples. The prevalence of the “DK” responses in the recent surveys is underappreciated and sufficiently important to warrant further exploration.
Who are the union supporters and the ‘union curious’? Evidence from the 2022 WERN Workers’ Survey
Who are the union supporters? How do they differ from the “union curious” and those opposed to unions in their workplaces? We turn to an original survey of U.S. workers that we fielded in 2022 under the auspices of the Worker Empowerment Research Network (WERN). This survey is noteworthy because it concentrates on frontline workers in select industries in the post-COVID-19 period, whereas nearly all other similar recent surveys use broad national samples. Our survey sample allows us to drill down into five specific industries known for low wages, scheduling instability, and intense recent unionization drives: health care, hospitality, retail, telecommunications, and warehousing.6 The WERN sample also includes a variety of modules on job satisfaction, voice at work, and major problems at work (wage theft, harassment, scheduling instability, etc.). The WERN survey is, therefore, particularly well suited to understanding the “union curious.”
As a first cut, we look at responses to the union vote question across several potentially relevant demographic groups to see whether union supporters and the “union curious” tend to come from particular industries or parts of the population.
Our first key finding in the Worker Empowerment Research Network sample echoes similar recent surveys (Diaz-Linhart et al. 2023; Kochan et al. 2019): Younger workers are significantly more pro-unionization than older workers.7 Figure C makes this plain. In the WERN sample, over 40% of nonunion workers 30 and under are outright supporters of unionization, whereas only 32% of older nonunion workers hold the same view; union opposition is much stronger among older workers than among younger ones. But the “union curious”—the “DK” responders—comprise the largest share of both age groups. Over 45% of younger workers are “union curious.” Taken together, the WERN data show that younger workers are less opposed to unionization than older workers, with this age gap explained by higher levels of union support and more “union curiosity” among younger workers. This presents an interesting challenge for worker advocates: Younger workers are likely to be the most receptive to pro-union messages, but for unionization drives to succeed, both younger and older workers will need to be engaged. Younger workers will need to play important roles in persuading their older co-workers.
FIGURE C
Among the nonunionized, younger workers are more supportive of unionization at their workplaces than those over 30Proportion by age group of responses to the survey question ‘If a vote were held today on having a union represent you, would you support the union?’
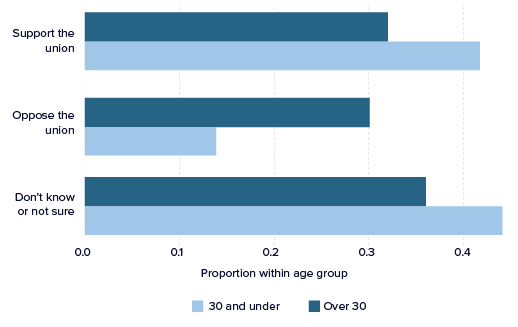
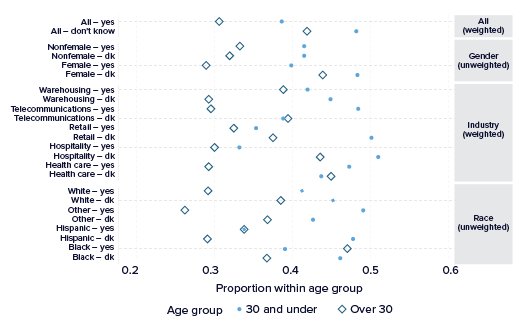
Figure D builds on the importance of age, again looking at nonunion workers in the WERN sample. The figure displays the proportions of union supporters and the “union curious” by gender, industry, and race, comparing younger (blue dots) with older (open diamonds) workers within each demographic subgroup. Across all these demographic subgroups, union support exceeds opposition. The age gap in union support (distance between the dot and diamond) is largest in telecommunications and health care. Looking at different racial groups, we see relatively high levels of union support among Black workers, whereas we see larger age gaps in union support among white workers.
But the “union curious” are a critical group. Among women of both age groups, the “union curious” are the largest group. They are an outright majority of young workers in retail and hospitality. The age gap in union uncertainty is largest among warehousing workers and Hispanic workers.
FIGURE D
Union support and uncertainty among younger and older workersProportion by gender, industry, and race
We further explored the determinants of support for unionization using the tools of regression analysis.8 In this way, we can describe how different variables relate to the likelihood that a worker will support unionization (or oppose it or report uncertainty), holding other variables fixed. Regression models can be complicated, so we present graphical displays that describe how key variables relate to responses on the union-vote survey question in our survey sample. The shaded regions present a measure of our statistical uncertainty (95% confidence intervals).
First, we confirm a common, repeated finding using our data: Bad jobs increase the likelihood of voting for the union and reduce both uncertainty and resistance to unionization. In our case, we asked respondents whether they had experienced a series of problems on the job in the last six months, ranging from underpayment to schedule instability to harassment. We count the number of problems a worker reported experiencing as a summary indicator. The left column of Figure E displays the relationships between problems at work and the likelihood of supporting, opposing, or being uncertain about unionization. A worker who experienced four different problems at work has double the expected probability of voting for a union compared with a worker who reported no major problems at work (60% versus 30%), holding other attributes fixed. A worker reporting four problems at work also had about 10 percentage points lower probability of being uncertain about unionization and was about one-third as likely to oppose unionization as a worker reporting no recent workplace problems. All of these relationships are quite large relative to statistical uncertainty.
FIGURE E
Nonunion workers with poor job quality and lack of voice are more likely to support unionizationHow problems at work and voice gap relate to support for workplace unionization among nonunion workers
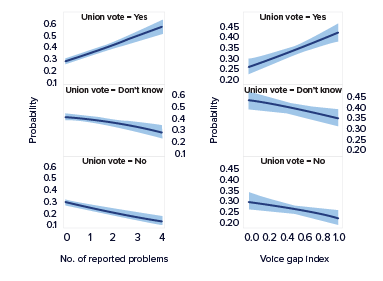
Second, a lack of voice on the job also increases support for unionization and reduces both uncertainty and opposition. To establish this, we asked respondents whether they had “the right amount,” “some,” or “no” say over a series of work conditions, including pay, benefits, scheduling, promotions, and safety. We constructed an index across all these domains to summarize the extent to which workers lacked the desired amount of voice on the job, something we call the “voice gap index.” The right column of Figure E displays the relationship between the voice gap and support for unionization. A worker with a job where she lacks voice across all domains is nearly 20 percentage points more likely to support unionization and 13 percentage points less likely to oppose it than a worker who reports “the right amount” of voice. Uncertainty about unionization also declines as the voice gap increases.
Finally, we asked workers in our sample about their beliefs about unions and expectations about how unionization might change their working conditions. By examining these responses, we get a sense of what drives the “union curious” and where more information and experience with unions might tip uncertainty into support.
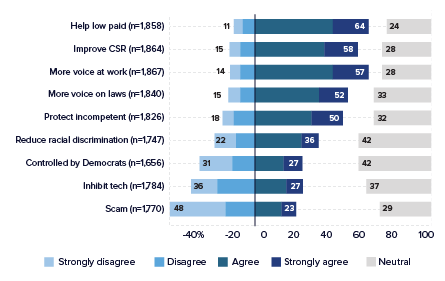
We asked respondents how much they agreed or disagreed with a variety of statements about union in general. Figure F displays the summary of the outcomes. Reassuringly, large majorities “agreed” or “strongly agreed” that unions help low-paid workers, improve corporate social responsibility (CSR), and provide more voice at work. Nevertheless, about a quarter of respondents said they were “neutral” in their beliefs on these topics, something we take to be connected to uncertainty or ambivalence. Smaller majorities agreed that unions give “people like me a voice in how laws and policies are made” and that unions “protect incompetent workers,” with roughly a third of respondents “neutral” on those topics. More concerning for unions, large pluralities are “neutral” about whether unions reduce racial discrimination or are “controlled by the Democratic party,” pointing to important ways that broader social conflict and polarization connect with uncertainty about unions.
FIGURE F
Majorities of nonunion workers have positive views of unions in general, but there are areas of substantial ambivalenceOpinions about labor unions among nonunion workers
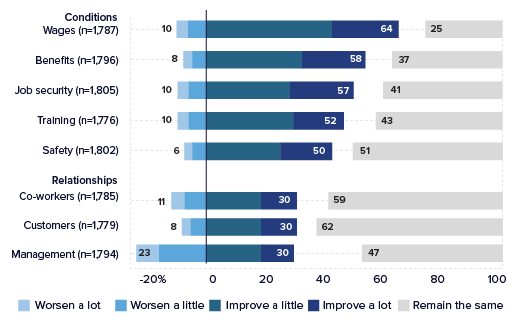
We also asked workers to report how they think unionization at their own workplace would affect working conditions and relationships. We display responses in Figure G. Consistent with past work and the responses above, majorities of workers expect that unionization would improve wages and benefits “a little” or “a lot.” But around the subject of job security, training, and workplace safety, large proportions of workers (between 41% and 51%) state that they don’t think unionization would have any effect at all. Similarly, large majorities or pluralities don’t think unionization would have any effect on workplace relationships, including relationships with co-workers. All of this suggests that there is a large population of workers with a limited understanding of what successful unions require and what they can deliver.
FIGURE G
Majorities of nonunion workers expect that unionization would improve wages, benefits, and opportunities but have minimal effects on workplace relationshipsPerceived effect of unionization on workplace conditions and relationships
Organizing the ‘union curious’
The central conclusion and the implication we draw from the increase in survey takers’ responses of “don’t know” to questions about how they would vote in a union election is this—unions have a major educational challenge to overcome if the current period will be one that produces a sustained revival and rebuilding of union density in America. Moreover, the challenge and the opportunity are greatest among young, lower-income workers. These are workers who are both more likely to vote “yes” and to vote “don’t know” or “unsure” in recent surveys.
But pursuing this targeted opportunity will require investment of substantially more resources than unions currently expend on organizing. This is not a new critique; others have stressed this point. Given the rise of the “union curious,” a clear need exists for information and education about what unions do and how to form them; this information is likely to be especially important for younger workers, even those who express general approval for unions.
It also may require new approaches to organizing and recruiting union members. The difficulties of gaining 50% majorities and then negotiating first contracts when faced with fierce and determined employer opposition cannot be overstated. The model of organizing one location at a time (e.g., one retail establishment of a giant firm; one plant of a large, multisite manufacturing firm; one warehouse of a giant distribution firm) is an equally daunting and, to date, largely unachievable task.
A number of alternative approaches to organizing have been suggested, and some are now underway. Agreements with companies to be neutral (often called neutrality agreements) in organizing campaigns, such as the one recently agreed to by Microsoft, are major steps forward. So too is the recent announcement by Starbucks and Starbucks Workers United that they have reached a framework agreement for negotiating contracts covering all the stores in the company that have organized or will organize. Labor advocates in California, New York, Minnesota, and several cities have been successful in establishing industrywide labor standards boards for fast food, health care, and nail salons and have combined these with efforts to recruit workers at the establishment level. The United Auto Workers is attempting to organize the full set of nonunion automakers. Workers at Alphabet have organized a union that speaks out on issues of concern to workers in the company without seeking the majority status needed to gain rights to collective bargaining.
Absent more alternative organizing strategies like these or others, it is difficult to see how the current upsurge in worker support for and curiosity about unions will be enough to generate a sustained process of rebuilding union density and membership across the economy. And there are substantial numbers of “union curious” workers awaiting more information, contact, and innovative organizing efforts that can address the pent-up demand for a greater voice at work. Today, the pressing question facing the labor movement and labor scholars is this—how can the curious be turned into actual union members?
John S. Ahlquist is professor of political economy at UC San Diego’s School of Global Policy and Strategy.
Jacob M. Grumbach is associate professor at the Goldman School of Public Policy at UC Berkeley.
Thomas A. Kochan is the George Maverick Bunker Professor Emeritus at the MIT Sloan School of Management and a faculty member in the MIT Institute for Work and Employment Research.
Spread the word