Introduction
An estimated 26 million Americans, or 8 percent of the U.S. population, lacked health insurance in 2023.1 While the United States still lags countries that have universal coverage, today’s uninsured rate represents a sea change from the years prior to the Affordable Care Act (ACA), when twice as many people — 49 million, or 16 percent of the population — lacked health coverage.2 This was also a time when people with preexisting conditions were out of luck when they sought to buy insurance on their own, when millions of young adults became uninsured when they graduated from high school or college, and when insurance companies in the individual market charged young women much higher premiums than young men and rarely covered maternity care.
Congress and the Biden-Harris administration significantly strengthened the ACA with a temporary boost in premium subsidies for marketplace plans during the pandemic and then extended them in 2022. These subsidies, along with restored funding for outreach and enrollment following cutbacks during the Trump administration, led to a record 21 million people enrolling in marketplace plans in 2024.3 For households with low or moderate incomes, zero-premium or otherwise low-cost marketplace plans have been a source of affordable coverage for people who lost Medicaid when the pandemic-era continuous coverage protections ended. The extra subsidies also have allowed people in high-cost employer plans to access a more affordable coverage option.
Policymakers have more to do to protect the sweeping coverage gains of the past decade and build on these gains to bring comprehensive coverage to more people. The extended premium tax credits are set to expire at the end of 2025. If Congress fails to extend the enhanced tax credits, marketplace enrollees will experience an average premium increase of $705; 4 million more people are projected to become uninsured.4 Ten states still have not adopted the ACA’s Medicaid eligibility expansion, leaving 1.5 million of some of the poorest people in the country uninsured. And many Americans with insurance are still burdened by medical debt, medical billing errors, or denials of coverage.5
In the wake of an election that could fundamentally alter health care priorities, we present findings from the Commonwealth Fund Biennial Health Insurance Survey to describe the state of Americans’ health insurance coverage in 2024.6 We answer the following questions:
- How many people experience gaps in their coverage?
- How many people have insurance but are underinsured?
- Are health care costs affecting people’s decision to get needed care and is their health suffering as a result?
- How widespread is medical debt, and how much do people owe?
For the survey, SSRS interviewed a nationally representative sample of 8,201 adults age 19 and older between March 18 and June 24, 2024. This analysis focuses on 6,480 respondents ages 19–64; analysis of the 65-and-older population, most of whom have Medicare, will be published separately. Because of a new sampling method and online questionnaire introduced in 2022, in addition to changes to some key measures in 2024, we are unable to present data on trends in responses over the years. To learn more about our survey, including the revised sampling method, see “How We Conducted This Survey.”
Survey Highlights
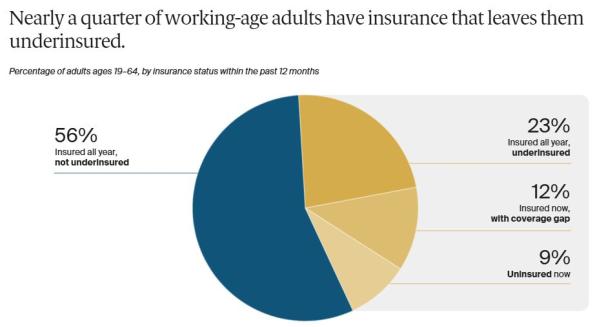
- More than half (56%) of U.S. working-age adults were insured all year with coverage adequate to ensure affordable access to care. But there are soft spots requiring policy attention: 9 percent of adults were uninsured, 12 percent had a gap in coverage over the past year, and 23 percent were underinsured, meaning they had coverage for a full year that didn’t provide them with affordable access to heath care.
- Among adults who were insured all year but underinsured, 66 percent had coverage through an employer, 16 percent were enrolled in Medicaid or Medicare, and 14 percent had a plan purchased in the marketplaces or the individual market.
- Nearly three of five (57%) underinsured adults said they avoided getting needed health care because of its cost; 44 percent said they had medical or dental debt they were paying off over time.
- Delaying care has health consequences: two of five (41%) working-age adults who reported a cost-related delay in their care said a health problem had worsened because of it.
- Nearly half of adults (48%) with medical debt are paying off $2,000 or more; half of those with debt said it stemmed from a hospital stay.
Survey Findings
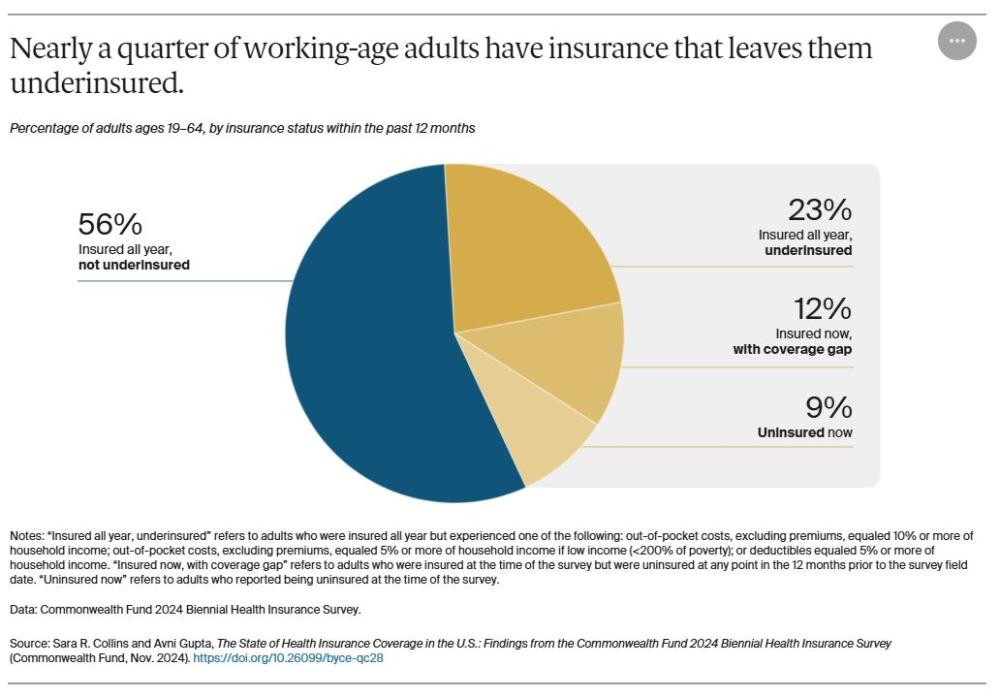
In 2024, a majority of American adults had the coverage necessary to enable access to timely and affordable care. But there remain clear areas for policy action. Nine percent of adults were uninsured at the time of the survey, 12 percent were insured but said they had been without coverage for a time during the year, and 23 percent had coverage all year but were underinsured.7
Who Is Underinsured?
For our analysis, people who are insured all year are considered to be underinsured if their coverage doesn’t enable affordable access to health care. That means at least one of the following statements applies:
- Out-of-pocket costs over the prior 12 months, excluding premiums, were equal to 10 percent or more of household income.
- Out-of-pocket costs over the prior 12 months, excluding premiums, were equal to 5 percent or more of household income for individuals living under 200 percent of the federal poverty level ($29,160 for an individual or $60,000 for a family of four in 2023).
- The individual or family deductible constituted 5 percent or more of household income.
Because out-of-pocket costs occur only if a person uses their insurance to obtain health care, we also consider the deductible when determining whether someone is underinsured. The deductible is an indicator of the financial protection that a health plan offers as well as the risk of incurring costs before a person gets health care. We do not, however, consider the risk of incurring high costs owing to an insurance plan’s other design features, such as out-of-pocket maximums, copayments, or uncovered services, since we do not ask about these features in the survey.
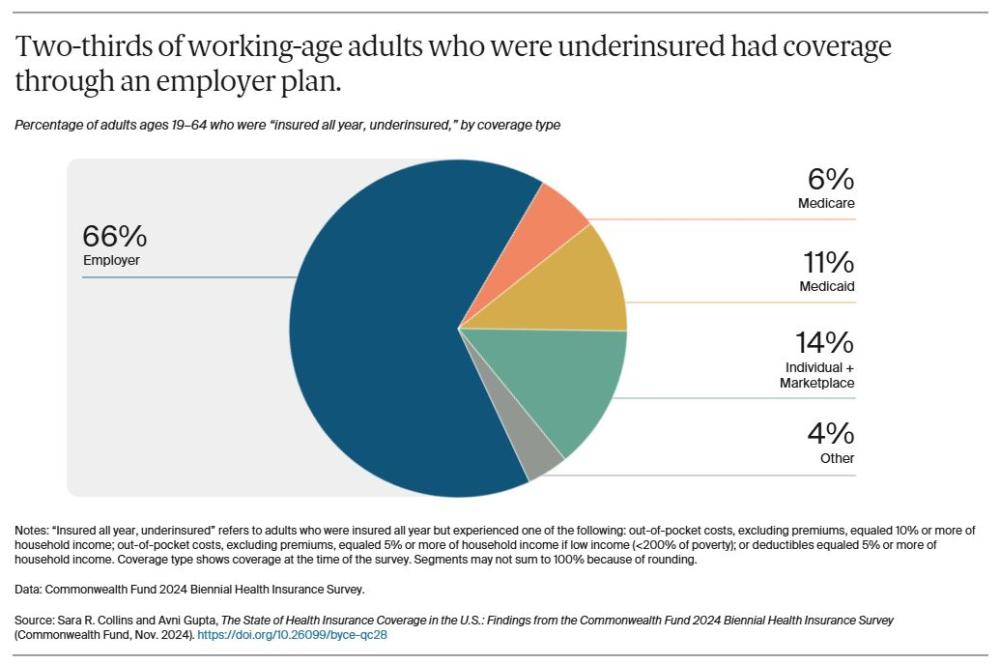
Among the insured working-age adults in the U.S. who had such high out-of-pocket costs or deductibles relative to their income in 2024 that they were effectively underinsured, the vast majority were in employer plans. About 14 percent had plans purchased in the individual market or the marketplaces, and 17 percent were enrolled in Medicaid or Medicare.
This distribution of underinsured adults reflects the predominance of employer coverage in the U.S. health insurance system and the growth of deductibles and cost sharing in those plans over time. It also shows that many people across the insurance system, both public and private, have plans that don't provide them with the cost protection needed to get timely care.
The high cost sharing in many employer, individual-market, and marketplace plans is primarily driven by growth in overall health care spending. One of the biggest drivers of this growth is the prices that health care providers charge commercial insurers and employers. These prices are the highest in the world.8 Bearing the burden of high costs are consumers, who end up paying more for their insurance and facing higher deductibles, out-of-pocket maximums, and copayments.
!function(e,n,i,s){var d="InfogramEmbeds";var o=e.getElementsByTagName(n);if(window&&window.initialized)window.process&&window.process();else if(!e.getElementById(i)){var r=e.createElement(n);r.async=1,r.id=i,r.src=s,o.parentNode.insertBefore(r,o)}}(document,"script","infogram-async","https://e.infogram.com/js/dist/embed-loader-min.js");
!function(e,n,i,s){var d="InfogramEmbeds";var o=e.getElementsByTagName(n);if(window&&window.initialized)window.process&&window.process();else if(!e.getElementById(i)){var r=e.createElement(n);r.async=1,r.id=i,r.src=s,o.parentNode.insertBefore(r,o)}}(document,"script","infogram-async","https://e.infogram.com/js/dist/embed-loader-min.js");
!function(e,n,i,s){var d="InfogramEmbeds";var o=e.getElementsByTagName(n);if(window&&window.initialized)window.process&&window.process();else if(!e.getElementById(i)){var r=e.createElement(n);r.async=1,r.id=i,r.src=s,o.parentNode.insertBefore(r,o)}}(document,"script","infogram-async","https://e.infogram.com/js/dist/embed-loader-min.js");
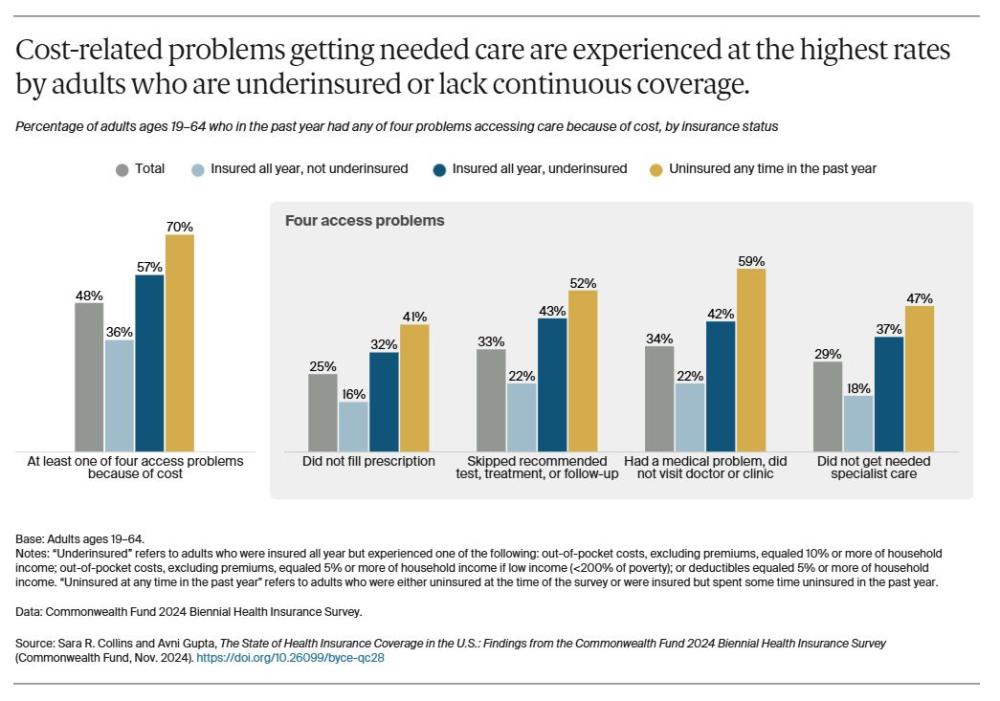
Being uninsured or underinsured are barriers to getting timely health care. Fifty-seven percent of working-age adults who were underinsured and 70 percent of those who lacked continuous coverage said they did not get needed care because of the cost. This included not going to the doctor when sick, skipping a recommended follow-up visit or test, not seeing a specialist when recommended, or not filling a prescription.
Forty-two percent of adults who didn’t get care because of cost said it was for an ongoing health condition, 29 percent said it was for a new health problem, and 28 percent said it was for both (data not shown).
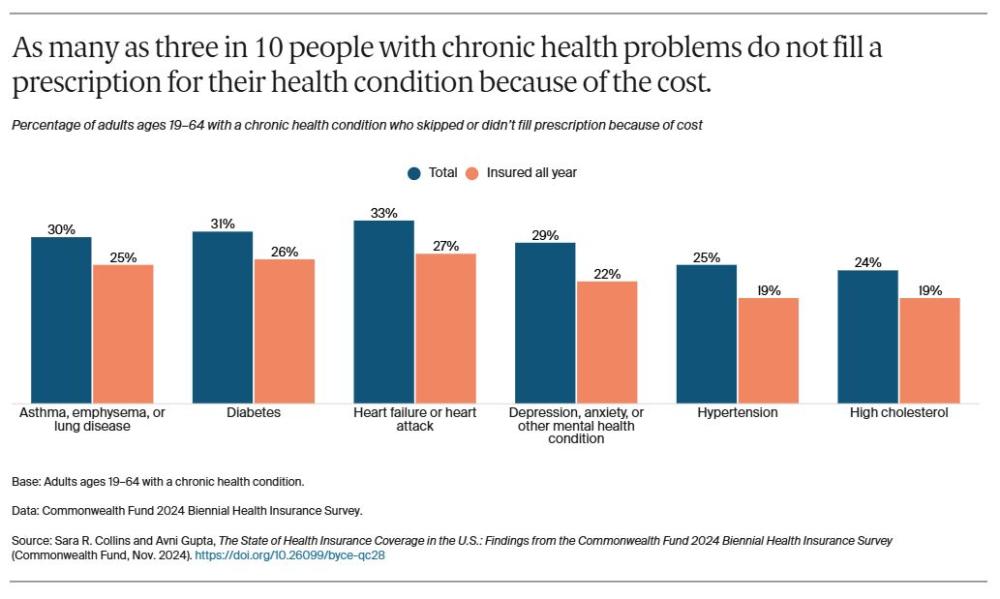
As many as three in 10 people with a chronic health problem, such as diabetes, said that the costs for prescription drugs to treat the problem had caused them to skip doses or not fill the prescription at all. This includes about one-quarter of adults who had health insurance for the full year.
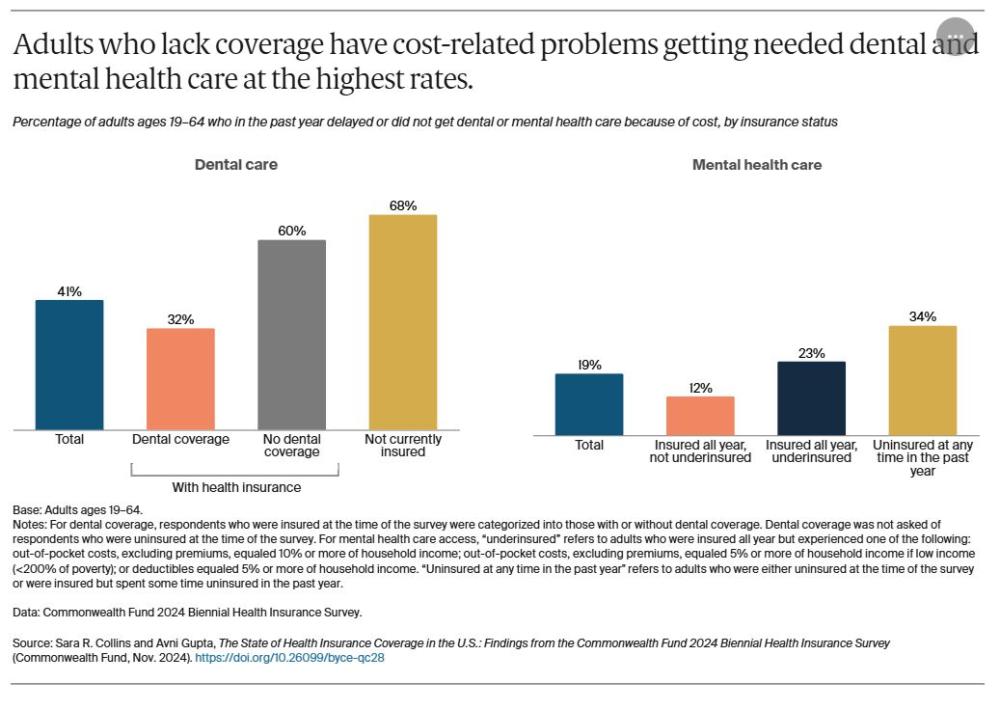
Many Americans lack comprehensive dental coverage. Many employers that offer dental coverage provide it as a supplemental benefit, which can be limited to routine preventive care. In our survey, 41 percent of adults reported delaying or not getting dental care because of the cost.
Three-quarters of insured adults said they had dental coverage (data not shown), and the survey’s findings show that it made a big difference in their ability to get care. Insured adults who did not have dental coverage reported cost-related delays in getting care at nearly the same rate as those who lacked any health insurance.
One in five respondents said they had delayed getting mental health care because of cost, with higher rates of delayed care reported by those with inadequate coverage. The ACA requires health plans offered in the individual and small-group markets and the marketplaces to cover behavioral health care, and most employers cover it.9 The Mental Health Parity and Addiction Equity Act requires health plans that include these services to cover them on par with their coverage of other health services. Enforcement, however, is uneven, and behavioral health provider shortages have made it difficult for many people to get timely access to care.
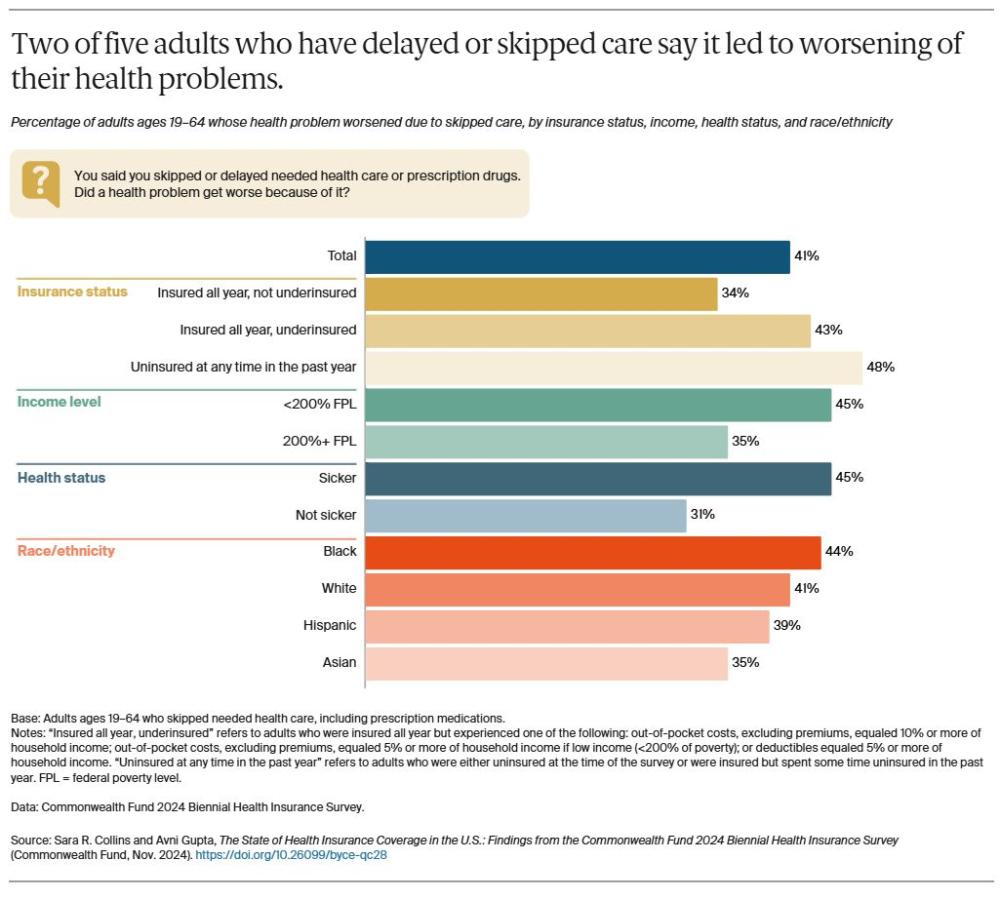
Fear of incurring expenses for care they can’t afford is endangering the health of many Americans, even those who have insurance. Two of five adults who reported they had delayed or skipped getting needed care because of costs said a health problem had gotten worse as a result. People in poor health or dealing with a chronic health condition reported at among the highest rates that a health problem had worsened because of delayed care.
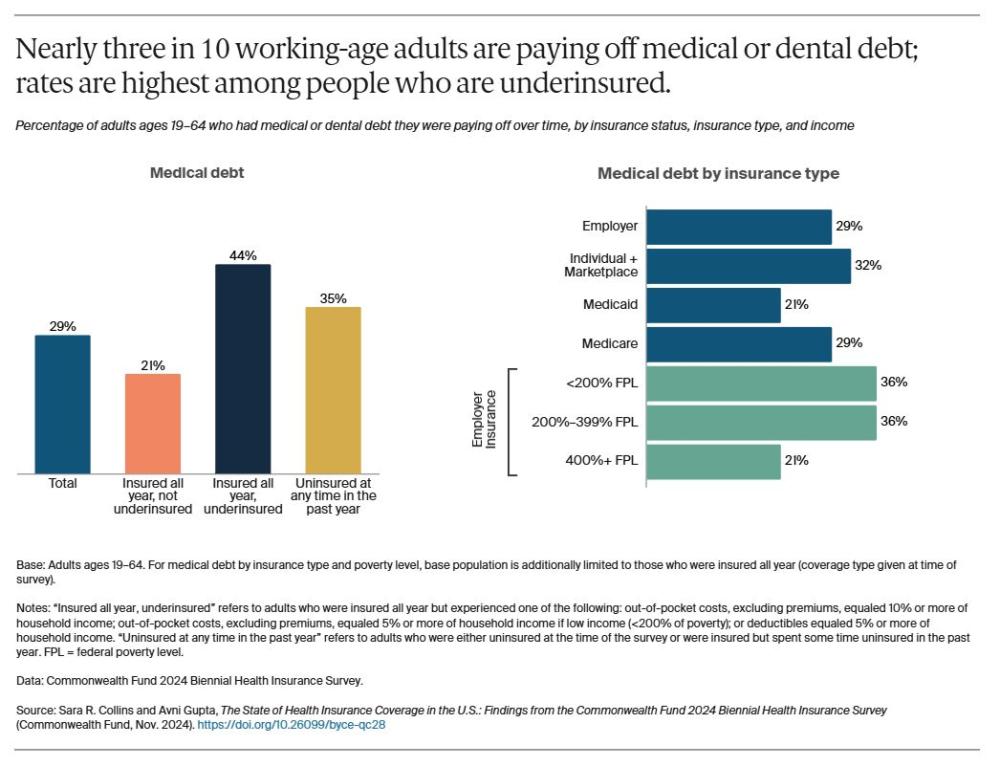
Costs prevent many Americans from seeking health care, and those who do get care often leave the hospital or doctor’s office with bills they cannot pay. We asked people whether they had medical bills or debt of any kind that they were paying off over time, including dental, home health, or long-term care. Three in 10 reported they were paying off medical debt, with underinsured adults reporting this at the highest rate.
Of survey respondents with employer coverage, those with low and moderate income reported paying off medical debt at higher rates than those with higher income. People in employer plans and the individual market and marketplaces reported significantly higher rates of medical debt than people who had Medicaid.
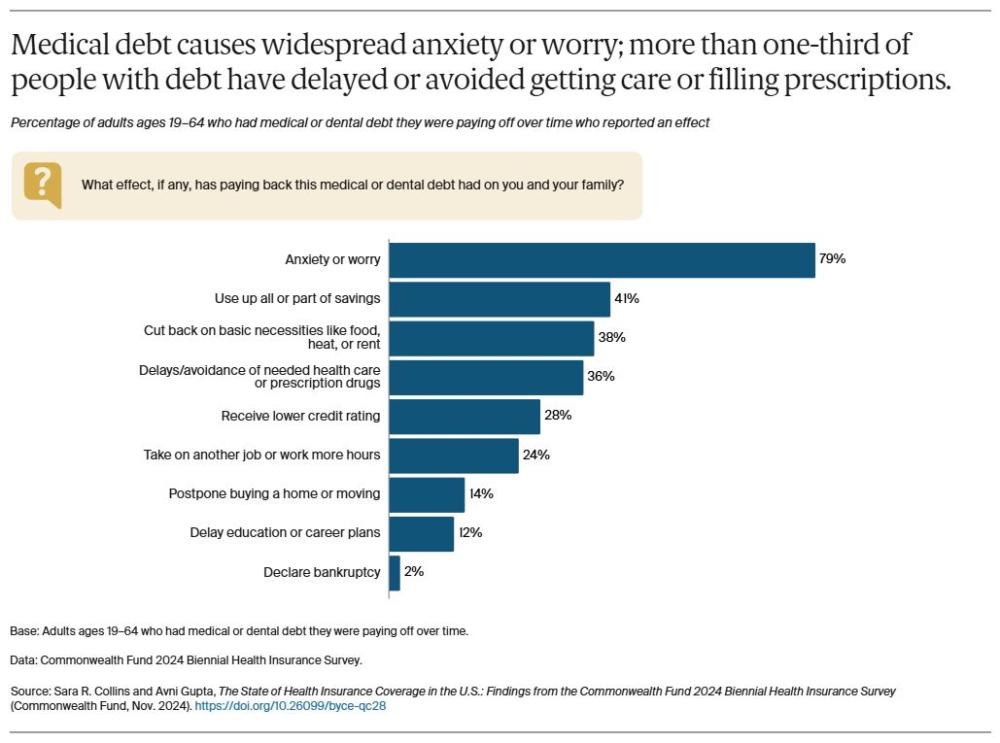
Medical debt can harm the health and well-being of entire households. More than one-third of those reporting medical debt within their household said it had caused a member to delay or avoid getting needed health care or prescription medications. A similar share said they were forced to cut back on basic necessities like food, heat, or rent, while a quarter said they took on another job or worked more hours. More than three-quarters of people with medical debt said it made them anxious or worried.
Medical debt can have lasting financial consequences. Two of five adults reporting debt said they had used up all or part of their savings to pay it off, and 28 percent said they received a lower credit rating because of it.
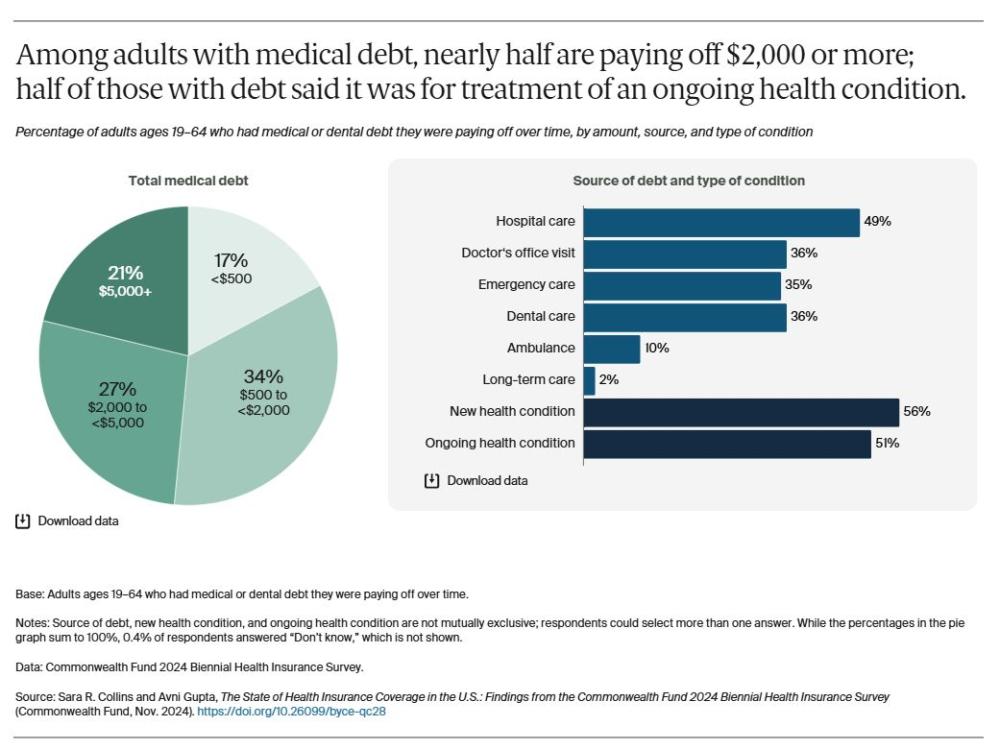
Most people who have medical debt carry a lot of it: 83 percent reported total debt loads of $500 or more, and nearly half said they were paying off $2,000 or more. This means an estimated 24 percent of all U.S. working-age adults are carrying medical debt of more than $500, and 14 percent are saddled with $2,000 or more.
While media reports frequently highlight unexpected health care events and emergency room visits that leave people with lots of medical bills, our survey findings suggest that the source of much debt is simply care for chronic health problems. About half of adults with debt said it stemmed from treatment they received for an ongoing condition. Hospital care is the most frequently cited source of medical debt.
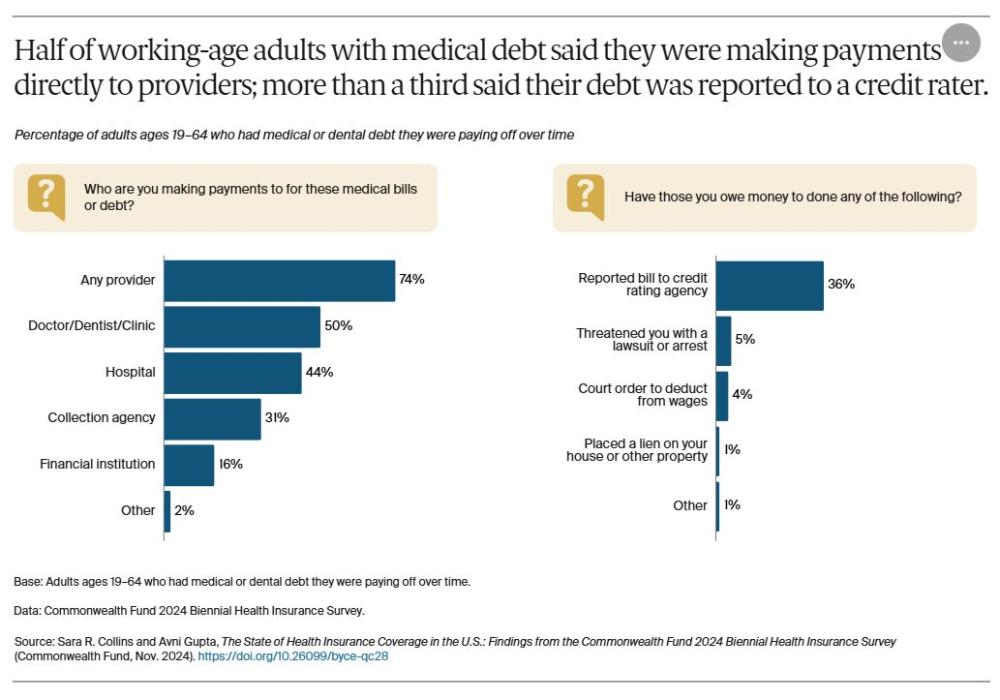
National estimates of the medical debt that Americans owe are based mainly on debt that goes to collection agencies who then report the debt to a consumer reporting agency. In 2023, an estimated 15 million people had $47 billion of medical debt on consumer credit reports.10 This is despite changes that the three largest nationwide credit reporting agencies implemented in July 2022, including the removal of initial medical debt balances of less than $500. Our survey shows these estimates understate the medical expenses people are paying off over time: three-quarters of respondents with medical or dental debt said that they were making some or all of their payments directly to health care providers.
More than a third of people with medical debt said the institutions they owe money to had reported their bill to a credit rating agency. Only small percentages of people said they had been threatened with a lawsuit, had their wages garnished, or had a lien placed on their property.
How to Bring Better Coverage to More Americans
The United States has made considerable gains in health insurance coverage since the Affordable Care Act’s passage, but more work is needed to cover the remaining uninsured, eliminate gaps in coverage, and ensure that all health insurance does what it’s supposed to: enable people to get health care when it’s needed, without fear of incurring debt.
The findings of this survey point to two areas of policy change needed to cover more people with good insurance. Below are some options for policymakers to consider.
Covering All Americans, and Keeping Them Covered
Permanently extend the enhanced marketplace premium tax credits set to expire in 2025. These larger tax credits, first passed by Congress in 2021 and then extended in 2022, have dramatically lowered household premiums and led to a record 21 million people enrolled in the marketplaces in 2024. If Congress fails to make these enhanced subsidies permanent, marketplace premiums will spike and enrollment will fall, increasing the number of uninsured. For example, the Urban Institute estimates that without the enhanced tax credits, annual premiums in 2025 would be $387 more for the lowest-income enrollees, who now pay nothing for their premiums, and nearly $3,000 more for individuals with incomes of $60,240 or more.11 They estimate 4 million more people will become uninsured without these enhanced tax credits.12
Fill the Medicaid coverage gap. Congress could create a federal fallback option for Medicaid-eligible people in the 10 states that have yet to expand their program. One option is to expand marketplace eligibility to include people in the coverage gap coupled with an extension of the enhanced premium tax credits to ensure zero-premium plans and no cost sharing.13 Such an approach could cover the estimated 1.5 million uninsured people in the coverage gap in those states.14
Create a longer period of continuous Medicaid eligibility. Disruption in Medicaid coverage because of eligibility changes, administrative errors, and other factors can leave people uninsured and unable to get care. Congress could apply the lessons of the pandemic and give states the option to maintain continuous enrollment eligibility for adults for 12 months without the need to apply for a waiver — just as has been done for children in Medicaid and the Children’s Health Insurance Program.15
Create an autoenrollment mechanism. Research shows that many uninsured people are eligible for Medicaid or subsidized marketplace coverage. By allowing autoenrollment in comprehensive health coverage, Congress could move the nation closer to universal coverage.16
Improving Insurance Design and Protecting Consumers from Medical Debt
Lower deductibles and out-of-pocket costs in marketplace plans. Congress could extend cost-sharing reduction subsidies to middle-income people and change the benchmark plan in the ACA marketplaces from silver to gold, which offers better financial protection.17 These policies would save households $4.8 billion and decrease the number of uninsured by an estimated 1.5 million.18
Adjust premiums and cost sharing based on employee income. In 2022, just 10 percent of employers with 200 or more employees had programs to reduce premium contributions for lower-wage workers; only 5 percent had similar programs to reduce cost sharing.19
Protect consumers from being financially ruined by medical debt. In June 2024, the Biden-Harris administration released a new proposed rule to prohibit medical debt information from appearing on consumer credit reports. Earlier, it had taken steps to ensure greater scrutiny of providers’ bill collection tactics, among other actions. Many states have passed legislation to relieve medical debt, such as strengthening standards to ensure patients have access to hospital financial assistance programs, banning aggressive collection activities by hospitals, and prohibiting or capping interest on medical debt.20 North Carolina has implemented an innovative debt relief program that provides enhanced Medicaid reimbursements to participating hospitals.21 All eligible hospitals in the state are participating and agree to relieve outstanding debt dating back to 2014 for Medicaid beneficiaries and other low-income patients, among other measures.
Lower health care cost growth. The relentless growth in the cost of health care, driven primarily by the prices that commercial insurers and employers pay to providers and for pharmaceuticals, is at the root of the nation’s medical debt and affordability crisis in commercial insurance. Ultimately, private payers will need to do a better job of leveraging their purchasing power to slow cost growth in commercial markets. Federal and state policymakers could help, for example, by creating new public plan options.22
HOW WE CONDUCTED THIS SURVEY
The Commonwealth Fund 2024 Biennial Health Insurance Survey was based on an integration of stratified address-based sample (ABS) with SSRS Opinion Panel, and prepaid cell sample. This sampling design was first introduced for the 2022 Biennial Health Insurance Survey and was a shift from our historically exclusive use of phone administration via stratified random-digit dial (RDD) phone sample. Similar to the 2022 survey, we included all adults age 19 and older and made refinements to how we calculate poverty status and measure underinsurance. Collectively, these changes affect year-to-year differences in our trend questions. For that reason, similar to 2022, this year’s brief does not report trends.
The 2024 Biennial Health Insurance Survey was conducted by SSRS from March 18 through June 24, 2024. The survey consisted of telephone and online interviews in English and Spanish and was conducted among a random, nationally representative sample of 8,201 adults age 19 and older living in the continental United States. A combination of address-based, SSRS Opinion Panel, and prepaid cell samples was used to reach people. In all, 4,742 interviews were conducted online or on the phone via ABS, 2,706 were conducted online via the SSRS Opinion Panel, and 753 were conducted on prepaid cell phones.
The sample was designed to generalize to the U.S. adult population and to allow separate analyses of responses from low-income households. Statistical results were weighted in stages to compensate for sample designs and patterns of nonresponse that might bias results. The first stage involved applying a base weight to account for different selection probabilities and response rates across sample strata. In the second stage, sample demographics were poststratified to match population parameters. The data are weighted to the U.S. adult population by sex, age, education, geographic region, family size, race/ethnicity, county population density, civic engagement, and frequency of internet use, using the 2023 Current Population Survey (CPS), the 2022 Census Planning Database, the 2021 CPS Volunteering and Civic Life Supplement, and Pew Research Center’s 2023 National Public Opinion Reference Survey (NPORS) as benchmarks.23
The resulting weighted sample is representative of the approximately 253.5 million U.S. adults age 19 and older. The survey has an overall maximum margin of sampling error of +/– 1.5 percentage points at the 95 percent confidence level. As estimates get further from 50 percent, the margin of sampling error decreases. The ABS portion of the survey achieved a 10.5 percent response rate, the SSRS Opinion Panel portion achieved a 3.4 percent response rate, and the prepaid cell portion achieved a 2.3 percent response rate.
This brief focuses on 6,480 adults ages 19–64. The resulting weighted sample is representative of approximately 196.4 million U.S. adults ages 19–64. The survey has a margin of sampling error of +/– 1.7 percentage points at the 95 percent confidence level for this age group.
Refinements to Poverty Status
A respondent’s household size and income are used to determine poverty status.
Beginning with the 2022 Biennial Health Insurance Survey, we use a survey question where respondents provide their household size via an open-ended numeric response. This allows us to use the full U.S. Federal Poverty Guidelines up to 14 household members. Previously, household size was determined by combining information about marital status and the presence of dependents under age 25 in the household, which resulted in a maximum possible household size of four persons.
Starting this year, we asked respondents to indicate their exact annual household income ranging from $0 to $999,997. For people who could not or refused to provide their exact income, we asked them to select an income range. We then generated random exact incomes for each respondent who did not provide an exact income themselves but did provide a range. Respondent incomes within each income range were assumed to be uniformly distributed and were assigned using a standard increment between each income based on the size of the income range and the number of respondents with incomes in the range. To create a fully populated income variable, we used hot deck imputation to populate exact incomes for respondents who did not answer the income range questions.
The more precise household size and exact incomes were used to determine poverty status for all respondents according to the 2023 U.S. Federal Poverty Guidelines.
Underinsured adults are individuals who are insured all year but report at least one of three indicators of financial exposure relative to their household income: out-of-pocket costs, excluding premiums, are equal to 10 percent or more of household income; out-pocket-costs, excluding premiums, are equal to 5 percent or more of household income if low income (less than 200% of the federal poverty level); or their deductible is 5 percent or more of household income. This year we asked and reported family-level deductible for those who indicated family-level coverage in their health plan. Historically, we asked and used only per-person deductible for all respondents.
For each of the three underinsurance component measures, there are borderline cases for which the income or deductible ranges provided were too imprecise to categorize the respondent into “less than” or “more than” the stated underinsurance component. Previously, the Fund redistributed borderline cases for each component by conducting a 50/50 split into the “less than” and “more than” categories. We refined our approach in 2022. We leveraged the imputed exact incomes generated to determine poverty status to categorize borderline cases. In 2024, as mentioned above, we also collected exact income data directly from respondents, so we used either the reported exact income or the imputed exact income to generate the underinsurance component variables.
Additionally, for those respondents who provided deductibles, we duplicated the methodology used to determine random exact incomes to compute random exact deductibles. These exact deductibles were compared to exact incomes to categorize borderline cases for the component of underinsurance that relates deductible to income.
Estimates of U.S. Uninsured Rates
ACKNOWLEDGMENTS
The authors thank Robyn Rapoport, Rob Manley, and Paula Armendariz of SSRS; and Tony Shih, Corinne Lewis, Arnav Shah, Chris Hollander, Paul Frame, Jen Wilson, Kristen Kolb, Carson Richards, and Evan Gumas, all of the Commonwealth Fund.
NOTES
- Katherine Keisler-Starkey and Lisa N. Bunch, Health Insurance Coverage in the United States: 2023, Current Population Reports (U.S. Census Bureau, Sept. 2024). ↩
- Robin A. Cohen, Brian W. Ward, and Jeannine S. Schiller, Health Insurance Coverage: Early Release of Estimates from the National Health Interview Survey, 2010 (Centers for Disease Control and Prevention, National Center for Health Statistics, June 2011). ↩
- Jeanne Lambrew, Enhanced ACA Marketplace Tax Credits Worked — And Shouldn’t Be Eliminated (The Century Foundation, Aug. 2024). ↩
- Jameson Carter et al., “Four Million People Will Lose Health Insurance if Premium Tax Credit Enhancements Expire in 2025,” Urban Wire (blog), Urban Institute, Nov. 14, 2024; and Jared Ortaliza et al., Inflation Reduction Act Health Insurance Subsidies: What Is Their Impact and What Would Happen if They Expire? (KFF, July 2024). ↩
- Sara R. Collins, Shreya Roy, and Relebohile Masitha, Paying for It: How Health Care Costs and Medical Debt Are Making Americans Sicker and Poorer — Findings from the Commonwealth Fund 2023 Health Care Affordability Survey (Commonwealth Fund, Oct. 2023); and Avni Gupta et al., Unforeseen Health Care Bills and Coverage Denials by Health Insurers in the U.S. (Commonwealth Fund, Aug. 2024). ↩
- Sara R. Collins and Christina Ramsay, "What’s at Stake in the 2024 Election for Health Insurance Coverage" (explainer), Commonwealth Fund, Sept. 30, 2024. ↩
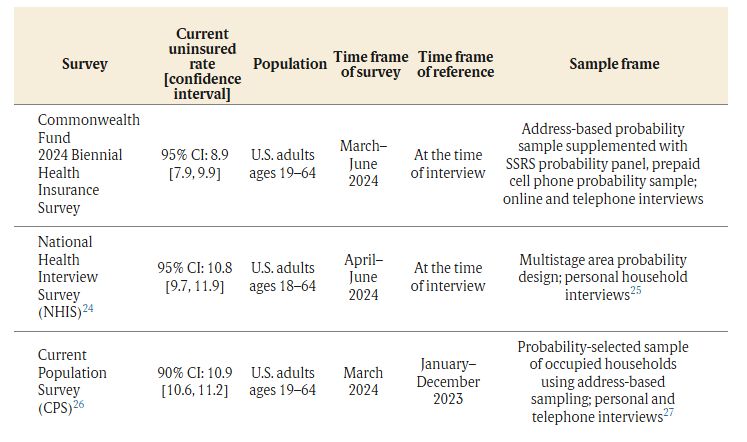
- Our uninsured estimate is lower than the rate reported by the Centers for Disease Control and Prevention for this age group in the second quarter of 2024 (10.8%, with a confidence interval of 9.7% to 11.9%) and recently by the U.S. Census Bureau for January–December 2023 (10.9%, with a 90% confidence interval of 10.6% to 11.2%). (See “Estimates of U.S. Uninsured Rates” for detail.) Smaller surveys like ours can provide leading indications of the overall direction of U.S. uninsured rates; federal surveys, given their large sample sizes, will always provide the most reliable point estimates. It’s important to note that because our estimated uninsured rate has a margin of error of +/− 0.95 percentage point, the true estimate falls between 7.9 percent and 9.9 percent. ↩
- Gerard F. Anderson, Peter Hussey, and Varduhi Petrosyan, “It’s Still the Prices, Stupid: Why the U.S. Spends So Much on Health Care, and a Tribute to Uwe Reinhardt,” Health Affairs 38, no. 1, (Jan. 2019): 87–95. ↩
- JoAnn Volk, Emma Walsh-Alker, and Christina L. Goe, Enforcing Mental Health Parity: State Options to Improve Access to Care (Commonwealth Fund, Aug. 2024). ↩
- Consumer Financial Protection Bureau, “Prohibition on Creditors and Consumer Reporting Agencies Concerning Medical Information (Regulation V),” Proposed Rule, June 11, 2024; and Ryan Sandler and Zachary Blizard, Recent Changes in Medical Collections on Consumer Credit Records: Data Point, (Consumer Financial Protection Bureau, Mar. 2024). ↩
- Jessica Banthin et al., Who Benefits from Enhanced Premium Tax Credits in the Marketplace? (Urban Institute, June 2024). ↩
- Jameson Carter et al., “Four Million People Will Lose Health Insurance if Premium Tax Credit Enhancements Expire in 2025,” Urban Wire (blog), Urban Institute, Nov. 14, 2024. ↩
- Sherry A. Glied and Richard G. Frank, “Extend Marketplace Coverage to Insure More People in States That Have Not Expanded Medicaid,” To the Point (blog), Commonwealth Fund, June 10, 2021. ↩
- Patrick Drake et al., How Many Uninsured Are in the Coverage Gap and How Many Could Be Eligible if All States Adopted the Medicaid Expansion? (KFF, Feb. 2024). ↩
- Sara R. Collins and Lauren A. Haynes, “Congress Can Give States the Option to Keep Adults Covered in Medicaid,” To the Point (blog), Commonwealth Fund, Nov. 14, 2022. ↩
- The approach would treat all legal residents as insured 12 months a year regardless of whether they actively enrolled in a health plan. Income-related premiums would be collected through the tax system. See Linda J. Blumberg, John Holahan, and Jason Levitis, How Auto-Enrollment Can Achieve Near-Universal Coverage: Policy and Implementation Issues (Commonwealth Fund, June 2021). ↩
- A bill introduced by Senator Jeanne Shaheen (D–N.H.) would raise the cost protection of the marketplace benchmark plan and make more people eligible for cost-sharing subsidies (Improving Health Insurance Affordability Act of 2021, S. 499, 117th Cong. (2021), S. Doc. 1–6). This could eliminate deductibles for some people and reduce them for others by as much as $1,650 a year. See Linda J. Blumberg et al., From Incremental to Comprehensive Health Insurance Reform: How Various Reform Options Compare on Coverage and Costs (Urban Institute, Oct. 2019); and Jesse C. Baumgartner, Munira Z. Gunja, and Sara R. Collins, The New Gold Standard: How Changing the Marketplace Coverage Benchmark Could Impact Affordability (Commonwealth Fund, Sept. 2022). ↩
- John Holahan and Michael Simpson, Next Steps in Expanding Health Coverage and Affordability: What Policymakers Can Do Beyond the Inflation Reduction Act (Commonwealth Fund, Sept. 2022). ↩
- KFF, “Section 13: Employer Practices, Telehealth, Provider Networks and Coverage for Mental Health Services,” in 2022 Employer Health Benefits Survey (KFF, Oct. 2022). ↩
- Maanasa Kona, “States Continue to Enact Protections for Patients with Medical Debt,” To the Point (blog), Commonwealth Fund, Aug. 8, 2024; Maanasa Kona, “State Options for Making Hospital Financial Assistance Programs More Accessible,” To the Point (blog), Commonwealth Fund, Jan. 11, 2024; and Maanasa Kona and Vrudhi Raimugia, State Protections Against Medical Debt: A Look at Policies Across the U.S. (Commonwealth Fund, Sept. 2023). ↩
- North Carolina Department of Health and Human Services, “North Carolina Hospitals Sign On to Relieve Medical Debt,” press release, Aug. 12, 2024. ↩
- Richard M. Scheffler and Stephen M. Shortell, A Proposed Public Option Plan to Increase Competition and Lower Health Insurance Premiums in California (Commonwealth Fund, Apr. 2023); Christine H. Monahan, Justin Giovannelli, and Kevin Lucia, “HHS Approves Nation’s First Section 1332 Waiver for a Public Option Plan in Colorado,” To the Point (blog), Commonwealth Fund, July 13, 2022; Christine H. Monahan, Justin Giovannelli, and Kevin Lucia, “Update on State Public Option-Style Laws: Getting to More Affordable Coverage,” To the Point (blog), Commonwealth Fund, Mar. 29, 2022; Ann Hwang et al., State Strategies for Slowing Health Care Cost Growth in the Commercial Market (Commonwealth Fund, Feb. 2022); Choose Medicare Act, H.R. 5011, 117th Cong. (2021), H.R. Doc. 1–32; Medicare-X Choice Act of 2021, H.R. 1227, 117th Cong. (2021), H.R. Doc. 1–24; Medicare-X Choice Act of 2021, S. 386, 117th Cong. (2021), S. Doc. 1–25; State Public Option Act, H.R. 4974, 117th Cong. (2021), H.R. Doc. 1–27; State Public Option Act, S. 2639, 117th Cong. (2021), S. Doc. 1–27; Public Option Deficit Reduction Act, H.R. 2010, 117th Cong. (2021), H.R. Doc. 1–17; CHOICE Act, S. 983, 117th Cong. (2021), S. Doc. 1–12; Health Care Improvement Act of 2021, S. 352, 117th Cong. (2021), S. Doc. 1–75; and State-Based Universal Health Care Act of 2021, H.R. 3775, 117th Cong. (2021), H.R. Doc. 1–30. ↩
- Weights for sex, age, education, geographic region, family size, and race/ethnicity were determined using the 2023 Current Population Survey Data for Social, Economic and Health Research; population density using the 2022 Census Planning Database; civic engagement using the 2021 Volunteering and Civic Life Supplement of the CPS; and frequency of internet use using the Pew Research Center’s 2023 National Public Opinion Reference Survey (NPORS). ↩
- Robin A. Cohen and Elizabeth M. Briones, Health Insurance Coverage: Early Release of Quarterly Estimates from the National Health Interview Survey, 2023–June 2024 (Centers for Disease Control and Prevention, National Center for Health Statistics, Nov. 2024). ↩
- Centers for Disease Control and Prevention, National Center for Health Statistics, “About the National Health Interview Survey,” last reviewed Nov. 22, 2023. ↩
- Katherine Keisler-Starkey and Lisa N. Bunch, Health Insurance Coverage in the United States: 2023, Current Population Reports (U.S. Census Bureau, Sept. 2024). ↩
- United States Census Bureau, Design and Methodology: Current Population Survey — America’s Source for Labor Force Data, Technical Paper 77 (U.S. Census Bureau, Oct. 2019). ↩
Sara R. Collins, Ph.D., is senior scholar and vice president for health care coverage and access and tracking health system performance at The Commonwealth Fund. An economist, Dr. Collins directs the Fund’s program on insurance coverage and access and the research initiative on tracking health system performance which produces the Fund’s annual scorecard on state health system performance. Since joining the Fund in 2002, Dr. Collins has led several multi-year national surveys on health insurance and authored numerous reports, issue briefs, blog posts, and journal articles on health insurance coverage, health reform, the Affordable Care Act, and state health system performance. She has provided invited testimony on 17 occasions before several Congressional committees and subcommittees. Prior to joining the Fund, Dr. Collins was associate director/senior research associate at the New York Academy of Medicine, Division of Health and Science Policy. Earlier in her career, she was an associate editor at U.S. News & World Report, a senior economist at Health Economics Research, and a senior health policy advisor in the New York City Office of the Public Advocate. She holds an A.B. in economics from Washington University and a Ph.D. in economics from George Washington University.
Avni Gupta, Ph.D., is a researcher for the Health Care Coverage and Access program at the Commonwealth Fund. As a health policy researcher, Gupta is primarily responsible for the Fund’s national surveys on health insurance and for publishing reports, issue briefs, blog posts, and journal articles on health insurance coverage, access, underinsurance, and health care reforms. Prior to joining the Fund, she was a research scientist at Brigham and Women’s Hospital, Boston, for nearly four years. There she led several research projects on insurance, access, quality of care, and health outcomes. Her clinical training is in dental surgery from India. Additionally, Gupta earned an M.P.H. in epidemiology and biostatistics from Johns Hopkins University and a Ph.D. in public health policy and management from New York University.
The Commonwealth Fund was established in 1918 with the broad charge to enhance the common good. Its founder, Anna M. Harkness, is among the first women to start a private foundation.
Today, the mission of the Commonwealth Fund is to promote a high-performing, equitable health care system that achieves better access, improved quality, and greater efficiency, particularly for society’s most vulnerable, including people of color, people with low income, and those who are uninsured.
The Fund carries out this mandate by supporting independent research on health care issues and making grants to improve health care practice and policy. An international program in health policy is designed to stimulate innovative policies and practices in the United States and other industrialized countries.

Spread the word