
Absent an extraordinary upending event, Kamala Harris will win the national popular vote on November 5th. I’m confident of that not because she is ahead in the polling averages, or because of a “forecast,” conventionally conceived.
I say it because in the MAGA Era the best predictor of how – and whether – someone will vote in the future is how – and whether – they have voted in the past. Today, there are about 91 million Americans who have voted for Biden and House Democrats since 2016, and about 83 million who have voted for Trump or House Republicans. If this pool of voters votes that way again, and if they constitute 80 percent of those voting in 2024 (a fairly conservative assumption), then the other 20 percent of voters would have to favor Trump by 18 points for him to overcome that deficit. That’s just simple arithmetic. Let’s make a much more conservative assumption – that Harris does only half as well as Biden did with those voters (in other words, that she only wins them by 2.25 instead of 4.5).1 In that case, Trump would still need to win first time voters by 9 points. There’s just no evidence to suggest anything like that is in the offing – but plenty of evidence to the contrary, as you’ll see in this post.
I want to underscore the significance of this. This will be Democrats’ fifth consecutive popular vote win, which has happened only once before since the Civil War (Truman in 1948). It will also mark their eighth popular vote win out of the previous nine presidential elections, which has never happened before. And Donald Trump will be only the second major party nominee to lose the popular vote three times since the Civil War (William Jennings Bryan is the other).2
Now, in a rational democracy, that would be the end of the story. But we live in America. We cannot be as confident of the result in the Electoral College states. Thus, reasonable anticipations that this will be another “very close” presidential election should be seen not as “reasonable” at all, but as heralding another major crisis.
But that crisis is for another Weekend Reading post. For today, I’m sticking to the cold, hard numbers that we need to navigate our nightmare Frankenstein-federalist system.
As I’ve repeatedly explained, horse race polls can’t tell us anything we don’t already know about the Electoral College outcome – that it will likely come down to six battleground states3, and that the results in those states will likely be too close for us to have confidence in even the highest quality polls. Of course, some polls will get it right; the problem is that we don’t know which ones until after the election. Inevitably someone will be right, but only because so many were guessing. When there are bets on every number at a roulette table, someone is going to win – and with just six states in play, flipping a coin would have a reasonable chance of being correct.4
Does this mean data can’t tell us anything useful ahead of time about what will happen? Of course not! It’s just that the helpful data is not the data you typically hear about. Beginning with the 2008 election, Catalist has been compiling and maintaining high quality voter files, which offer crucial insights into who votes. Studying voter files allows us to see what I said at the beginning – that the best predictor of future voting behavior is past voting behavior.
Therefore, in this post, I will use voter file data to construct a model of the likely 2024 electorate – not by demographics, but by vote history and behavior. I will model two different scenarios, one with “low turnout” and one with “high turnout,” to show the most consequential factors determining the final outcome.
This post has three parts:
1) Background: We’re Not In Kansas Anymore - Since 2016, more people are voting, newer voters are breaking for Democrats, and few people are changing their partisan choice from election to election.
2) Definitions - There is no standard set of definitions to describe different segments of the voter file. In this section, I’ll define the segments I’m going to use in the model.
3) Modeling the 2024 Electorate - The payoff.
Background: We’re Not in Kansas Anymore
Americans have three options every other November – to vote for the Democrat, vote for the Republican, or not to vote at all.5 But the media and commentators rigidly resist any attention or study to who doesn’t vote and why, instead poring over what seems like a dozen polls a day which only speak – unreliably – to the first question.
Thus, the political press has missed one of the most important election stories of the last eight years: Who votes in the MAGA era is different from who voted before. Regular readers have probably seen some of these charts before, but they bear repeating as background here.
More People Are Voting
Since 2016, we keep essentially having the same election over and over, because voters keep facing the same choice – a Trump/MAGA future for America, or not. Most people already know that they do not want a MAGA future. The salience of this choice has driven historically high turnout, which has consistently resulted in wins for Democrats (even though many anti-MAGA voters don’t identify as Democrats).
Until recently, the percentage of eligible voters who participated in elections had been one of the most stable metrics in politics. The flat trend lines below show that, for nearly a century, turnout rates remained within a +/- 3 point range for decades at a time – but after 2016, as the three bubbles on the right show, we’re not in Kansas anymore.6
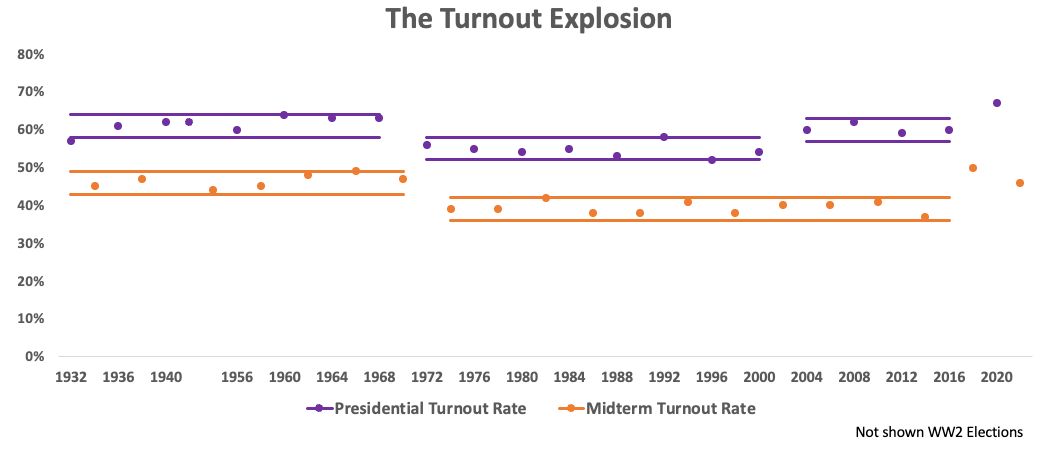
This phenomenon is especially noteworthy because, in electoral democracies, higher turnout generally signifies greater approval of and confidence in the political system. Yet we know that the opposite has been the case in the United States, as all those measures of approval and confidence have been declining for quite some time. More people are voting not because more people believe one or the other party will make their lives better, but because more people are convinced that one or the other party will make their lives worse.
In other words, for many, voting has become an act of self defense.
That’s why fewer and fewer Americans identify as either Democrats or Republicans, even though both voter participation and partisan choice polarization are historically high.
New Voters are Much More Anti-MAGA
It’s a serious analytical oversight that our political media focuses nearly all its attention on for whom people will vote (that is, for Harris or Trump), and almost none on whether people will vote. Since 2016, having an anti-MAGA voting majority depends on previously occasional voters casting ballots more consistently now, and those who had not been voting deciding to cast ballots. Indeed, Biden would have lost the Electoral College in 2020 without the support of those “whether” voters.
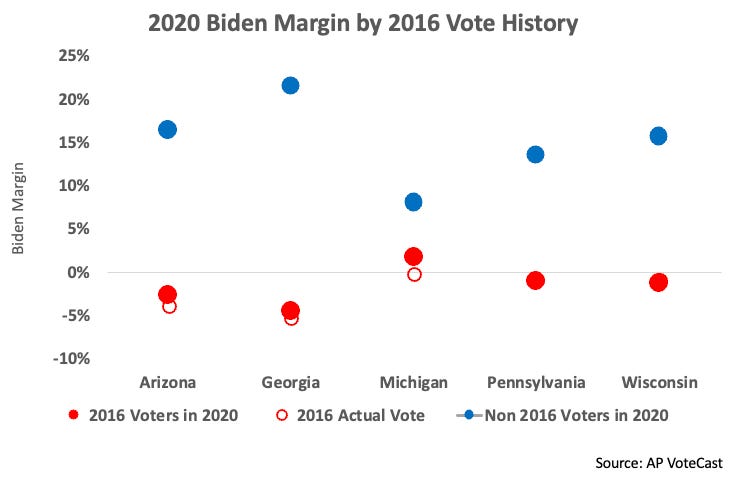
The difference between Democrats’ losses in 2016 and subsequent victories has been the infusion of those new voters. That is most vividly apparent in the five states that Biden flipped to win the Electoral College. The following graph shows how Biden's margin in each of the five states was nearly identical to Clinton’s four years earlier (hollow red bubbles) among voters casting ballots in both elections (solid red bubbles). In 2020, Biden flipped Arizona, Georgia, Michigan, Pennsylvania and Wisconsin because of the infusion of new anti-MAGA voters. That was the case nationally as well, as he won the 2016 and 2020 voters by the same 2 point margin Clinton carried them, but won the new voters by about a dozen points.
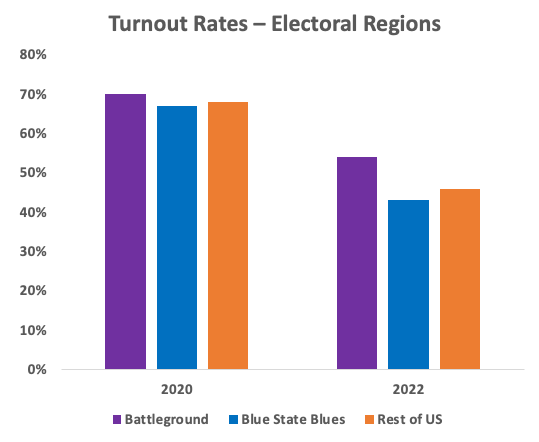
In previous Weekend Readings, I’ve offered several independent data approaches to see how big a factor Trump/MAGA has been in driving who votes in elections after 2016. For example, the following graph shows the turnout rates in three regions – the six Electoral College battlegrounds; the three states that I call the Blue State Blues (California, New Jersey and New York); and the remaining 41 states. As you can see, in 2020, turnout rates were not much different across the three regions. But in 2022, in the battleground states – where the MAGA threat was most salient – turnout rates far surpassed the rest of the country. And where the threats of Dobbs, etc. seemed most remote (the Blue State Blues states), the turnout rate was the lowest.7 (For much more see “Red Wave; Blue Undertow” and “A Tale of Two 2022 Midterms.”)
Fewer People Are Changing their Minds
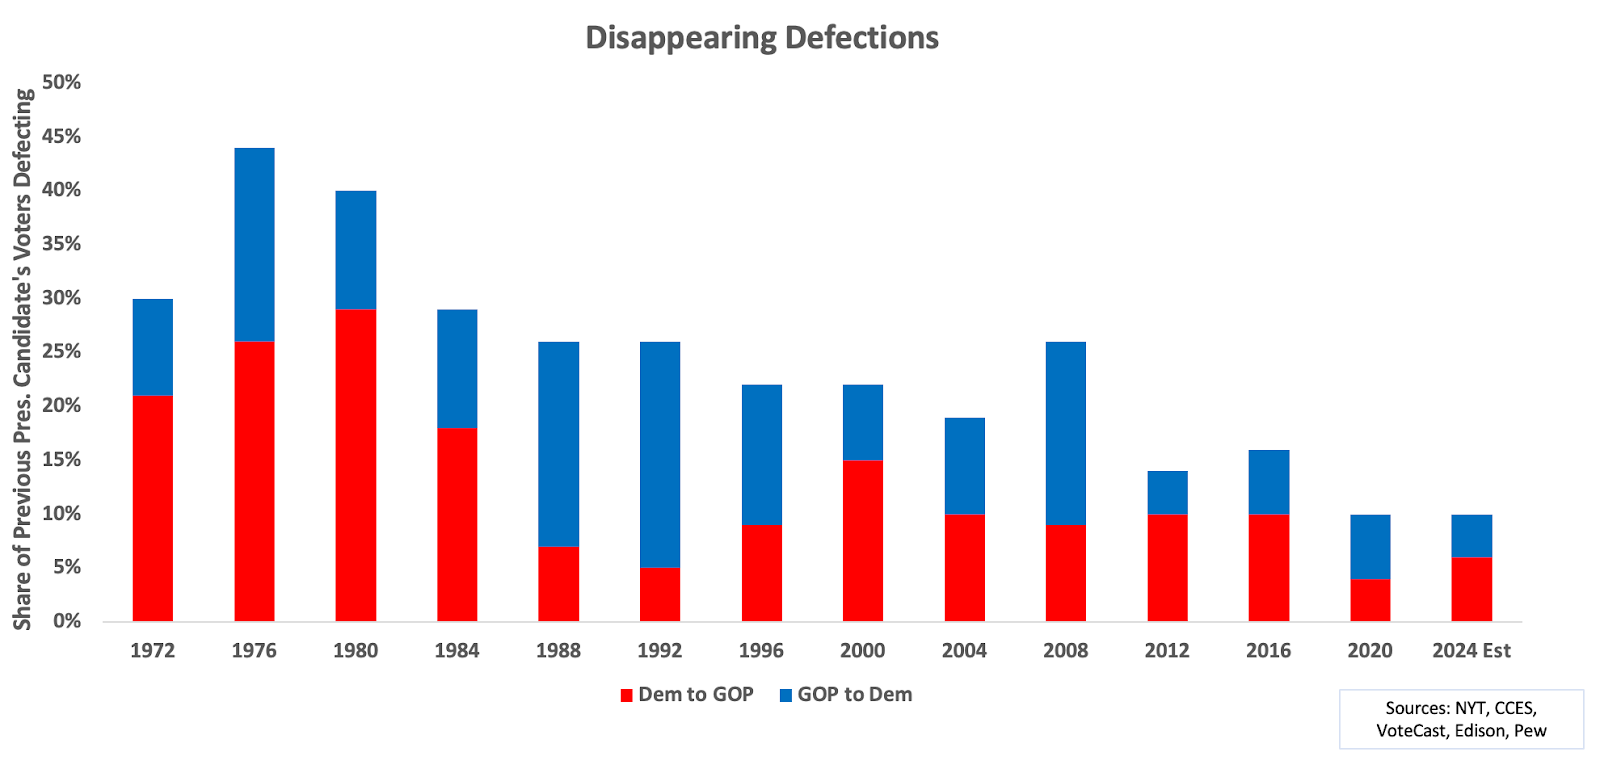
There is substantial evidence that after 2016, substantially fewer voters are changing their minds. The following graph8 makes this dramatically clear. Again, this shouldn’t surprise us, since the differences between the two parties have never been as great, or as well known, as they are today.9
Just as an aside, because I don’t know if I’ll ever come back to this – note the sequence 2008-2012-2016 for what it suggests about the so-called Obama-Trump voters. TLDR: Yes there are definitely some Obama-Trump voters in the ways they are popularly imagined (lifelong Democrats working class whites defecting to Trump), but much more of the phenomenon can be explained by the reversion of lifelong Republican voters who were disaffected in 2008. See this footnote for more.10
The Illusion of “Swinginess”
If the electorate is as set as the foregoing argues, why is there so much volatility in the polling? Two big reasons – statistical noise with real movement in the electorate, and survey questions which exaggerate how many voters are actually movable.
Confusing statistical noise for movement
Let’s say we’ve been asking the same 2,000 people every week for the last year who they think they will vote for for president. You would expect to see almost no change week to week, and not much more change over a year or more. Indeed, this is the result we get in the real world from panel studies that do exactly this. Yet if we ask a different set of 2,000 people every week, we will invariably see swings – not because individuals are changing their minds, but because we are changing our minds about who to ask.
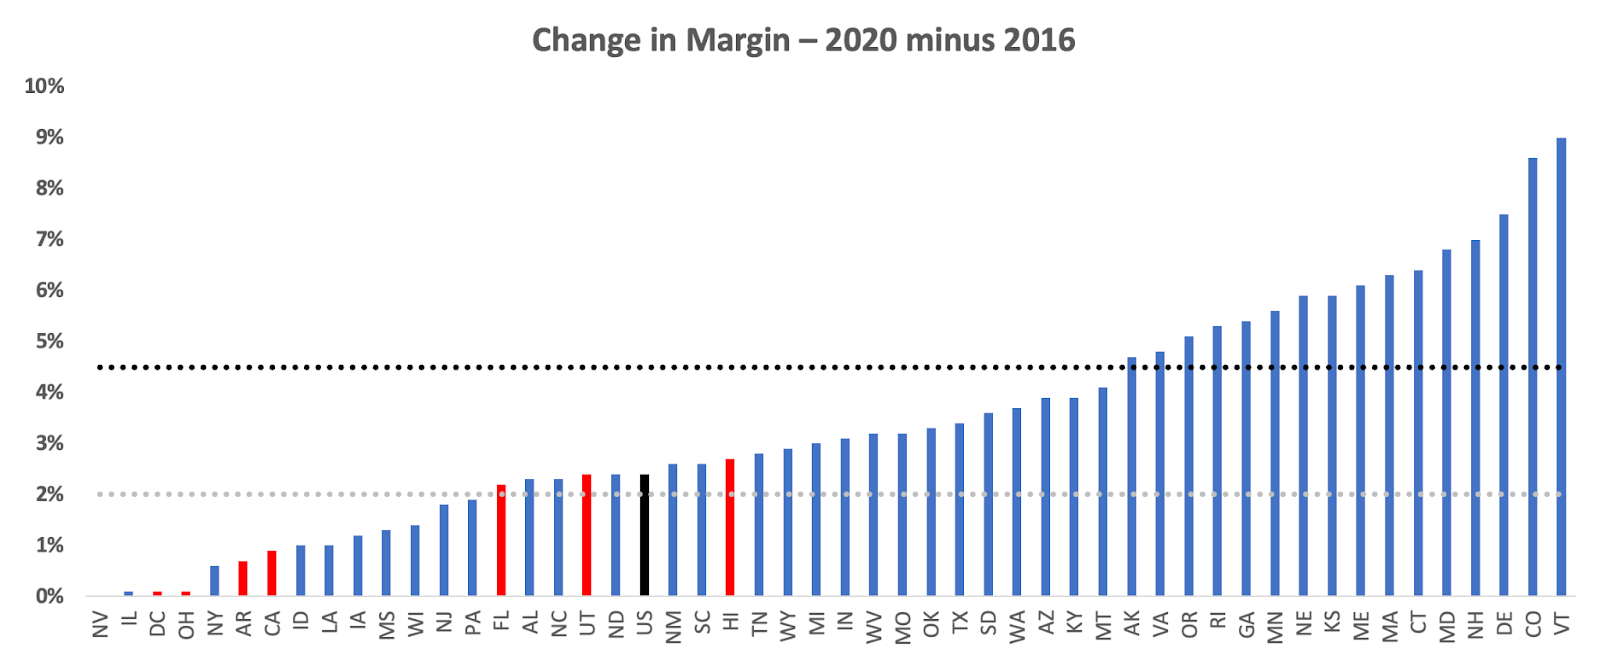
Remember, if polls showing the race to be tied right now are borne out, that would mean a national swing away from Democrats of 4.5 points – greater than any swing from one presidential election to the next in the 21st Century, other than 2008. And, as you can see, in 2020, few states moved as much as 4.5 points, and most moved by less than 3 points.
Answering “undecided” on a survey ≠ open to voting for either candidate
The common meaning of “undecided” is someone who might vote for Trump or Harris. However, the practical “definition” of “undecided” is someone who says they are undecided on a survey. In reality, there are far fewer genuinely movable voters than there are survey respondents who say they are “undecided.”
Moreover, the closer to the election we get, being “undecided” is a good proxy for “probably won’t vote.” In fact, it’s a much more accurate predictor of whether someone will vote than the standard “are you enthusiastic” or “how likely are you to vote” questions – because, as we know well from social science, humans are bad at predicting their own future behavior.
Because this is somewhat technical, and because it takes us afield from the main points of this post, I’ve explained more about why we know all of this in this long footnote.11 Otherwise, read on!
Definitions
Let’s begin by dividing eligible voters into two categories: active (people who have voted before) and potential (people who haven’t). Then can we subdivide those two categories further.
Active Voters - I’ll spend the most time talking about these three groups of active voters:
-
Habitual voters. All those who voted in all four of the previous four elections. Consistently, 95 percent of this group votes in the next presidential election.
-
Contingent voters: All those who voted in at least one, but not all, of the previous four elections. For our purposes, two major groups of contingent voters are important:
-
2016 voters. Those who voted in 2016 but skipped at least one of the next three elections.
-
New voters. Those who did not vote in 2016 but have since. As you will see shortly, these are the voters who have driven historically high turnout rates.
-
Potential Voters - Since they haven’t voted before and we therefore don’t have information about their likely partisanship, I’ll only show how they complete the map of eligible voters towards the end of the piece.
-
Newly eligible voters. Those who were not eligible in the last presidential election and who did not vote in the recent midterm. These voters have consistently been about 11 percent of the eligible population, not less than 10 or more than 12 percent.
-
Non-voters. Those who have been eligible since at least the last presidential election but have not cast a vote in a federal election.
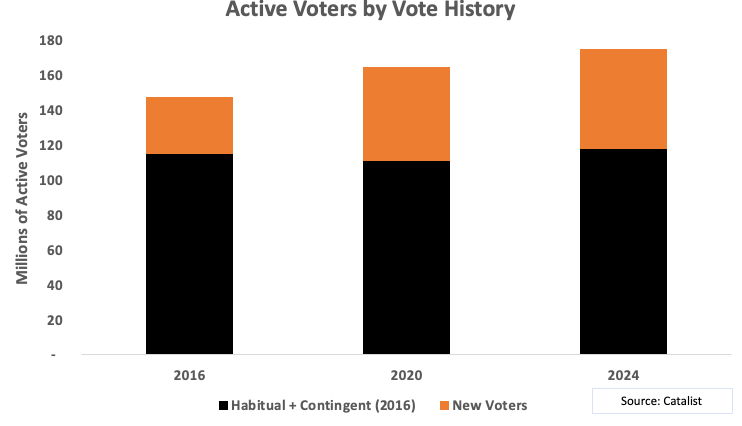
With those categories in mind, let’s look at the composition of active voters ahead of the 2016, 2020 and 2024 elections. As you can see, the number of new voters12 jumped significantly ahead of 2020, and has done so again ahead of 2024 after more people voted for the first time in the last midterm.13 (Wherever this piece refers to “new voters,” it is shorthand for “contingent new voters”; if I mean first-time/newly eligible voters, I will specify them as such.)
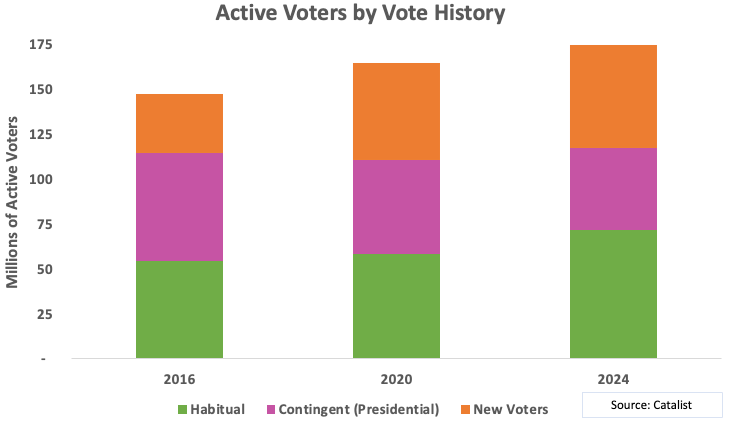
The next graph splits up the first category further, into habitual and 2016 contingent. Combined, those voters have remained at the same levels. But ahead of 2024, more of the previously contingent (2016) have become habitual voters – reflecting their more consistent engagement in the Trump/MAGA Era.
There are sharp partisan differences between the categories ahead of the 2024 elections.14 In the next graph, habitual voters (green bubbles) are the least Democratic voters of the three categories. That makes sense, since those who vote most often usually are the most “conservative” in the sense that they are more successful and feel more agency in their lives. But, remember, they are somewhat more Democratic now – not because those who were habitual voters in 2016 became Democrats, but because those who are newly habitual voters favor Democrats more than those who had previously been habitual voters. The key point in this graph is how much more Democratic new voters are in every region, including Red States. They have been activated by the threat (or appeal) of Trump/MAGA, with more against MAGA than for.
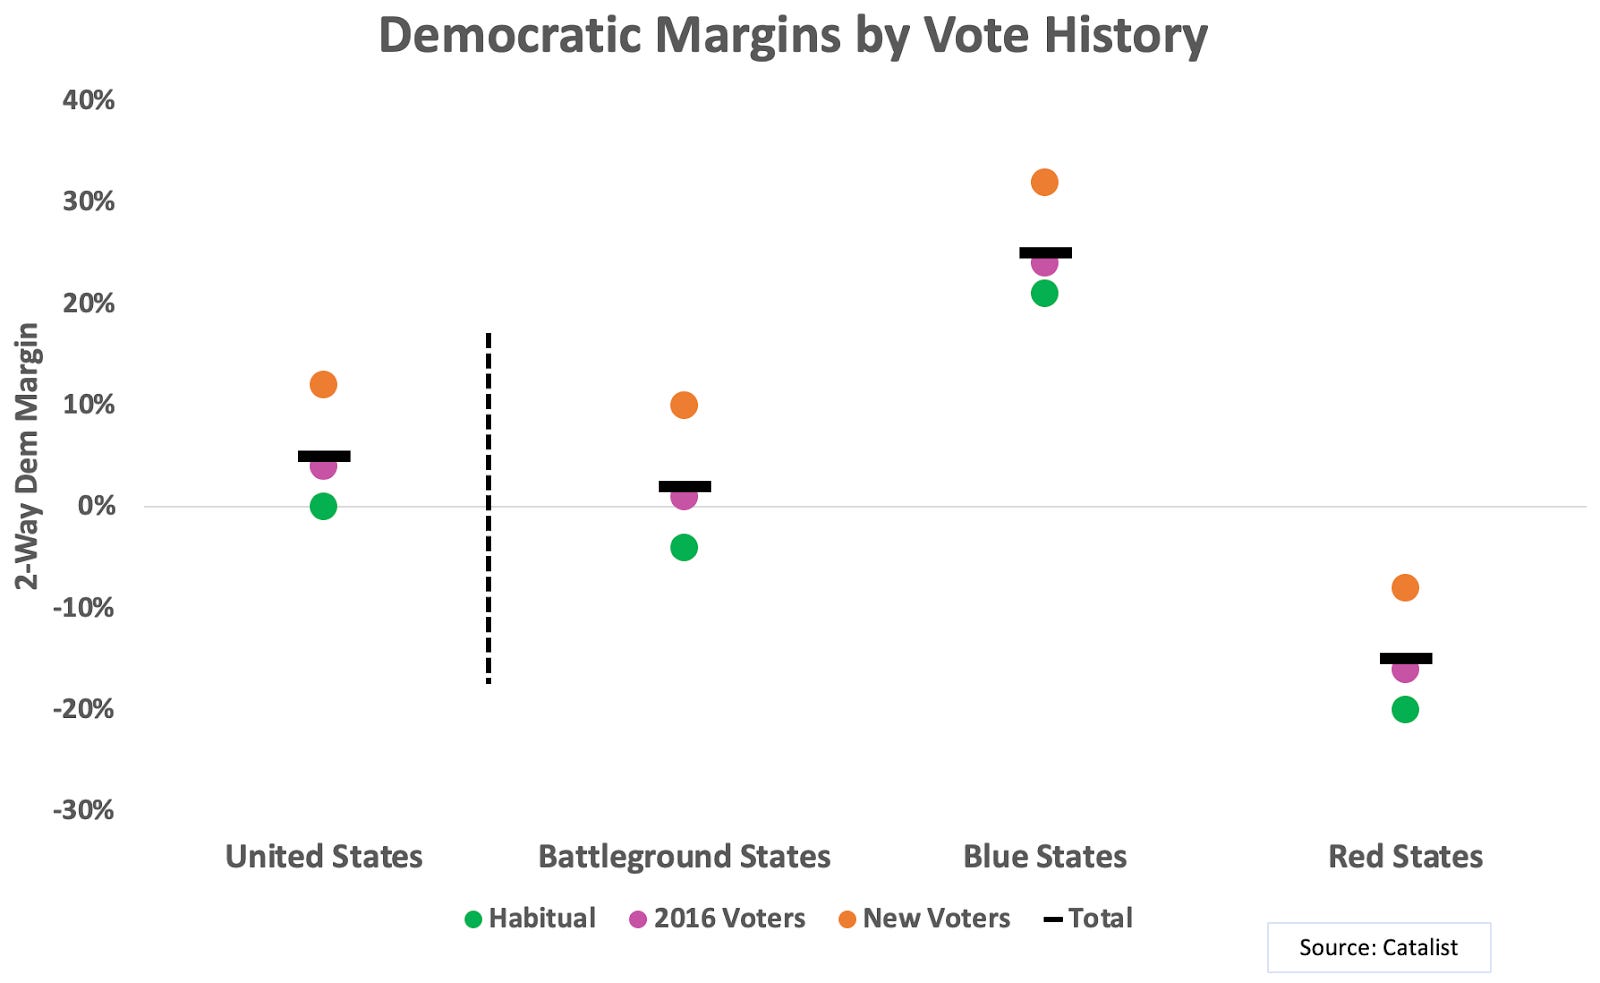
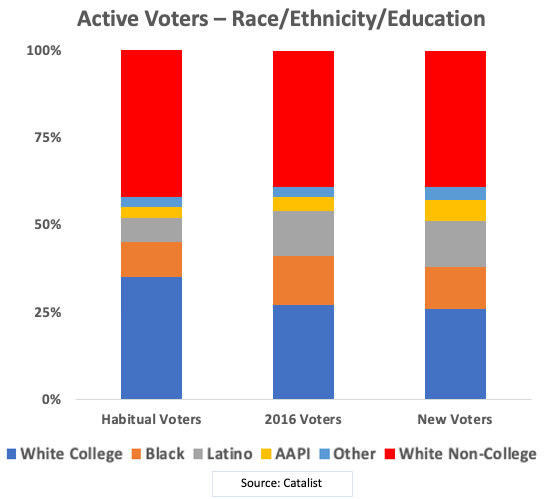
In the following graph, we see clearly that differences in race, ethnicity, or education don’t explain these dramatic differences in partisanship. The demographic profile of 2016 contingent voters (who favored Democrats by only about 4 points) is identical to the demographic profile of new contingent voters (who favored Democrats by about a dozen points). And, despite consisting of a substantially greater share of white college voters, habitual voters broke even between the two parties.
Modeling the 2024 Electorate
Now, let’s use what we’ve learned so far to model how many voters of which type are likely to show up in 2024, depending on turnout levels. All of the numbers of voters in this section are based on the Catalist voter file – they are administrative records, no modeling or polling involved. All the partisan estimates for each tranche of voters is based on Catalist modeling. I’ll look at both the national vote and the vote in the six battlegrounds needed to win the Electoral College.
The pool of eligible voters includes:
174 million active voters:
-
72 million habitual voters who voted in each of the last four cycles.
-
46 million contingent 2016 voters who voted in 2016, but not all of the next three elections. (About two-thirds can be thought of as “presidential” voters, having voted in 2012 and 2020 as well.)
-
57 million contingent new voters who voted in at least one of 2018, 2020 and 2022, but not in 2016.15
73 million eligible non-voters, or citizens eligible to vote but who haven’t. This includes about 9 million young voters newly eligible since the last presidential election, less those who voted in the 2022 midterms.
The next two panels give you some perspective on the relative size of those groups, comparing the entire United States to the six battlegrounds. The panel on the left describes the composition of active voters and the panel on the right the composition of all eligible voters. It builds from the ground up, with the base being habitual voters.
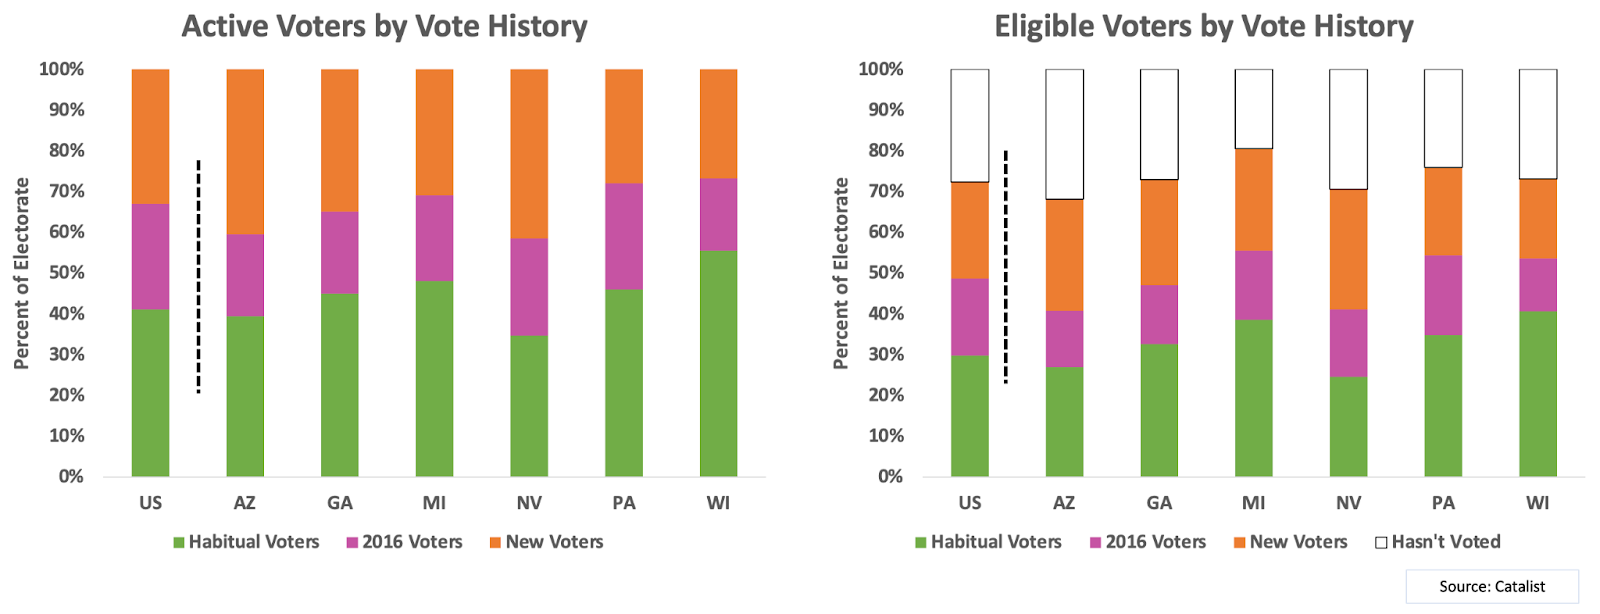
Of note is that in the battleground states, habitual voters make up the greatest share in Wisconsin, which is consistent with the very narrow range of outcomes there. Not surprisingly, habitual voters make up the smallest share in Nevada, which has had substantial out-migration during COVID and in-migration more recently. This makes expectations for outcomes there especially uncertain.
2024: High or Low turnout?
Despite all the talk about whether 2024 will be a high or low turnout election, I haven’t seen anyone specify what they mean by either term. (And strangely, this turnout discourse seems to have disappeared without a trace after Biden dropped out.)
Provisionally, let’s begin by saying that a “low turnout” election is one in which the turnout rate in each state is the lowest it’s been in that state in the previous three elections (2012, 2016 and 2020). That works out to 142 million voters in 2024. Then, because 2020 was historic (67 percent, the highest it’s ever been since the 19th century), let’s leave that as our definition of a “high turnout” election.
Segmenting the electorate into the vote history categories I’ve described allows us to be fairly confident of the likelihood that voters in those segments will vote in 2024 under different turnout assumptions. Thus, with what we know about previous behavior patterns, we can begin to get a sense of what 2024 might look like in either scenario. (Geek bonus – read this footnote for more on how this differs from “turnout modeling” you’ve read about.16)
Tranche One: Habitual Voters
The next graph provides a template for understanding 2024 turnout from the ground up. In 2020 and in 2016, 95 percent of those who voted in the four previous elections voted in that election. That is almost certain to be a good approximation for 2024, regardless of how engaged other eligible voters are. I’ve allocated habitual voters to who they voted for previously. Nationally, that means that Harris starts “tied,” and about 3 and a half points behind in the Electoral College battlegrounds.17
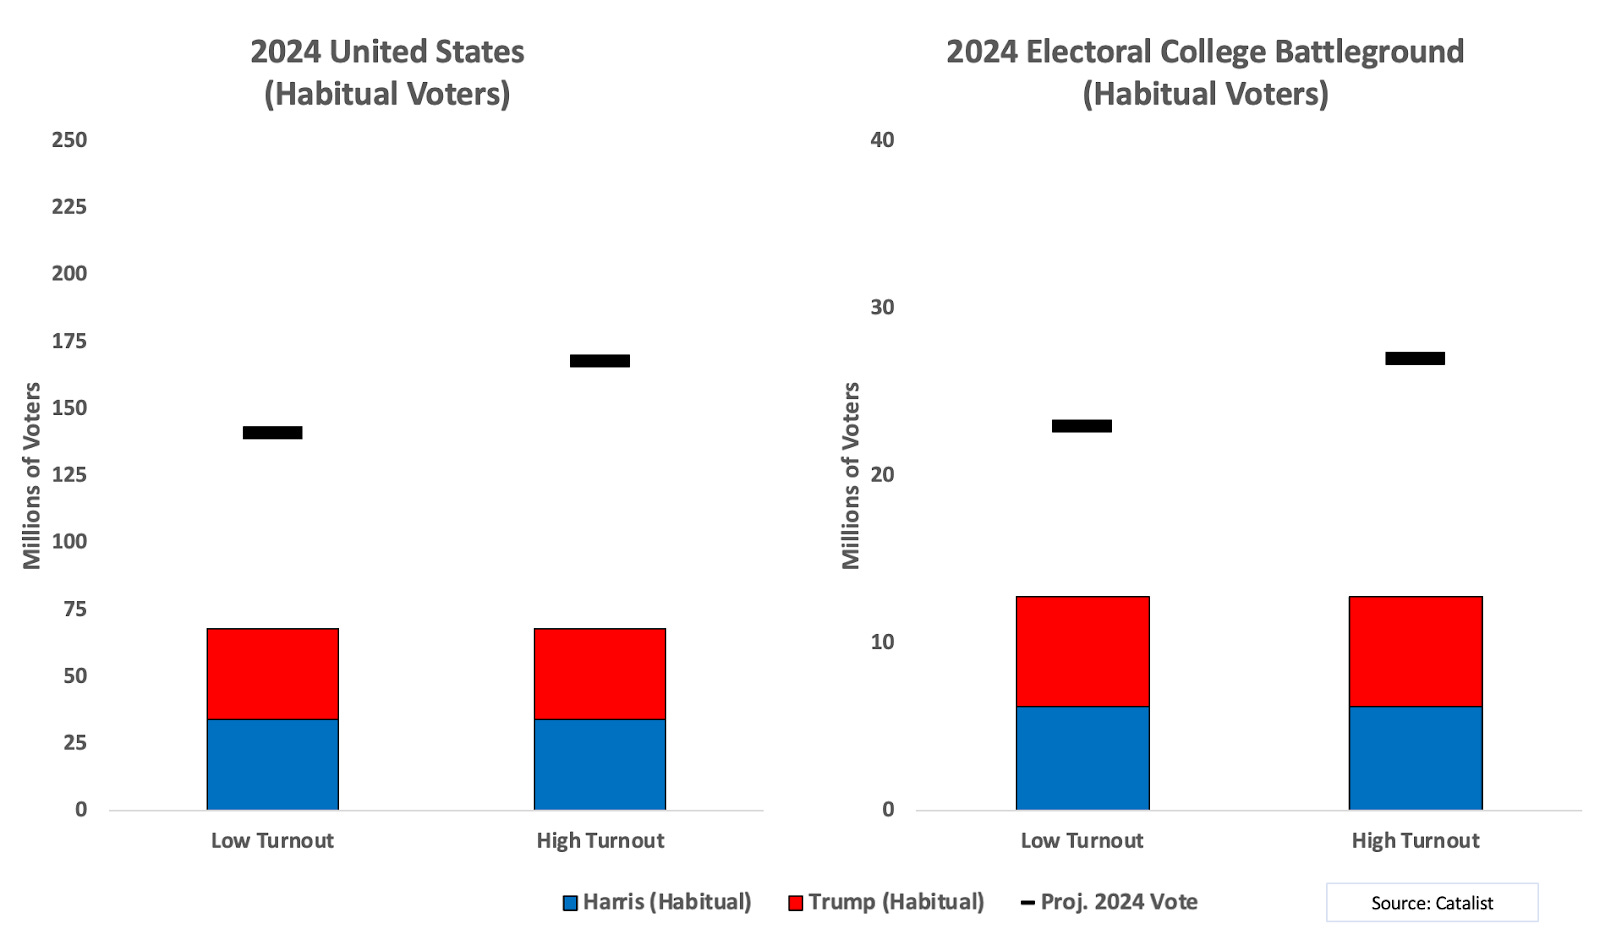
Let’s pause to think about what that means. Nationally, the race will be decided by the 74 million other voters in the Low scenario or 99 million in the High scenario. But, in the Electoral College battleground, Harris cannot win unless she wins a majority of those who are not habitual voters. By how much? In the Low scenario, she has to win the remaining voters by 4 points; in the high turnout scenario she needs to win the remaining voters by 3 points.
This highlights an important point in this new way of thinking about who will vote. If you are behind with habitual voters, then all else being equal you will do better with higher turnout, because you need to win a smaller share of the contingent voters to overcome your deficit with habitual voters.
Tranche 2: Contingent 2016 Voters (who voted in 2022)
Now, let’s add contingent 2016 voters. I’m going to have to get a bit more technical than in my conceptual categorization because those who voted in 2016 can be usefully divided by whether they voted in 2022 as well. That’s because historically, about 90 percent of those who voted in the second previous presidential election and the most recent midterm vote in the next presidential election. Think of them as essentially habitual voters who happened not to vote in all four. Nationally and in the battleground, this group has been about 16 points Trump/Republican, while the other 2016 voters lean Democratic, as we saw earlier. So it’s worth pulling them out.
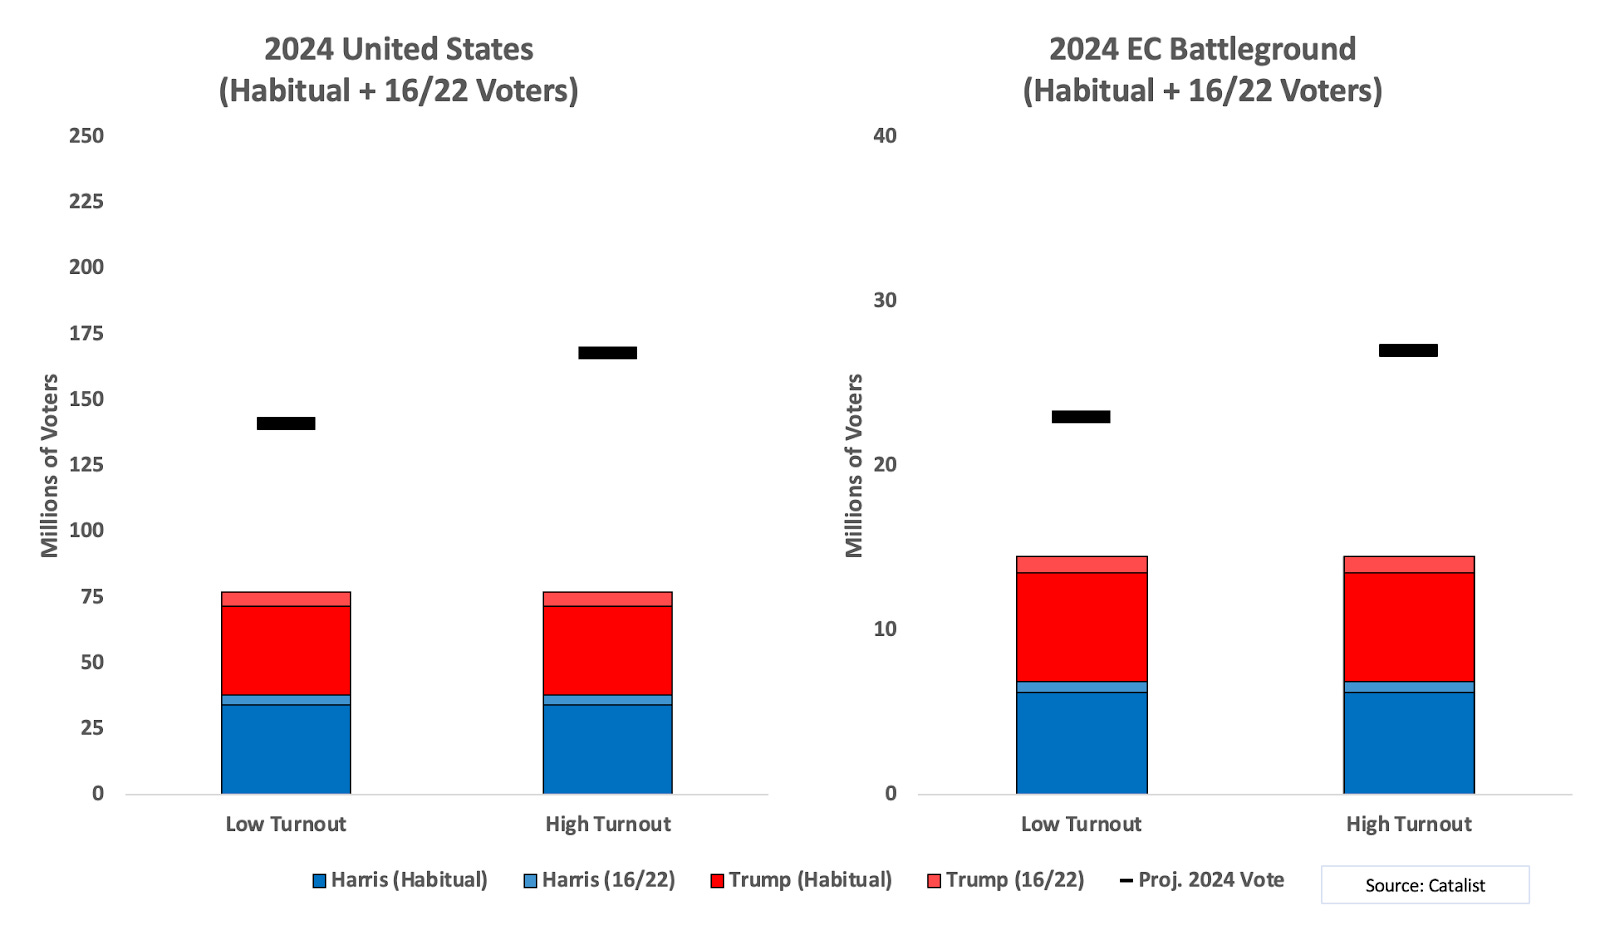
When you combine these two most-likely-to-vote categories, Harris “trails” Trump by 2 points nationally and by 5 points in the Electoral College battlegrounds.18 That means that nationally, Harris would need to win the remaining 65 million in the Low scenario by about 2 and a half points and the remaining 90 million in the High scenario by about 2 points. In the Electoral College battlegrounds, Harris would need to win the remaining 7 million voters (Low) by 8 points, or the remaining 13 million voters (High) by about 5 points.
Again, these first two tranches are the most likely to vote in 2024. The key takeaway for these groups is that in the Electoral College states, Harris begins behind, and would need to win the remaining voters in a low turnout scenario by a greater margin than she would in the high turnout scenario.
Tranche 3 - Contingent 2016 Voters (who didn’t vote in 2022)
Now, we’ll look at the rest of those who voted in 2016, but not in 2022. This group of voters is more Democratic than the previous two essentially habitual voting categories, favoring Democrats by about 9 points nationally and 8 points in the Electoral College battlegrounds. Since this exercise is not meant to be predictive, but to illustrate turnout dynamics, let’s assume that about half of this group votes in 2024 (Low) or 55 percent (High).19
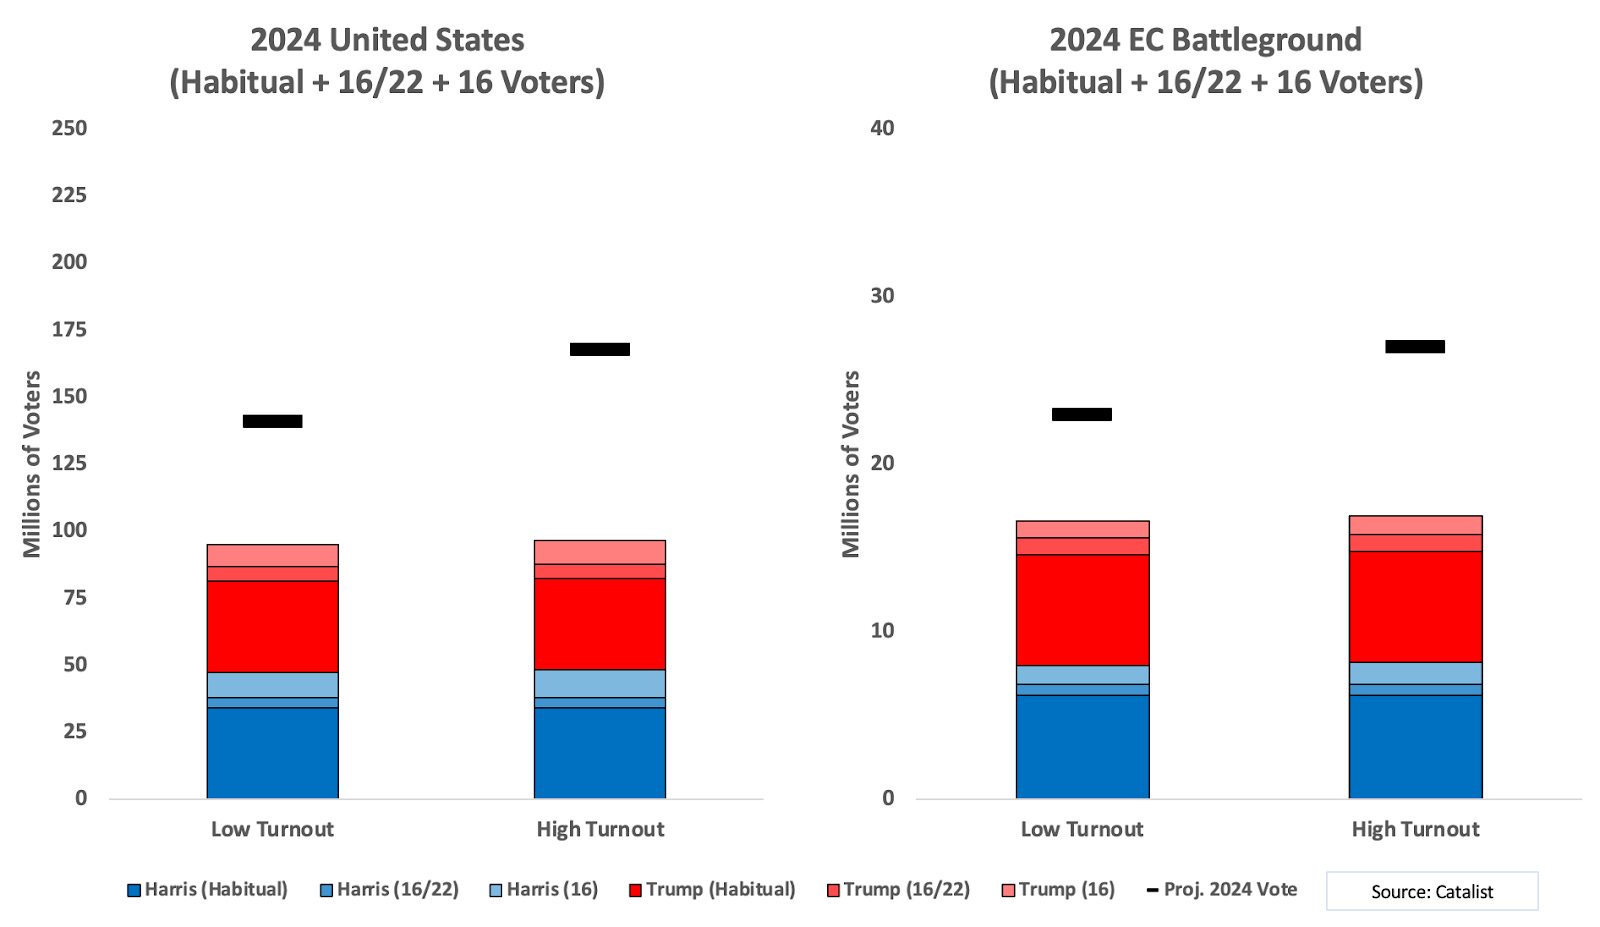
Once you roll in these voters, Harris draws even nationally, with between 47 and 70 million voters left to account for in the two scenarios. However, she is still “trailing” by a bit more than 3 points in both scenarios in the Electoral College battlegrounds. That means that to win those states, she would need to win the remaining 6.5 million voters by about 9 points (Low) or the remaining 11 million voters by about 5 points (High).
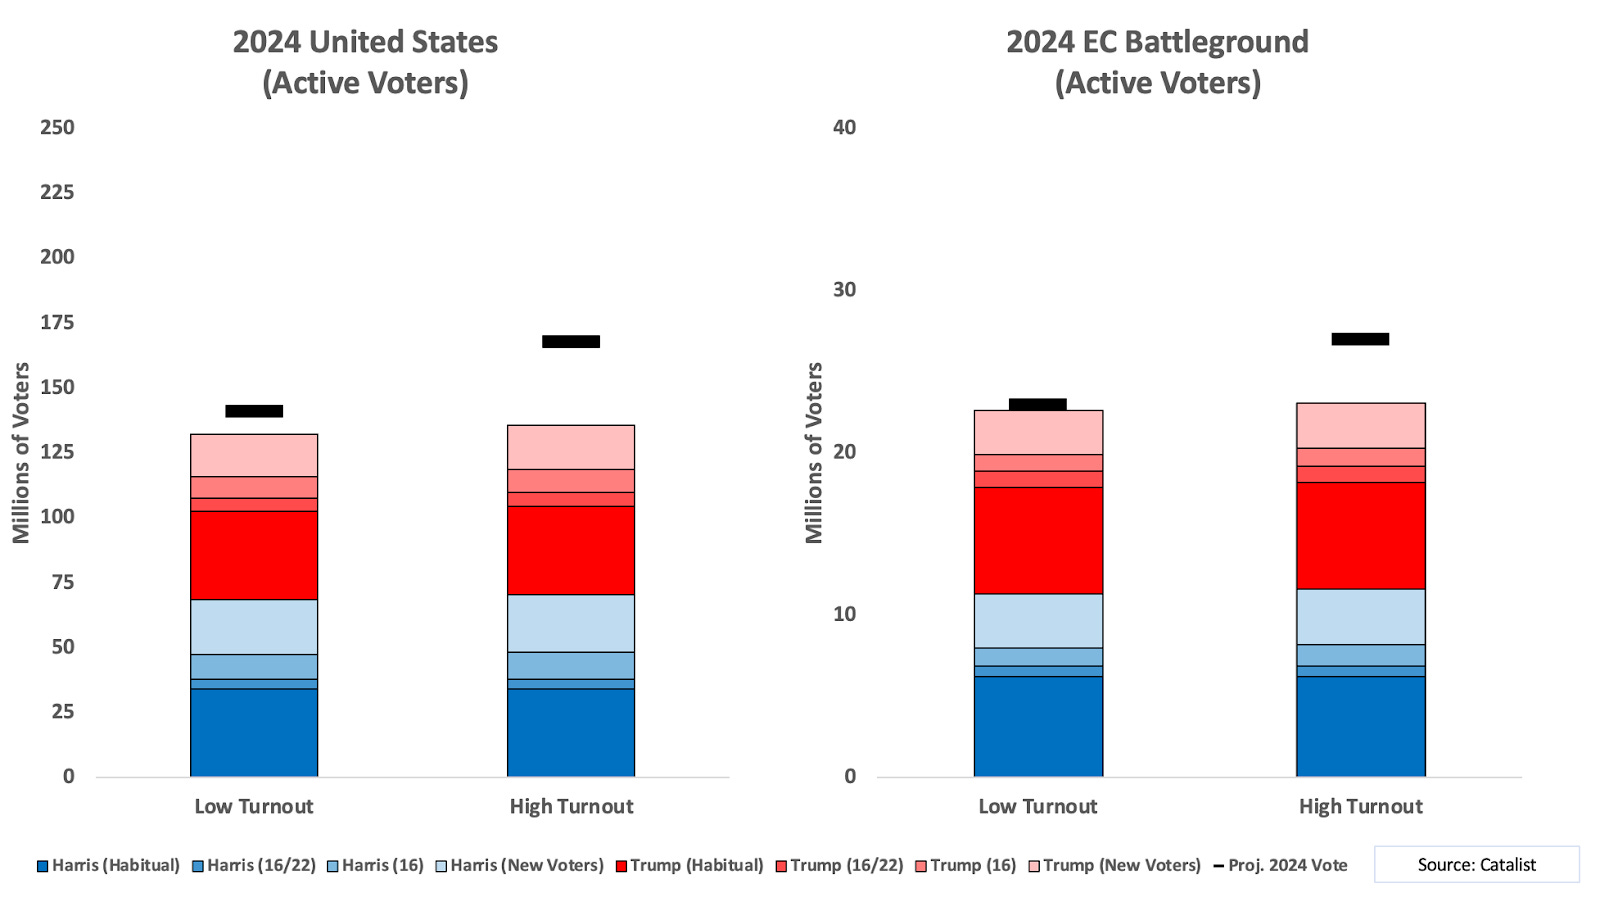
Tranche 4 - New Voters
Now let’s turn to the voters who have been most Democratic - those who did not vote in 2016, but have since then. Nationally they have favored Democrats by about 13 points, and in the battlegrounds by about 9 points. This is a group without helpful precedents for our turnout assumptions, as its size and character are out of scale with what preceded previous presidential elections.
Now – again, just to illustrate the dynamics at play, not to forecast the winner in six weeks – let’s assume that in the Low scenario, two thirds of the new voters cast ballots with the same Democratic margin they had voted previously. For the High scenario, let’s assume that it’s 70 percent.20
With those assumptions, Harris “leads” by about 3.5 points nationally in either scenario, with about 9 million more votes to be cast in the Low scenario and about 31 million more votes to be cast in the High scenario. In the Electoral College battleground states, she pulls even, with between 1 million (Low) and 5 million more (High) to be cast.
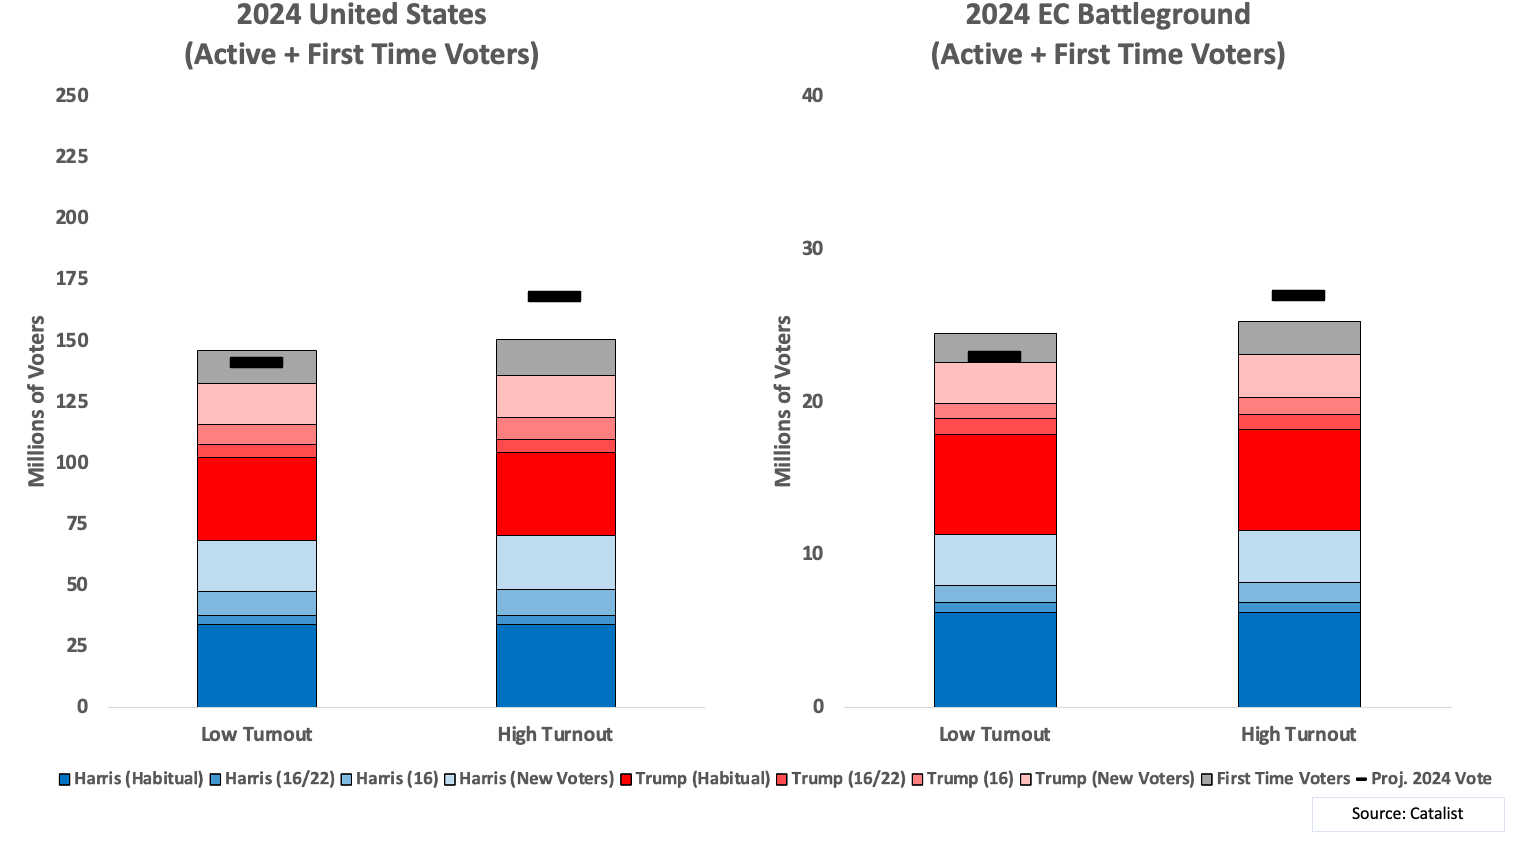
Tranche 5 - Never before 2024 voters
Looking back over the 2012, 2016 and 2020 presidential elections, both nationally and in the battleground states, first-time voters constituted a remarkably consistent 10-12 percent of the eligible population. Not surprisingly, about two thirds have been younger voters. The following graph shows the results if we assume that half of them vote in the Low scenario and 60 percent vote in the High scenario. We don’t have a basis for assuming their partisanship, so I’m labeling them in gray.
As you can see, both nationally and in the battleground states, building from the ground up yields greater turnout than the seemingly reasonable low turnout scenario. On the other hand, building from the ground up falls short of the high turnout scenarios. Unsurprisingly, In both cases, turnout is higher in the battleground states because, as I noted earlier, turnout was substantially higher in those states in the 2022 midterms than they were in the rest of the country.
Conclusion
If you’ve made it this far, I hope you share my confidence that Harris will win the popular vote, and understand why: that those who have already voted in at least one of the last four elections (1) favor Harris, (2) have switched partisan sides in very small numbers, and nearly equally on each side, and (3) will constitute such a large share of all voters as to be too much for first time voters to overcome even if they favor Trump by implausibly large numbers.
Sadly, the same cannot be said with confidence for the Electoral College battleground states. Harris needs the kind of high turnout from contingent new voters that pushed Biden over the top (barely) in those states, and which contributed to the Democratic near-sweep in those states in the 2022 midterms (even as they ran against the usual strong winds against the party in power).
As I’ve explained, evidence indicates that this high turnout has been motivated by loss aversion – the belief and fear that MAGA will take away fundamental freedoms. It’s not clear whether those stakes will be clear enough to contingent voters this year to motivate similar turnout. As I wrote in “About that Times Poll,” while Harris has done a terrific job reconsolidating and inspiring Democrats, perceptions of how dangerous a second Trump Administration will be have stalled. If that doesn’t change, we risk that too many of those new voters who came out before will stay home in November. If that happens, it will be an unforgivable failure of the media and civil society to alert Americans to the very avoidable consequences of MAGA regaining power.
Weekend Reading is edited by Emily Crockett, with research assistance by Andrea Evans and Thomas Mande.
Michael Podhorzer @michaelpodhorzer is former political director of the AFL-CIO. Senior fellow at the Center for American Progress. Founder: Analyst Institute, Research Collaborative (RC), Co-founder: Working America, Catalist. He publishes Weekend Reading. (weekendreading.net)
1 That would happen if disproportionately more Trump than Biden voters cast ballots, and/or if more Biden voters cast ballots for Trump than formerly Trump voters cast ballots for Harris.
2 For trivia buffs - Henry Clay lost three times before the Civil War.
3 The six states are Arizona, Georgia, Michigan, Nevada, Pennsylvania and Wisconsin. See The Electoral College Landscape for the rationale. North Carolina is now considered a battleground as well, with some polls showing Harris doing better there than in Georgia. That very well may be. But since Democrats have won the state only once since 1976, for Harris to do so in 2024 will require a significant number of Tar Heels to defect. That’s certainly not impossible, but it is not something that can be anticipated from voter file data.
4 A further problem, lest you throw this back in my face when I’m right, is that other statistical forecasts don’t come with an explanation for the outcome - it’s all very black box. When I say that Kamala Harris is going to win the popular vote, I’m also showing how that will happen based on an accurate model of voting behavior, which I’m disclosing as well.
5 I treat voting for a third party as not voting. All partisan percentages are of the two-party vote.
6 For the curious - the dip around 1972 was a result of the 26th Amendment lowering the voting age to 18. Given low turnout rates for young people, that increased the denominator by substantially more than the numerator. I would associate the jump up in the 2004 presidential election as a precursor to the current MAGA voting rates, as Bush was a lightning rod then.
7 These turnout differentials were consistent across demographic groups. It’s not the case, for instance, that Democrats won simply due to higher turnout from the white college voters who have flocked to their side in recent years. (Read here for more on this point, and more explanation of this turnout rate chart.)
8 Data Sources:1972 to 2008 from NYT exit poll archives; 2012 and 2016 from CCES post-election surveys using validated vote weights; 2020 is an average of the following: National Election pool/Edison polling retrieved from CNN, AP Votecast exit polls published by WSJ, Pew American Trends Panel 78 survey using validated vote weights, and CCES post-election survey using validated vote weights.
9 The percentage of voters defecting is not the percent of the entire electorate; it is the percentage of voters from the specified partisan vote choice in the prior election that voted for an opposite party president in the next election. For example, exit polling estimates that, within the subset of voters who voted for Clinton in 2016 and then voted again in 2020, 4% of those voters voted for Trump in 2020.
10 As you can see, in 2008, there were a lot of Bush-Obama voters, although that was little noticed then or subsequently. ANES polling found that 17 percent of Obama voters in 2008 had been for George W. Bush in 2004. According to CCES data, Obama-Trump voters had previously voted for Republican congressional candidates by a 31-point margin, Republican Senate candidates by a 15-point margin, and Republican gubernatorial candidates by a 27-point margin. (For more.) That was followed in 2012 and 2016, where we see switchers to Republican far outnumbering switchers to Democrats – in other words, the return of many of those Bush-Obama voters to the Republican fold.
In 2008, many of those who voted for Bush twice voted for Obama because of all the factors we’re so familiar with - the crash, Iraq, Katrina, etc. In 2012, we see the lowest level of Republican to Democratic defection in the time series, reflecting the near peak of such defections the previous year.
11 The proportion of those who say they are “undecided” or “independent” in surveys – but who are certain to vote for one party or the other – has been increasing substantially since 2008. As it turns out, however, we can be certain about how many of those who say they are undecided on surveys will vote if they cast a ballot if we ask other questions as well. When I was at the AFL-CIO, we did extensive investigations into finding the best way to determine whether someone was actually undecided between the two candidates or parties.
Here's an example of an experiment we ran that can illustrate what I'm talking about. The standard questions about partisanship are (1) what party the voter supports, and if independent, which way they lean; and (2) which candidate the voter supports, and if not declared, which way they lean. We started tacking a question on at the end along the lines of: Do you always vote for Democrats, usually vote for Democrats, usually vote for Republicans, or always vote for Republicans? We didn’t offer an option like “both sides equally,” which meant respondents had to volunteer such an answer. Given this choice, about 90 percent said they usually or always vote for one or the other party. Then when we conducted panel back surveys after the election, we consistently found that exercise was overwhelmingly correct for those who didn't declare earlier in the survey – and that those who volunteered a different answer usually didn't vote at all.
There’s a reason that question worked so well. The standard party ID question falls short because it asks respondents to own a partisan identity – something many are uncomfortable with. Asking people who they will vote for falls short because all of us are bad at predicting our future behavior. But the end of survey question catches people off guard and asks them to report something that has an objective answer – what did they do.
Also, let’s think about someone who would never vote for Trump but was very unhappy about Biden when he was still in the race. The pollster wants the respondent to answer the question “Will you vote for Biden or Trump?” literally – as in, “If you vote, will you vote for Biden or Trump?” But that respondent, who is anti-Trump but sad about Biden, easily chooses “undecided” to mean they are in some sense reluctant to say they are for Biden.
This is a classic and pervasive error in the media’s analysis of their own polls: they assume that respondents are answering the question the pollster wants them to. Question writing is more difficult than it appears, because what the words mean to the pollster are not always what the words mean to the survey taker. That’s why in our work at the AFL-CIO, we took a cue from the social sciences and always experimented with different ways of asking the same question to be sure that we were getting the responses to the question we intended. Unfortunately, most media polling analysts proceed with complete confidence that the responses are to the question they intended.
We found the most accurate way to identify actually movable voters was with a combination of two questions - asking about the favorability of both candidates (or parties) on a four point scale (very/somewhat favorable/unfavorable). In 2018 and 2020, those who were very unfavorable of only one party – even if they were somewhat unfavorable of the other party – voted against that party about 95 percent of the time. We called the rest “partisan bystanders,” which we split into two subcategories. “Passive bystanders” had a somewhat favorable or unfavorable opinion of both parties; “hostile bystanders” were those who had very unfavorable opinions of both. After each election, most of those who indeed switched sides were partisan bystanders.
12 In 2020 and after, referring to those voting for the first time after 2016; in 2016, referring to those voting for the first time after 2008.
13 Note - in order to generate a comparable category “new voters” for the 2016 election, I looked back to those who had voted in 2008 for an apples to apples comparison.
14 Source: Catalist scores every record on its file with what they call Vote Choice Index (VCI), which is intended to rate the likelihood of that voter having voted for a Democrat. VCI is much more accurate than traditional polling-based modeling because scores are normalized to the actual votes cast in each precinct.
15 For the sake of clarity, this category includes those who had voted before 2016, but not in 2016. Although small in number as a part of this category compared to those voting for the very first time, they are similar in outlook - being either Black voters who had been mobilized by Obama but were lukewarm about Clinton, and those who sat out because they perceived Romney to be a RINO.
16 Even before 2008, we had begun to build turnout models on an individual state basis. The idea was essentially, that if you datamined all the information about voters in the state available on the voter file, you could rank order all the voters on the file in terms of their likelihood of voting. Although the scores were 0 to 100, they were not literally probabilities. Soon after, when demographic characteristics were added, turnout models became the most reliably predictive large scale voter models we had – far more so than, say partisan or vote choice modeling. I’ve moved away from that approach because in the MAGA/Trump era, we can see that what’s on the ballot has become a major factor in whether contingent voters cast ballots. We can see that clearly in the 2022 midterms, where voters with similar turnout scores voted at different rates in the MAGA battlegrounds and the rest of the country. See Red Wave; Blue Undertow.
17 I use words like “about” to modify numbers to remind readers that estimates, even when they deceptively use decimal points, are just that - estimates. And I will almost always use graphic representations for estimated numbers to produce a useful visual margin of error. If I use precise numbers it’s only for administrative records, such as how many people voted in the last election.
18 I use quotation marks to remind the reader these are estimates in a simulation.
19 This is based on how similar voters turned out in earlier elections.
20 This seems reasonable based on how voters so defined turned out in previous cycles - however, as I’ve said, this is now a much bigger group, so I’m extra caveating.
Spread the word