
The Reverend Dr. Martin Luther King Jr. gave his famous “I Have a Dream” speech at the 1963 March on Washington for Jobs and Freedom. Millions of Americans know that speech well enough to paraphrase its concluding passages. But there were nine other speeches that day, calling not just for legal rights, but for jobs and a living wage. On this 50th anniversary year of the March on Washington for Jobs and Freedom, it is critical to revisit this forgotten history of the march.
Yes, the march galvanized the nation, and the civil rights struggle it heralded was among the most inspiring and effective social movements in American—if not world—history. Today, we can celebrate blacks’ equal access to public accommodations, a law against racial discrimination in employment, and black voting rights because of the passage of the Civil Rights Act of 1964 and the Voting Rights Act of 1965.
But the hard economic goals of the march, critical to transforming the life opportunities of African Americans, were not fully achieved. The organizers of the March on Washington for Jobs and Freedom also demanded decent housing, adequate and integrated education, a federal jobs program for full employment, and a national minimum wage of over $13.001 an hour in today’s dollars.2
The key organizers of the march, A. Philip Randolph and Bayard Rustin, understood that improving the socioeconomic position of African Americans required an end to both race- and class-based injustices in America (Anderson 1997, 239–240; March on Washington for Jobs and Freedom 1963b, 3). In his speech at the march, Randolph, president of the Negro American Labor Council, stated:
We have no future in a society in which 6 million black and white people are unemployed and millions more live in poverty. Nor is the goal of our civil rights revolution merely the passage of civil rights legislation. Yes, we want all public accommodations open to all citizens, but those accommodations will mean little to those who cannot afford to use them. Yes, we want a Fair Employment Practice Act, but what good will it do if profit-geared automation destroys the jobs of millions of workers black and white?
For Randolph and other marchers, expanding rights without significantly expanding economic opportunity would still leave African Americans economically disadvantaged.
This is the first in a series of reports from the Economic Policy Institute outlining the steps we need to take as a nation to fully achieve each of the goals of the 1963 March on Washington for Jobs and Freedom. Visit www.unfinishedmarch.com for updates and to join the Unfinished March.
Given that a societal commitment to four of the seven demands was not secured, the March for Jobs and Freedom is incomplete. Blacks in America today are:
- Still in ghettos of poverty. The decent housing that marchers called for is still lacking. In 1963, Whitney M. Young Jr., executive director of the National Urban League, called for African Americans to “march from the rat-infested, over-crowded ghettos to decent, wholesome, unrestricted residential areas disbursed throughout our cities.” But today, nearly half of poor black children live in neighborhoods with concentrated poverty; however, only a little more than a tenth of poor white children live in similar neighborhoods.
- Still in segregated and unequal schools. Marchers demanded adequate and integrated education, but that has not been achieved. In 1963, Roy Wilkins, executive secretary of the NAACP, noted that in the nine years since the 1954 Brown v. Board of Education decision, “our parents and their children have been met with either a flat refusal or a token action in school desegregation.” In the late 1960s, 76.6 percent of black children attended majority black schools. In 2010, 74.1 percent of black children attended majority nonwhite schools. These segregated schools do not have the same resources as schools serving white children, violating the core American belief in equality of opportunity.
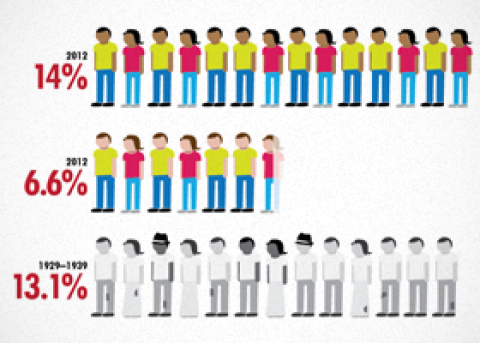
- Still twice as likely to be unemployed. Jobs for all have not been created. In 1963, Walter Reuther, president of the United Automobile Workers of America, asserted, “We will not solve education or housing or public accommodations as long as millions of Americans, Negroes, are treated as second-class economic citizens and denied jobs.” From the 1960s to today, the black unemployment rate has been about 2 to 2.5 times the white unemployment rate. In 2012, the black unemployment rate was 14.0 percent, 2.1 times the white unemployment rate (6.6 percent) and higher than the average national unemployment rate of 13.1 percent during the Great Depression, from 1929 to 1939.
- Still struggling for a living wage. A minimum wage sufficient to lift working families out of poverty is not in place. In 1963, John Lewis, national chairman of the Student Nonviolent Coordinating Committee, said, “We march today for jobs and freedom, but we have nothing to be proud of, for hundreds and thousands of our brothers are not here—for they are receiving starvation wages or no wages at all.” After adjusting for inflation, the minimum wage today—$7.25—is worth $2.00 less than in 1968, and is nowhere close to a living wage. In 2011, a full-time year-round worker needed to earn $11.06 an hour to keep a family of four out of poverty. But more than a third of non-Hispanic black workers (36 percent) do not earn hourly wages high enough to lift a family of four out of poverty.
In this 50th anniversary year of the March on Washington for Jobs and Freedom, we must recommit to the “unfinished march.” This includes constant vigilance to sustain the march’s clear, but still vulnerable, victories. But just as important as sustaining the civil rights goals achieved, we must confront the goals still unmet.
Still in ghettos of poverty
In his speech at the March on Washington for Jobs and Freedom, Whitney M. Young Jr., executive director of the National Urban League, stated:
[Negro Americans] must march from the rat-infested, over-crowded ghettos to decent, wholesome, unrestricted residential areas disbursed throughout our cities. . . . They must march from the play areas in crowded and unsafe streets to the newly opened areas in the parks and recreational centers.
Fifty years later, African Americans still lack full access to decent, wholesome, and safe housing, in large part because black poverty remains high and is very concentrated.
Black poverty, as with poverty overall, declined dramatically through the 1960s, falling from a rate of 55.1 percent in 1959 to 32.2 percent in 1969. Since then, progress in reducing black poverty has been agonizingly slow and uneven. By 1989 the black poverty rate had only declined to 30.7 percent. While the tight labor markets of the late 1990s pushed black poverty to its lowest rate on record—22.5 percent in 2000—the black poverty rate drifted back up in the early 2000s during the anemic recovery from the 2001 recession. The Great Recession that began in December 2007 drove the black poverty rate back up to 27.6 percent by 2011. This was nearly three times the white poverty rate of 9.8 percent that year (U.S. Census Bureau 2012).
Arrested progress in the fight against poverty and residential segregation has helped concentrate many African Americans in some of the least desirable housing in some of the lowest-resourced communities in America. In addition to much higher poverty rates, blacks suffer much more from concentrated poverty. Nearly half (45 percent) of poor black children live in neighborhoods with concentrated poverty, but only a little more than a tenth (12 percent) of poor white children live in similar neighborhoods (Figure A).
Percent of poor children living in areas of concentrated poverty, by race/ethnicity, 2006–2010 average
| Race/Ethnicity | Percent of poor children living in areas of concentrated poverty |
|---|---|
| White | 12% |
| Hispanic | 35% |
| Black | 45% |
| Asian and Pacific Islander | 21% |
| American Indian | 39% |
Note: "Concentrated poverty" is defined as a census tract with a poverty rate of 30 percent or higher.
Source: Kids Count (2012)
Concentrated poverty is correlated with a host of social and economic challenges. Children in neighborhoods with concentrated poverty experience more social and behavioral problems, have lower test scores, and are more likely to drop out of school (Kids Count 2012). Poorer cities tend to have higher crime rates (Kneebone and Raphael 2011, 12), and this relationship likely partially explains why black youth have the highest homicide mortality rates (National Center for Health Statistics 2012, 158–159).
Poor black neighborhoods also have environmental hazards that impact health. A very serious one is higher exposure to lead, which impedes learning, lowers earnings, and heightens crime rates (Acevedo-Garcia 2006, 131; Gould 2009; Centers for Disease Control and Prevention 2013). While rates of lead exposure have been declining for all races, African American children continue to have the highest exposure rate (Gould 2009; Centers for Disease Control and Prevention 2013). Poor black neighborhoods also “have a higher prevalence of alcohol and fast food outlets compared to wealthy and predominantly white neighborhoods” and their residents have “fewer opportunities to be physically active, due to higher crime rates and limited availability of green space” (Acevedo-Garcia 2006, 132).
Among poor children, white children have the lowest likelihood of residing in neighborhoods of concentrated poverty, and thus the best opportunity to access middle-class community resources. In contrast, poor black children have the highest likelihood of living in concentrated poverty, and thus the worst access to middle-class community resources.
African Americans not only disproportionately lack decent housing in neighborhoods of opportunity, a significant number simply lack any housing. In recent years, blacks have made up nearly 40 percent of the population living in homeless shelters although they make up only about 13 percent of the U.S. population (HUD 2012, 16). Undoubtedly, blacks are overrepresented among America’s homeless because they have the highest rate of “severely cost-burdened” renters. Individuals paying half or more of their total income on housing—the severely cost-burdened—are more likely to end up homeless.3
While decent housing is an important goal in and of itself, housing is also linked to health, education, employment, and wealth outcomes. For example, severely cost-burdened renters and homeowners, who are spending at least half of their income on housing, are much less able to save for things such as continued education for themselves or their children, and are thus less likely to reap the employment and wealth benefits advanced education brings. Thus, without greater access to decent housing, the struggle for black socioeconomic advancement will be dramatically harder.
Still in segregated and unequal schools
Speakers at the March on Washington for Jobs and Freedom addressed the need for black children to gain access to adequate and integrated education.
“We will not stop our marching feet until our kids…can study a wide range without being cramped in Jim Crow schools,” vowed James Farmer, national director of the Congress of Racial Equality.4
“[Negro Americans] must march from the congested ill-equipped schools, which breed dropouts, and which smother motivation to the well-equipped integrated facilities throughout the cities,” argued Whitney M. Young Jr.
Roy Wilkins, executive secretary of the NAACP, pointed out that in spite of the 1954 Brown v. Board of Education decision, “for nine years, our parents and their children have been met with either a flat refusal or a token action in school desegregation. Every added year of such treatment is a leg iron upon our men and women.”
Many more years have been added to the delay Wilkins decried. Nearly 60 years after the Brown decision, more than 50 years after the “Little Rock Nine” were escorted by federal troops into Little Rock Central High School, nearly three-fourths (74.1 percent) of black students still attend segregated schools, defined as majority nonwhite (as of 2010, as shown in Figure B). This is nearly the same share as in the late 1960s, when 76.6 percent of black children attended majority black schools.
Share of black children in segregated and intensely segregated schools, 1968–2010
| Segregated (50–100% nonwhite) | Intensely segregated (90–100% nonwhite) | |
|---|---|---|
| 1968–1969 | 76.6% | 64.3% |
| 1980–1981 | 62.9% | 33.2% |
| 1991–1992 | 65.4% | 32.7% |
| 2001–2002 | 71.7% | 38.0% |
| 2009–2010 | 74.1% | 38.1% |
Note: The trend lines reflect a linear interpolation using data points from 1968–1969, 1980–1981, 1991–1992, 2001–2002, and 2009–2010.
Source: Orfield, Kucsera, and Siegel-Hawley (2012, 34)
Although the share of black children in segregated schools had dropped to 62.9 percent by the early 1980s, the subsequent lack of commitment by the federal government and multiple Supreme Court decisions antagonistic to school desegregation have led to a reversal (Orfield, Kucsera, and Siegel-Hawley 2012, 4–5).
This does not discount the positive changes over the last 50 to 60 years. The share of black students in schools that are “intensely segregated,” defined as 90–100 percent nonwhite, was basically cut in half from the late 1960s to the early 1980s. However, there has since been a slight uptick in this key measure: The share of black students in intensely segregated schools rose from the early 1990s to the early 2000s, and stagnated over the following decade.
Promoting school integration is important because—now as a half century ago—segregated schools are unequal schools. The more nonwhite students a school has, the fewer resources it has. A 10 percentage-point increase in the share of nonwhite students in a school is associated with a $75 decrease in per student spending (Spatig-Amerikaner 2012). In comparison with the average school with 90 percent or more white students, the average school with 90 percent or more nonwhite students has $443,000 less to spend on students during the school year, “funding could pay the salary for 12 additional first-year teachers or nine veteran teachers . . . for any number of other useful personnel or resources such as school counselors, teacher coaches, or laptop computers” (Spatig-Amerikaner 2012, 7). Gary Orfield, founder of The Civil Rights Project/Proyecto Derechos Civiles, observes:
In most metropolitan areas, if one were to randomly choose two high poverty segregated high schools and two middle class white and Asian schools, and visit for a day each of the classes purporting to teach the same subject and grade level, the inequalities would become so apparent they would shock the conscience of anyone who truly believes in equal opportunity. (Orfield, Kucsera, and Siegel-Hawley 2012, xvi)
Segregation is fundamentally about the differential distribution of resources. If majority black and majority white schools were equal in the educational opportunities they provided, there would be no reason for them to be racially separate.
Americans view education as an important mechanism for upward mobility, and since the civil rights movement, they largely see equality of opportunity as a right of Americans of all races and ethnicities. Yet in practice, 60 years after the Brown decision, the opportunities offered white children and those offered to black children remain starkly unequal.
Still twice as likely to be unemployed
At the 1963 March on Washington for Jobs and Freedom, Walter Reuther, president of the United Automobile Workers of America, proclaimed that black liberation could not be fully secured without a jobs program to achieve full employment:
We will not solve education or housing or public accommodations as long as millions of Americans, Negroes, are treated as second-class economic citizens and denied jobs. And as one American I take the position, if we can have full employment and full production for the negative ends of war then why can’t we have a job for every American in the pursuit of peace?
Reuther and other march organizers believed that the United States had the wealth to provide a job to everyone who wanted to work, but lacked sufficient political will to do so. They launched the march in part to build that political will. It is shocking how relevant their complaint is today. Recent research shows that economic growth over the last three-and-a-half decades has been more than sufficient to raise living standards for all Americans, but that policies channeled the rewards of economic growth to the top. Among those policies is federal monetary policy that rather than keeping unemployment low, has focused on keeping inflation extremely low, which benefits owners of capital wealth, not workers (Mishel et al. 2012).
Over the last half century, black Americans have always suffered more from high unemployment. In 1963, the unemployment rate was 5.0 percent for whites but 10.9 percent, or 2.2 times the white rate, for blacks.5 The ratio of the black unemployment rate to the white unemployment rate has changed little in the intervening decades, ranging from about 2 times to 2.5 times the white rate (Figure C). It settled at 2.1 times in 2012 (with a black unemployment rate of 14.0 percent, compared with a 6.6 percent rate for whites).
Ratio of black to white unemployment rate, 1963–2012
| Year | Ratio |
|---|---|
| 1963 | 2.180 |
| 1964 | 2.130 |
| 1965 | 2.075 |
| 1966 | 2.333 |
| 1967 | 2.176 |
| 1968 | 2.094 |
| 1969 | 2.065 |
| 1970 | 1.822 |
| 1971 | 1.833 |
| 1972 | 2.039 |
| 1973 | 2.186 |
| 1974 | 2.100 |
| 1975 | 1.897 |
| 1976 | 2.000 |
| 1977 | 2.258 |
| 1978 | 2.462 |
| 1979 | 2.509 |
| 1980 | 2.368 |
| 1981 | 2.451 |
| 1982 | 2.317 |
| 1983 | 2.447 |
| 1984 | 2.596 |
| 1985 | 2.602 |
| 1986 | 2.566 |
| 1987 | 2.584 |
| 1988 | 2.687 |
| 1989 | 2.745 |
| 1990 | 2.563 |
| 1991 | 2.214 |
| 1992 | 2.334 |
| 1993 | 2.339 |
| 1994 | 2.387 |
| 1995 | 2.362 |
| 1996 | 2.509 |
| 1997 | 2.653 |
| 1998 | 2.596 |
| 1999 | 2.417 |
| 2000 | 2.420 |
| 2001 | 2.285 |
| 2002 | 2.162 |
| 2003 | 2.222 |
| 2004 | 2.318 |
| 2005 | 2.445 |
| 2006 | 2.341 |
| 2007 | 2.151 |
| 2008 | 2.118 |
| 2009 | 1.887 |
| 2010 | 1.990 |
| 2011 | 2.190 |
| 2012 | 2.119 |
Note: White and black data before 1979 include Hispanics.
Source: Data from 1963 to 1966 come from the Statistical Abstract of the United States (U.S. Census Bureau 1968); “black” is "nonwhite" data. Data from 1967 to 1971 come from the Statistical Abstract of the United States (U.S. Census Bureau 1973); “black” is "Negro and other" data. Data from 1972 to 1978 come from the Bureau of Labor Statistics Current Population Survey public data series. Data after 1978 are based on the author's analysis of basic monthly Current Population Survey microdata.
Indeed, black America is nearly always facing an employment situation that would be labeled a particularly severe recession if it characterized the entire labor force. From 1963 to 2012, the annual white unemployment rate averaged 5.1 percent, while the annual black unemployment rate averaged 11.6 percent (Figure D). This was 4.9 percentage points higher than the average annual national unemployment rate during the recessions in this period—6.7 percent.
Annual unemployment rate of whites and blacks (1963–2012 average) compared with average annual national unemployment rate during recessions since 1963
| Race | Percentage |
|---|---|
| White | 5.1% |
| Recession | 6.7% |
| Black | 11.6% |
Note: White and black data before 1979 include Hispanics.
Source: Data from 1963 to 1966 come from the Statistical Abstract of the United States (U.S. Census Bureau 1968); “black” is "nonwhite" data. Data from 1967 to 1971 come from the Statistical Abstract of the United States (U.S. Census Bureau 1973); “black” is "Negro and other" data. Data from 1972 to 1978 come from the Bureau of Labor Statistics Current Population Survey public data series. Data after 1978 are based on the author's analysis of basic monthly Current Population Survey microdata.
Even when the national unemployment rate has been low, the African American unemployment rate has been high. For example, in 2000, when the national unemployment rate was 4.0 percent, and the non-Hispanic white unemployment rate was 3.1 percent, the unemployment rate of non-Hispanic blacks was still 7.6 percent. Put another way, even when the economy was booming in 2000, the black unemployment rate was still higher than the average national unemployment rate during recessions.
And when the U.S. economy is in a recession (or still scarred by one), unemployment rates in the black community reach levels seen among the nation as a whole in a depression. For example, in the aftermath of the Great Recession, non-Hispanic white unemployment peaked at 8.0 percent, while the non-Hispanic black unemployment rate rose to 15.9 percent, with non-Hispanic black male unemployment peaking at 18.4 percent. The national unemployment rate averaged 13.1 percent from 1929 to 1939, and peaked at 22.9 percent in 1932 (see the Darby estimates in Margo 1993, 43).
The potential of full employment to lift the economic status of African Americans is hard to overstate. During the late 1990s, when the overall labor market was clearly tight and when black unemployment was at its lowest levels in a generation, black household income relative to white household income rose substantially—more than during any other period since the height of the civil rights movement. In short, equalizing unemployment rates of whites and minorities, and lowering the unemployment rate overall, has enormous potential for fostering economic equality among races.
Without full employment for blacks, it will be impossible for blacks to have low poverty rates. Without full employment for blacks, it will be a tremendous challenge for black children to live up to their potential in school, because parental unemployment impedes children’s educational attainment (Stevens and Schaller 2009; Kalil 2010).
And without full employment for blacks, it will be difficult for many blacks to gain access to decent housing in neighborhoods with resources. As Reuther correctly observed, jobs are the number one prerequisite to solving other social and economic problems confronting blacks.
Still struggling for a living wage
One of the key participants of the 1963 March on Washington for Jobs and Freedom was John Lewis, who is now the U.S. Representative for Georgia’s 5th congressional district, which he has served since 1987. In 1963, Lewis, who was then the national chairman for the Student Nonviolent Coordinating Committee, stated:
We march today for jobs and freedom, but we have nothing to be proud of, for hundreds and thousands of our brothers are not here—for they are receiving starvation wages or no wages at all. While we stand here there are sharecroppers in the Delta of Mississippi who are out in the field working for less than $3.00 a day, twelve hours a day. . . . We need a bill that will ensure the equality of a maid who earns $5.00 a week in the home of a family whose total income is $100,000 a year.
March organizers demanded a minimum wage that could realistically be expected to lift a family out of poverty. Specifically, they demanded a minimum wage of $2.00 an hour (up from $1.15 an hour). We are nowhere near that goal today. Adjusting for inflation, that wage would be more than $13.00 an hour today, close to twice the current federal minimum wage of $7.25. In fact, the inflation-adjusted value of the minimum wage today is about $2.00 less than it was at its peak value in 1968 (Cooper and Hall 2013).
A higher wage floor would provide benefits to economically vulnerable Americans of all races and ethnicities. In 2011, a full-time year-round worker needed to earn $11.06 an hour to keep a family of four out of poverty. But in 2011, more than a third of non-Hispanic black workers (36 percent) did not earn hourly wages high enough to lift a family of four out of poverty (Mishel et al. 2012, 193), even if they worked full time. An astounding 43.3 percent of Hispanics earned poverty-level wages, as did just under a quarter of non-Hispanic whites.
In addition to the minimum wage, Lewis touched on other issues that, had we more effectively addressed, would not still plague American livelihoods today: wage theft and income inequality.
Clearly, wage theft, whereby workers are not paid what they are legally entitled, is still a problem. A recent study of low-wage workers in Chicago, Los Angeles, and New York City found that employers often violated minimum-wage and overtime-pay laws. Nearly one in five black workers (19.1 percent) were paid below the legal minimum wage, and nearly two-thirds (63.9 percent) were not paid the proper wage rate for overtime work (Bernhardt et al. 2009). Thus, some of the lowest-paid black workers are having their earnings effectively stolen by employers.
More generally, income inequality in the United States has grown sharply over the last few decades as households at the top have reaped most of the benefits of economic growth, leaving lower- and middle-class households further behind. For example, from 1979 to 2007, 63.1 percent of total income growth in the American economy went to the top 10 percent of households, leaving 36.9 percent to share among the bottom 90 percent. During this period incomes were relatively stagnant at the bottom and the middle compared with huge growth at the top. Over the 28 years, real annual household income grew 10.8 percent for the bottom fifth of households, 19.2 percent for the middle fifth of households, and a staggering 240.5 percent for the top 1.0 percent of households. This pattern of income growth contrasts sharply with the postwar period, when income growth was broadly shared. (Mishel et al. 2012)
One reason American income inequality is so much more extreme today is because we have allowed the real value of the minimum wage to decline. A minimum wage of $13.00 would allow all full-time, full-year workers to lift families of four out of poverty. Because too many Americans’ expectations about what the U.S. economy can deliver to them have been battered in recent decades, many would see this minimum-wage demand as unrealistically high. But as high as this wage may seem, it is still lower than what the minimum wage would be if it had merely risen in step with gains in economy-wide productivity (Gordon and Schmitt 2013)—a reasonable benchmark for wage increases.
We need policies that ensure workers share in the wealth they help to create. One important step was identified in the demands of the March on Washington for Jobs and Freedom—a minimum wage that can realistically be expected to lift a family out of poverty. Additionally, more-stringent enforcement of labor laws on the books would go further to protect the wages workers do earn. And income inequality is also “fixable,” through addressing the policies that funnel the rewards of economic growth and productivity gains to the top (Mishel et al. 2012).
Conclusion: The Unfinished March
Clearly, the March for Jobs and Freedom is unfinished. Large numbers of African Americans still lack decent, wholesome, and safe housing. African Americans still lack adequate and integrated education. They still lack full employment, and they still lack a guaranteed living wage. These goals were included in the demands for the march because they are essential to blacks’ full social and economic inclusion in American society. In hindsight, the organizers of the march were correct: Achieving rights without fully obtaining the resources to actualize them is only a partial victory. In this 50th anniversary year of the March on Washington for Jobs and Freedom, we can best pay tribute to the march and all that it stood for by recommitting to achieving its unfinished goals.
About the author
Algernon Austin directs the Economic Policy Institute’s Program on Race, Ethnicity, and the Economy (PREE). PREE works to advance policies that enable people of color to participate fully in the American economy and benefit equitably from gains in prosperity. As director of PREE, Austin oversees reports and policy analyses on the economic condition of America’s people of color. Prior to joining the Economic Policy Institute, Austin was a senior fellow at the Dēmos think tank and assistant director of research at the Foundation Center. He received his Ph.D. in sociology from Northwestern University.
Endnotes
1. The value of the wage varies depending on whether one uses the standard consumer price index—i.e., the Consumer Price Index for All Urban Consumers (CPI-U)—or the research series (CPI-U-RS). This value is calculated using the research series.
2. The rallying demands are taken from the March on Washington for Jobs and Freedom (1963a) flyer. The formal demands of the march (March on Washington for Jobs and Freedom 1963b) have redundancies.
3. This definition of “severely cost-burdened” comes from the Joint Center for Housing Studies. Rates of the population who are severely cost-burdened were calculated from data in Joint Center for Housing Studies (2011, 48).
4. James Farmer was in jail and unable to attend the march. His remarks were read by Floyd McKissick (Euchner 2010, 169–174).
5. The white unemployment rate was calculated based on data from the U.S. Census Bureau (1968). The black rate is the nonwhite rate from the U.S. Census Bureau (1968). In 1963, based on an analysis of 1960 and 1970 census data from Ruggles et al. (2013), approximately 90 percent of the nonwhite labor force was black.
References
Acevedo-Garcia, Dolores. 2006. “Racial Disparities in Housing and Health.” In Poverty and Race in America: The Emerging Agendas, ed. Chester Hartman. Lanham, Md: Lexington Books.
Anderson, Jervis. 1997. Bayard Rustin: Troubles I’ve Seen: A Biography. New York: HarperCollins Publishers, Inc.
Bernhardt, Annette, Ruth Milkman, Nik Theodore, Douglas Heckathorn, Mirabai Auer, James DeFilippis, Ana Luz González, Victor Narro, Jason Perelshteyn, Diana Polson, and Michael Spiller. 2009. Broken Laws, Unprotected Workers: Violations of Employment and Labor Laws in America’s Cities. http://www.unprotectedworkers.org/index.php/broken_laws/index.
Centers for Disease Control and Prevention. 2013. “Blood Lead Levels in Children Aged 1–5 Years — United States, 1999–2010.” Morbidity and Mortality Weekly Report, April 5, 245–248. http://www.cdc.gov/mmwr/preview/mmwrhtml/mm6213a3.htm?s_cid=mm6213a3_e.
Cooper, David, and Doug Hall. 2013. Raising the Federal Minimum Wage to $10.10 Would Give Working Families, and the Overall Economy, a Much-needed Boost. Economic Policy Institute Briefing Paper #357. http://www.epi.org/publication/bp357-federal-minimum-wage-increase/.
Current Population Survey basic monthly microdata. Various years. Survey conducted by the Bureau of the Census for the Bureau of Labor Statistics [machine-readable microdata file]. Washington, D.C.: U.S. Census Bureau. http://www.bls.census.gov/ftp/cps_ftp.html#cpsbasic
Euchner, Charles. 2010. Nobody Turn Me Around: A People’s History of the 1963 March on Washington. Boston: Beacon Press.
Farmer, James. 1963. “Message from James Farmer, Congress of Racial Equality National Director, from the Donaldsonville Jail, Donaldsonville, Louisiana, to the March on Washington for Jobs and Freedom, August 28, 1963.” The King Center Digital Archive. http://www.thekingcenter.org/archive/document/message-james-farmer-about-march-washington-jobs-and-freedom#.
Gordon, Colin, and John Schmitt. 2013. “What’s So Bold about $9.00 an Hour? Benchmarking the Minimum Wage.” Dissent, February 27. http://www.dissentmagazine.org/online_articles/whats-so-bold-about-9-00-an-hour-benchmarking-the-minimum-wage.
Gould, Elise. 2009. “Childhood Lead Poisoning: Conservative Estimates of the Social and Economic Benefits of Lead Hazard Control.” Environmental Health Perspectives, vol. 117, no. 7.
Joint Center for Housing Studies of Harvard University. 2011. America’s Rental Housing: Meeting Challenges, Building on Opportunities. http://www.jchs.harvard.edu/sites/jchs.harvard.edu/files/americasrentalhousing-2011.pdf.
Kalil, Ariel. 2010. “How Parental Job Loss and Unemployment Affect Children’s Development.” Paper presented at the Economic Policy Institute conference, “The Scarring Effect of Persistently High Unemployment,” Washington, D.C., Nov. 18.
Kids Count. 2012. “Data Snapshot on High-Poverty Communities.” Annie E. Casey Foundation. http://www.aecf.org/KnowledgeCenter/Publications.aspx?pubguid={DF6A3A0E-9AA3-405E-9FB9-E1D9C80C5E5C}.
Kneebone, Elizabeth, and Steven Raphael. 2011. City and Suburban Crime Trends in Metropolitan America. Brookings Institution, Metropolitan Policy Program. http://www.brookings.edu/~/media/research/files/papers/2011/5/26%20metropolitan%20crime%20kneebone%20raphael/0526_metropolitan_crime_kneebone_raphael.pdf.
Lewis, John. 1963. “Remarks at the March on Washington for Jobs and Freedom” , August 28. The March Begins, WGBH Media Library and Archives Open Vault. http://openvault.wgbh.org/catalog/march-592217-the-march-begins.
March on Washington for Jobs and Freedom. 1963a. “An Appeal to You from James Farmer, Martin Luther King, John Lewis, A. Phillip Randolph, Roy Wilkins, Whitney Young to March on Washington” . In Labor-Management Document Center, M. P. Catherwood Library, Cornell University. Also available from Martin Luther King, Jr. and the Global Freedom Struggle website, Martin Luther King, Jr., Research and Education Institute, Stanford, Calif. http://mlk-kpp01.stanford.edu/primarydocuments/630800-009.pdf.
March on Washington for Jobs and Freedom. 1963b. Organizing Manual No. 2: Final Plans for the March on Washington for Jobs and Freedom. New York: March on Washington for Jobs and Freedom. Available from the Civil Rights Movement Veterans website, Westwind Writers, San Francisco, Calif. http://www.crmvet.org/docs/moworg2.pdf.
Margo, Robert A. 1993. “Employment and Unemployment in the 1930s.” Journal of Economic Perspectives, vol. 7, no. 2, 41–59.
Mishel, Lawrence, Josh Bivens, Elise Gould, and Heidi Shierholz. 2012. The State of Working America, 12th Edition. An Economic Policy Institute Book. Ithaca, N.Y.: Cornell University Press.
National Center for Health Statistics. 2012. Health, United States, 2011: With Special Feature on Socioeconomic Status and Health. Hyattsville, Md.: U.S. Department of Health and Human Services.
Orfield, Gary, John Kucsera, and Genevieve Siegel-Hawley. 2012. E Pluribus…Separation: Deepening Double Segregation for More Students. The Civil Rights Project. http://civilrightsproject.ucla.edu/research/k-12-education/integration-and-diversity/mlk-national/e-pluribus…separation-deepening-double-segregation-for-more-students.
Randolph, A. Philip. 1963. “Remarks at the March on Washington for Jobs and Freedom” , August 28. The March Begins. WGBH Media Library and Archives Open Vault. http://openvault.wgbh.org/catalog/march-592217-the-march-begins.
Reuther, Walter. 1963. “Remarks at the March on Washington for Jobs and Freedom” , August 28. The March Begins. WGBH Media Library and Archives Open Vault. http://openvault.wgbh.org/catalog/march-592217-the-march-begins.
Ruggles, Steven J., Trent Alexander, Katie Genadek, Ronald Goeken, Matthew B. Schroeder, and Matthew Sobek. 2013. Integrated Public Use Microdata Series: Version 5.0 [Machine-readable database]. Minneapolis: University of Minnesota.
Spatig-Amerikaner, Ary. 2012. Unequal Education: Federal Loophole Enables Lower Spending on Students of Color. http://www.americanprogress.org/wp-content/uploads/2012/08/UnequalEduation.pdf.
Stevens, Ann Huff, and Jessamyn Schaller. 2009. Short-run Effects of Parental Job Loss on Children’s Academic Achievement. National Bureau of Economic Research, Working Paper 15480.
U.S. Census Bureau. 1968. Statistical Abstract of the United States. U.S. Department of Commerce. http://www.census.gov/prod/www/statistical_abstract.html.
U.S. Census Bureau. 1973. Statistical Abstract of the United States. U.S. Department of Commerce. http://www.census.gov/prod/www/statistical_abstract.html.
U.S. Census Bureau. 2012. “Table 2. Poverty Status, by Family Relationship, Race, and Hispanic Origin.” Historical Poverty Tables – People. U.S. Department of Commerce. https://www.census.gov/hhes/www/poverty/data/historical/people.html.
U.S. Department of Housing and Urban Development (HUD) Office of Community Planning and Development. 2012. The 2011 Annual Homeless Assessment Report to Congress. Washington, D.C.: U.S. Department of Housing and Urban Development.
Wilkins, Roy. 1963. “Remarks at the March on Washington for Jobs and Freedom” , August 28. The March Begins, WGBH Media Library and Archives Open Vault. http://openvault.wgbh.org/catalog/march-eecfb3-march-highlights-1-of-2.
Young Jr., Whitney M. 1963. “Remarks at the March on Washington for Jobs and Freedom” , August 28. The March Begins, WGBH Media Library and Archives Open Vault. http://openvault.wgbh.org/catalog/march-eecfb3-march-highlights-1-of-2.
Spread the word