
Acknowledgements
The Center for Tax and Budget Accountability would like to thank the following individuals for their time, knowledge and expertise in peer reviewing this report:
Max B. Sawicky, Ph.D, Ph.D. Formerly U.S. Government Accountability Office (retired) and Economic Policy Institute
Professor Robert Bruno, School of Labor and Employment Relations and Director of the Project for Middle Class Renewal at the University of Illinois Urbana-Champaign.
1. Introduction
Illinois has historically been, and remains, one of the most unfair taxing states in the nation. From a textbook standpoint, an “unfair” tax system is a regressive tax system — that is, one that imposes a greater burden on low- and middle-income families than on affluent families, when tax burden is measures as a percentage of income. The reason this is considered unfair is simple: such a system fails to allocate tax burden in a manner that correlates with ability to pay. As it turns out, the failure to build fairness into its tax system has in turn contributed to other, long-term problems facing the state — which range from the state’s ongoing General Fund budget deficits to harming Illinois’ private sector economy.
The reason unfair taxation contributes materially to Illinois’ deficits comes down to simple math: In an era of growing income inequality, the state has opted to focus revenue generation on low- and middle-income families — whose incomes over time are flat to declining after adjusting for inflation — rather than on affluent families, who have realized virtually all growth in income nationally since 1979. Simply put, Illinois’ unfair tax system fails by design to generate adequate revenue to fund core public services by failing to respond to how income growth is distributed in the modern economy. That failure to generate adequate revenue impacts almost everyone, since over 90 percent of all General Fund spending on services goes to education, healthcare, human services, and public safety.
Moreover, because private sector economic growth is driven by consumer spending — which accounts for roughly 66 percent of all economic activity — Illinois’ unfair tax policy also constrains long-term private sector growth in the state. The reason for this again comes down to simple math. Because over time the income of low- and middle-income families has been declining in real, inflation-adjusted terms, these families tend to spend virtually all of their incomes in the local economy. Hence, by focusing its tax burden on low- and middle-income families, Illinois harms their capacity to purchase goods and services in the local economy, thereby diminishing consumer spending and impeding private sector economic growth.
Illinois exacerbates this harm being done to the private sector economy when it cuts spending on core services to compensate for the inadequate revenue generated by its unfair tax system. That is because most General Fund spending covers the wages being earned by the teachers, social workers, healthcare professionals, and correctional officers who provide those services, all of whom happen to be middle income earners and thus good spenders. So when Illinois’ deficit compels service spending cuts, what really happens is the wages of the middle-income workers who provide those service get cut — meaning less consumer spending.
Taken together, the consequences that flow from Illinois’ unfair tax policy create quite the challenge for decision makers: How best to promote private sector growth while overcoming fiscal shortfalls and making its tax system fairer? While no silver bullet exists that will entirely resolve all these challenges, there is one long-term structural policy change that would simultaneously help stimulate private sector growth, tax people more fairly, and reduce Illinois’ General Fund deficits: creating a graduated rate structure for the Illinois individual income tax. Unfortunately, implementing such a change requires amending the Illinois state Constitution, which prohibits using a graduated rate income tax structure to create tax fairness.
2. Key Findings
Illinois’ tax policy is unfair.
- It is textbook capitalist policy that to be fair, a tax system should impose tax burden according to ability to pay — that is, it should impose higher tax burdens on affluent households than it does on low- and middle-income households, when tax burden is measured as a percentage of income.
- Illinois fails this basic standard of fairness by imposing a much higher tax burden as a percentage of income on low- and middle-income households than on high-income households. In fact, Illinois has the fifth most unfair state and local tax system in the country.
- A significant reason for Illinois’ unfair tax system is its Constitutionally mandated “flat” rate income tax, which requires that the state impose the same income tax rate on the earnings of millionaires as it does on the earnings of minimum wage workers.
Illinois’ unfair, flat rate income tax contributes to structural deficits and harms the private economy.
- In addition to being unfair, Illinois’ flat rate income tax also fails to generate adequate revenue to fund core services. This is because a flat rate income tax cannot — by design — respond to the significant growth in income inequality that has occurred over the last three decades.
- By failing to generate adequate revenue, Illinois’ unfair, flat rate income tax has contributed materially to the long-term structural deficits in the state’s General Fund. This in turn has forced decision makers to underfund or cut the core public services of education, healthcare, human services, and public safety, which collectively account for over 90 percent of all General Fund spending on current services.
- Since most General Fund spending on core services covers the wages of the teachers, social workers, health care professionals, correctional officers, and other workers who provide public services, when Illinois’ structural deficit compels the state to reduce spending, it is for the most part cutting the earnings of these workers. Since the economy is driven by consumer spending, and these public sector workers are middle-income earners who are good spenders, General Fund spending cuts become reductions in consumer spending. The research shows that for every dollar the state cuts in General Fund spending on current services, the private sector loses an average of $1.36 in economic activity.
- Similarly, overtaxing low- and middle-income families, who are both good spenders and have flat to declining real incomes over time, reduces their consumer spending, further harming the private sector economy.
Illinois’ flat income tax rate is out of the mainstream.
- Of the 41 US states that impose an individual income tax, Illinois is one of just eight that impose the same flat rate on the income of all earners, regardless of how much they make or their ability to pay.
- Illinois can: simultaneously cut taxes for 98 percent of taxpayers, reduce its structural deficit by $2 billion, and promote private sector economic growth by adopting a Constitutional amendment that permits a graduated rate income tax.
- There are many different rate structures, and related tax policy changes involving items such as credits, that could effectively make Illinois’ tax policy fairer, while raising revenue in a manner that will not impede economic growth. To demonstrate this is possible, CTBA presents two illustrations in this report. One approach uses a middle-class tax credit to reduce the income tax burden of 98 percent of all Illinois taxpayers as compared to current law, while imposing higher tax rates on taxable incomes over $300,000.
- A second option uses a new, lower income tax rate to give tax relief to 98 percent of all Illinois taxpayers while imposing higher rates on taxable incomes above $300,000 in taxable income.
3. Illinois’ Flat Tax Is Unfair to Taxpayers
People have quite different ideas when it comes to what constitutes “fair” taxation. The textbooks, however, don’t. It is in fact a fundamental, capitalist principle of tax policy that to be fair, a tax system ought to allocate tax burden in proportion to ability to pay, when tax burden is measured as a percentage of income. This venerable principle of fairness goes all the way back to 1776, and Adam Smith’s The Wealth of Nations. In this landmark work, Smith specifically endorsed the propositions that:
- tax policy should “remedy inequality of riches as much as possible, by relieving the poor and burdening the rich,” and
- “The subjects of every state ought to contribute toward the support of government as nearly as possible, in proportion to their respective abilities; that is, in proportion to the revenue which they respectively enjoy under the protection of the state.”
Smith championed allocating tax burden in accordance with ability to pay because he theorized that in a capitalist economy, top income classes would gain a disproportionately high share of economic growth over time. The good news is that Adam Smith’s theory can be tested with data. The bad news is that Smith’s theory was spot on. As shown in Figure 1, from 1979–2015, after inflation, 108.4 percent of all growth in family income — or more than all of it — went to the wealthiest ten percent. Meanwhile, the real family income of the bottom 90 percent of American earners was actually lower in 2015 than in 1979.
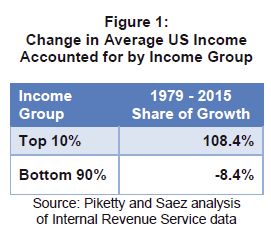
Hence, to be fair, a tax system should focus its burden on those at the top of the income ladder, who would be paying taxes out of their substantially growing wealth, rather than on low- and middle-income families, who in real terms have been paying taxes out of their declining incomes for over three decades.
For two key reasons, among the different methods of taxation generally available to governments, the income tax is the only one that can be used to create fairness in the imposition of tax burden. First, the income tax automatically increases or decreases with a taxpayer’s ability to pay. If someone gets a raise, that person will automatically pay more under an income tax. If, however, someone gets laid off, he or she will pay less. No other tax automatically adjusts its burden in accordance with a taxpayer’s ability to pay.
Second, unique among the different taxes, an income tax can have a graduated rate structure — that is, impose higher marginal tax rates on higher levels of income, and lower rates on lower levels of income. Hence, implementing a thoughtful, graduated rate income tax can make a state’s overall tax burden fair — or at least fairer than it would be without a graduated rate income tax structure.
Using a graduated rate income tax to create tax fairness is a time honored tradition in America that crosses ideological lines. When the modern federal income tax was established in 1913, it only applied to the richest four percent of Americans. Republican presidents Richard Nixon and Ronald Reagan both advocated for creating tax fairness through progressive taxation. Republican President George W. Bush specifically endorsed the concept of progressive taxation in his 2001 budget proposal to Congress, which emphasized that his tax proposal “gives the lowest income families the greatest percentage reduction. Indeed,” Bush emphasized, “higher income individuals will pay a higher share of taxes after (the president’s) plan takes effect.”
The importance of using a graduated rate income tax to create fairness cannot be overstated, given that most other taxes are structurally “regressive” — that is, will take a greater percentage of the income of a low- or middle-income earner than a more affluent earner. For example, a sales tax is simply a set percentage of the purchase price of a product or service. Hence someone earning $10,000 a year will pay the exact same sales tax on the purchase of an item as will a millionaire who buys the same thing. Obviously, the sales tax paid will constitute a greater portion of the income of the worker earning $10,000 than it will of the millionaire’s income.
For these basic policy reasons, most states that levy an income tax use a graduated rate structure. In fact, of the forty-one states that impose an income tax, all but eight have graduated rate structures. Illinois, however, is prohibited by its state Constitution from using the standard practice of creating tax fairness through a graduated rate structure, and must instead apply one flat rate to all levels of income, regardless of ability to pay.
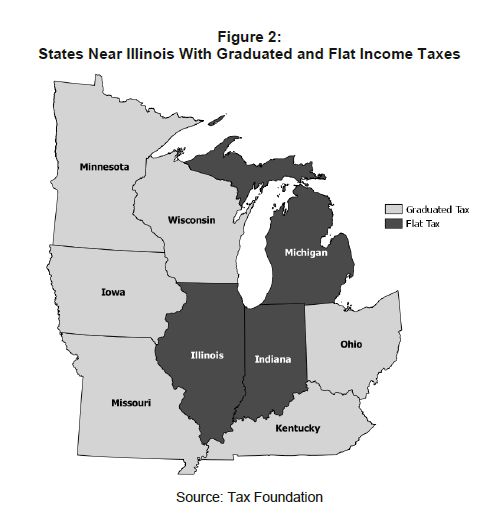
One thing Figure 2 helps demonstrate is that using a graduated rate income tax to create tax fairness has bipartisan support — as traditionally Republican leaning states like Iowa, Missouri, and Kentucky, as well as states that see both Republican and Democratic majorities from time to time like Ohio and Wisconsin, utilize graduated rate structures.
Given that Illinois is constitutionally prohibited from building fairness into its tax system through implementation of a graduated rate income tax, it should come as no surprise that Illinois has one of the most unfair — that is, “regressive” — state and local tax systems in the country, when tax burden is considered as a percentage of income. Combining the tax burden impact of state and local tax policy is crucial to making apples-to-apples comparisons, because each state divides tax funding and service responsibilities between the levels of government differently. According to the Institute for Taxation and Economic Policy, Illinois ranks as the fifth-most-regressive state and local tax system in the country — and the most regressive in the Midwest. In Illinois, the top one percent of income earners pay just 4.6 percent of their income in state and local taxes, while the middle 20 percent of workers pay more than double that, coming in at 10.8 percent of income, and the bottom 20 percent of earners have almost three times the tax burden of the wealthiest, coming in at 13.2 percent.
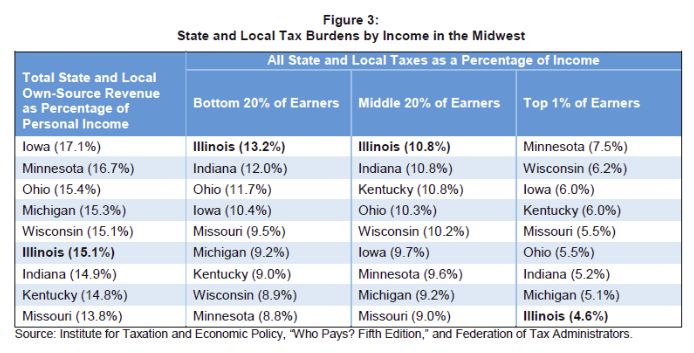
Because Illinois’ tax policy is so regressive, it creates the false perception among the state’s residents that Illinois is a high tax state compared to the rest of the nation. As it turns out, according to the Federation of Tax Administrators, Illinois ranks 27th out of the 50 states and the District of Columbia in total state and local tax burden as a percentage of personal income. But while Illinois is in the bottom half of all states when considering total state and local tax burden as a percentage of personal income, because its system is so regressive, it is in fact a high-tax state for middle- and low-income residents — and hence for most taxpayers. Indeed, for the middle 20 percent of earners, Illinois has the third highest state and local tax burden as a percentage of income nationally, while for the bottom 20 percent of earners, Illinois is second highest. Meanwhile, for the wealthy few, Illinois is truly a low-tax state: Illinois’ total state and local tax burden for the top one percent of earners is lower than all but 16 other states.
The fundamental problem with Illinois’ revenue system is not that it overtaxes the population in total, but rather that it distributes the burden of supporting public services in a highly unfair way that ignores ability to pay, by overtaxing most people, who happen to be low- and middle-income.
The flip side of this coin is that Illinois undertaxes wealthy families. Given the growth in income inequality over the last 30 years that is highlighted in Figure 1 above, undertaxing people at the top of the income ladder is tantamount to a failure to respond to how income growth is distributed in the modern economy. And precisely because it fails to respond to how income growth is distributed in the modern economy, Illinois’ unfair, flat rate income tax fails to generate adequate revenue to fund core services.
4. Illinois’ Unfair, Regressive Tax System Contributes to the Structural Deficit in the State General Fund and Hurts the Private Sector Economy
CTBA projects that Illinois will end Fiscal Year (FY) 2018 with an accumulated General Fund deficit of $9.24 billion. That’s a matter for some concern, given that total FY2018 General Fund spending on current services is scheduled to be $24.97 billion. In other words, fully 37 percent of all FY2018 General Fund spending on current services will essentially be deficit spending. And that understates the scope of the problem: If not for the sale of $6 billion in bonds authorized to pay down past-due bills in FY2018, the accumulated deficit would be nearly $15.24 billion — or 61 percent of all current services spending in FY2018.
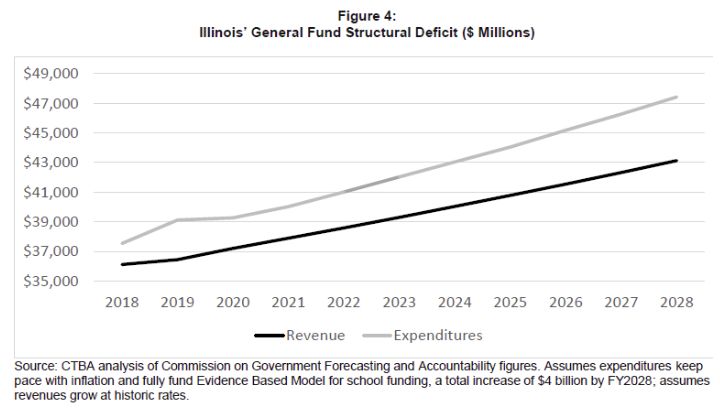
While the state’s fiscal condition worsened materially during the two-year budget standoff over the FY2016-FY2017 sequence, Illinois’ deficits neither began with that budget crisis, nor did they end with the passage of the FY2018 budget. Rather, Illinois has for generations suffered from a “structural deficit”: that is, adjusting solely for inflation and population changes, and assuming a normal economy and no changes in law, the cost of providing public services has grown with the economy and population over time, but state revenues have not. Hence, even when Illinois does not add or expand any public services from year to year, its fiscal system nonetheless generates a deficit. The current structural deficit is depicted in Figure 4.
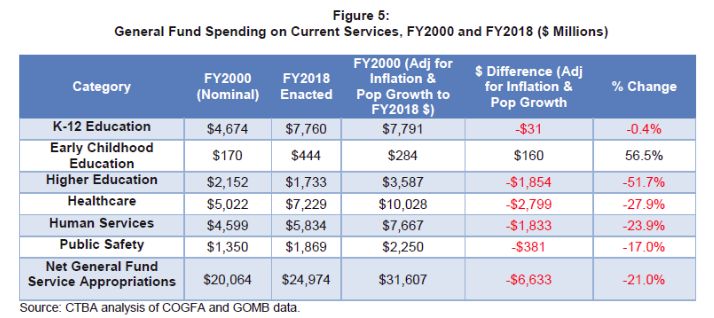
This structural deficit has persisted despite major cuts in current service spending over the past two decades. In fact, after adjusting for inflation and population growth, when FY2018 spending on current services is compared to FY2000, it shows that Illinois in real terms has materially reduced funding for every main category of services covered by the General Fund — Education, Healthcare, Human Services, and Public Safety — except for Early Childhood Education. As shown in Figure 5, real funding for Public Safety has fallen 17.0 percent over this sequence, while funding for Human Services has fallen 23.9 percent; for Healthcare, 27.9 percent; and for Higher Education, a shocking 51.7 percent.
Given how significant the reductions in spending have been over time, the data clearly show that, to a great extent, Illinois’ structural deficit is driven by an inadequate revenue system that fails to keep pace with the modern economy. (The other major contributor to Illinois’ structural deficits, the unaffordable statutory plan for repaying debt owed to the state’s public pension systems known as the “Pension Ramp,” is covered in other CTBA publications, including “Pension Changes in the FY2018 Budget: Short-Term Savings and Long-Term Costs,” published in October 2017.)
There are a number of ways in which Illinois’ tax policy fails to respond to the modern economy. For example, consumer spending in Illinois, as in the rest of the nation, has largely shifted over the last 30 years from the purchase of goods to services. Despite this, Illinois’ sales taxes do not apply to the vast majority of service purchases consumers make, leaving what is now both the largest and fastest growing segment of the modern economy largely out of the state’s tax base. This is one key reason the Illinois tax system fails to generate revenue that keeps pace with the inflation adjusted growth in the cost of providing even the same level of core public services over time.
The constitutional prohibition on using a graduated rate structure creates a similar dynamic with the state’s income tax. Since the 1970s, growing income inequality has meant that over time, high-income households in all 50 states — including Illinois — have realized a greater proportion of income growth, and hence a greater share of overall income. If Illinois were able to implement a graduated rate income tax structure, the state’s tax system could respond to this economic reality by imposing higher tax rates on higher levels of income and lower rates on lower levels of income. This in turn would make two structural improvements to the state’s tax system. On the one hand, revenue growth would be enhanced over time to the point where it would more accurately correspond to long-term economic growth. Moreover, tax burden could be distributed more fairly among taxpayers, by having income tax rates correspond to ability to pay. Better still, the increased revenue would be raised from taxpayers who would be paying from their substantially growing wealth. This means consumer spending would not be materially harmed by the tax increase, as high-income families have such substantially growing incomes over time that they tend not to spend less in the consumer economy when taxed more. In addition, the new revenue would go to fund public services like education, health care, and social services that could help counter the social mobility and related negative impacts of increasing income inequality.
Unfortunately, precisely because current Illinois policy both imposes tax burden unfairly and fails to generate adequate revenue — which in turn forces spending cuts — Illinois’ flat rate income tax structure harms Illinois’ state economy. This is for two reasons. First, it takes a disproportionate share of the incomes of working- and middle-class families, who tend to spend most if not all of their earnings, because after inflation their incomes have been declining in real terms since 1980. In economic terms, this means they have a high marginal propensity to consume, or “MPC.” That simply means they tend to spend every additional dollar they gain in income. Similarly, when their incomes are diminished through undue tax burden — as they are in Illinois — that dollar of lost income generally translates to a dollar of lost consumer spending, which has a negative multiplier effect on the private sector economy. The reason this harms the economy is simple: Most economic activity, upwards of 66 percent, is consumer spending.
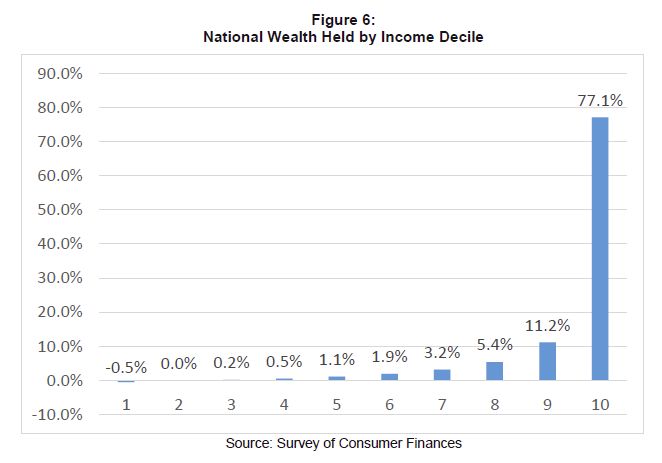
Conversely, more affluent individuals have a low MPC, which should not be surprising, given that, after inflation, more than all the growth in income in America since 1979 has gone to the wealthiest 10 percent of income earners. Indeed, not only have the top 10 percent realized all inflation adjusted income growth in America over the last 40 years, but they also hold 77 percent of total national wealth, as shown in Figure 6. Hence, when taxes are raised on higher levels of income, said tax increases do not materially reduce the consumer spending habits of wealthy individuals. So, a well-designed graduated rate income tax that provides tax relief to low- and middle-income families, and raises revenue from wealthier families, can actually result in a net positive multiplier for the private sector economy by stimulating consumer spending.
Second, as analyzed previously, Illinois’ flat rate income tax generates inadequate revenue, which contributes to the structural deficit in the state’s General Fund, which in turn compels reduced spending on core public services. Research shows that reductions in spending on public services have a serious negative effect on the private sector economy. The reasons for this are simple. Most General Fund spending on services is used to cover the wages of the teachers, social workers, healthcare professionals, correctional officers, and other public employees who provide services to the public. These people also happen to be middle-income workers, with high “marginal propensities to consume.” Hence, a dollar spent on public services becomes wages for workers, which becomes consumer spending in the private economy.
However, when state government is forced to reduce spending on current services due to inadequate revenue generation from its tax system, that reduction is primarily made up of wage cuts to the aforesaid middle-income public sector workers. Given that they have high marginal propensities to consume, this results in reduced consumer spending, harming the state’s private sector economy.
These costs and benefits have been quantified through the work of Mark Zandi, chief economist at Moodys.com, who has developed a series of “multipliers” that indicate how various kinds of public expenditures affect private sector economic activity. Zandi found that spending on general state services had a multiplier of 1.36 — meaning that for every dollar of state spending, there was a benefit to the overall economy of $1.36. For comparison, permanent income tax cuts had substantially lower multiplier values, closer to 0.29.
These dynamics have played out in real life over the last several years in two Midwestern states: Kansas and Minnesota. In 2012, Kanas cut its top personal income tax rate from 6 percent to 4.5 percent, reducing state revenue by over $900 million by FY2017. One year after Kanas’ cut, Minnesota raised its personal income taxes, with a top rate of 9.85 percent — the fourth-highest top marginal rate in the nation — generating over $1 billion in budget surplus.
Since then, Minnesota has substantially outperformed Kansas in job growth. Though employment growth had already been faster in Minnesota than in Kansas during the initial recovery to the Great Recession, that gap widened notably in the years after 2013, with Minnesota continuing to add jobs at a steady pace and Kansas’ job growth stalling out, and ultimately beginning to decline around 2015. Figure 7 shows the job trends in both of these states since 2009.

Given what the evidence shows about the interaction between state fiscal policy and the private sector economy, one thing is clear: when done properly, utilizing a graduated tax rate to build fairness and responsiveness into a tax system not only doesn’t harm a state’s economy, but can in fact help stimulate it.
5. Cutting Taxes for 98 Percent of Illinois Taxpayers While Reducing the Structural Deficit
The bottom line: Illinois’ unfair flat rate income tax structure over-burdens low- and middle-income families; contributes to the state’s significant and growing structural deficit that threatens crucial public services like education and healthcare; and harms the state’s private sector economy. One sure way to counter each of these negative consequences is for Illinois to join the majority of states that have an income tax by moving to a graduated rate structure. That requires a constitutional amendment.
If such an amendment passes, there are various paths decision makers can take to designing a rate structure that both creates more tax fairness by reducing income tax burden on low- and middle-income families, and generates new revenue from more affluent taxpayers, thereby responding to the modern economy and helping reduce the state’s structural deficit.
To illustrate this point, CTBA has modeled out two theoretical approaches which demonstrate what a graduated income tax in Illinois might look like. One uses a middle-class tax credit as the main vehicle for providing tax relief to low- and middle-income families, while the other uses lower rates at lower levels of income to accomplish this goal.
Both of these graduated rate income tax proposals would:
- Cut taxes for the bottom 98 percent of Illinois taxpayers;
- Limit the top marginal rate to levels that already exist in the Midwest; and
- Reduce the structural deficit by $2 billion in the first year of implementation.
The first, credit-based rate structure approach option is depicted in Figure 8.
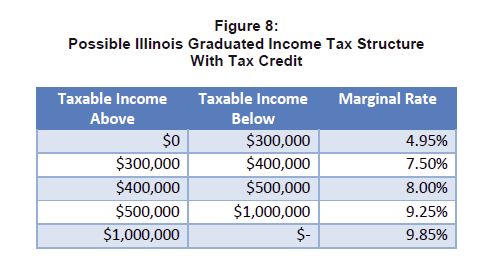
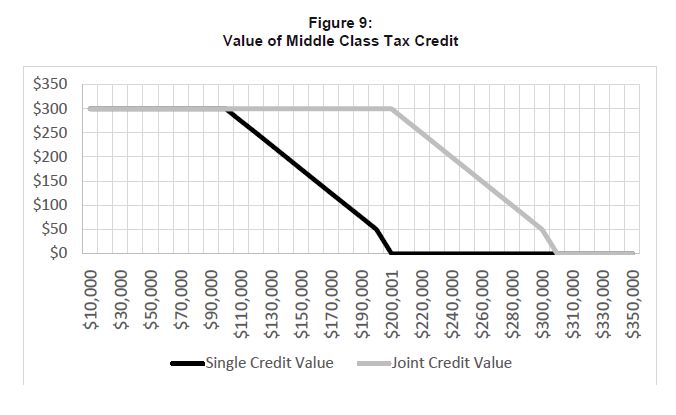
You will note, the structure outlined in Figure 8 keeps the state’s current income tax rate as the lowest rate. However, the income tax burden of the bottom 98 percent of taxpayers is still reduced from current law by coupling the rate structure in Figure 8 with the $300 income tax credit illustrated in Figure 9. Under this approach, more than 91 percent of Illinois taxpayers get an immediate reduction in state income tax liability of $300, including all taxpayers making under $100,000 if filing singly, or $200,000 if filing jointly. The value of the credit is phased down as incomes increase, however another seven percent of taxpayers will nonetheless get a tax credit of between $50 and $300, as the credit phases out at $200,000 of taxable income if filing singly, or $300,000 if filing jointly.
The approach outlined in Figure 8 also gradually increases marginal income tax rates for the roughly two percent of Illinois taxpayers whose taxable income is above $300,000 per year. Taxable income between $300,000 and $400,000 would be subject to a marginal tax rate of 7.50 percent; taxable income between $400,000 and $500,000 would be subject to a marginal tax rate of 8.00 percent; taxable income between $500,000 and $1 million would be subject to a marginal tax rate of 9.25 percent. The highest bracket, which would apply to taxable income above $1 million, would be set at the top marginal income tax rate in Minnesota, or 9.85 percent. For comparison, in prospering Minnesota, this top rate of 9.85 percent applies to much lower levels of income, which start at just $160,020 for single filers and $266,700 for joint filers.
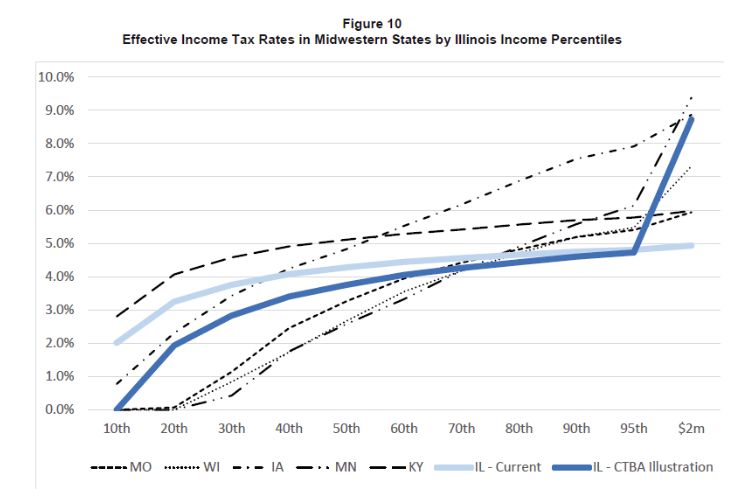
Under this approach, 98 percent of Illinois taxpayers would realize a tax cut compared to the current law — with 91 percent either receiving the full value of the $300 middle-class tax credit, or having all of their state income tax bill eliminated in its entirety, if that total is under $300. It would also reduce the total tax burden as a percentage of income Illinois imposes on low- and middle-income taxpayers to be more in line with those of other Midwestern states. Figure 10 shows the effective tax rates — that is, the total amount of income taxes paid divided by income — by taxable income for Illinois under the approach outlined in Figures 8 and 9, as well as those of nearby states applied to Illinois taxpayers.
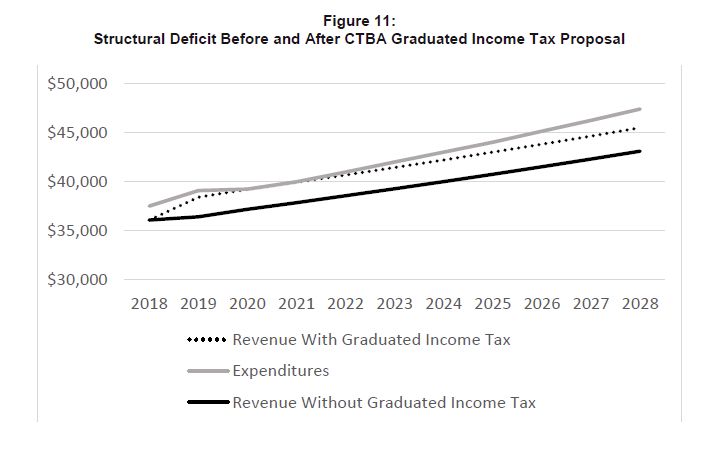
Finally, the approach outlined in Figures 8 and 9 would also raise upwards of $2 billion a year to help close the state’s structural deficit. A rough projections of how this reduces that structural deficit is shown in Figure 11.
A second approach that relies solely on the design of the rate structure to accomplish the twin goals of tax fairness and revenue generation is outlined in Figure 12.
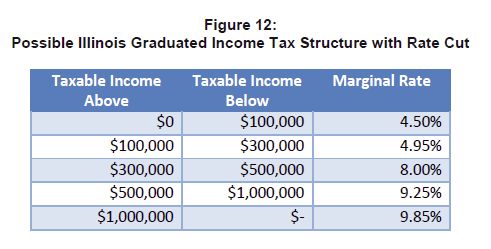
Under this approach, anyone making under about $314,000 of taxable income — or more than 98 percent of Illinois taxpayers — would see a tax cut of up to $450 from current law.
That’s because the first $100,000 of all filers’ income would be taxed at 4.50 percent, rather than the current 4.95 percent. The next $200,000 of income, up to a total of $300,000, would be taxed at the current rate of 4.95 percent. Income between $300,000 and $500,000 would be taxed at 8.0 percent; income between $500,000 and $1 million would be taxed at 9.25 percent; and income above $1 million would be taxed at 9.85 percent.
This approach would also raise about $2 billion in revenue to help close the state’s structural deficit.
6. Conclusion
Illinois’ current tax system is unfair, because it fails to tax people according to their ability to pay. Illinois’ flat rate income tax is one of the main reasons for this inherent unfairness. Indeed, Illinois’ tax system is so unfair that it ranks as the fifth-most-regressive taxing state in the nation when total state and local tax burden as a percentage of income is considered. Illinois’ tax system is so unfair that it perversely overtaxes most people by focusing tax burden on low- and middle-income families, while materially undertaxing wealthy families. This in turn creates the mistaken impression that Illinois is high tax overall, when in fact the data show that Illinois is below the national average in terms of total state and local tax burden as a proportion of total income.
Illinois’ flat tax also contributes to the structural deficit that is causing the state to accumulate unpaid bills and reduce spending on core state services like education, healthcare, public safety, and human services.
This in turn not only denies adequate levels of core services to communities across Illinois, but also harms the state economy.
Illinois can begin to remedy these problems by implementing a graduated income tax structure like those illustrated in this paper, which apply lower rates to lower levels of income and higher rates to higher levels of income in a manner that both provides tax relief to 98 percent of Illinois taxpayers and shrinks the structural deficit by some $2 billion a year.
Under such an approach, 49 out of 50 Illinois taxpayers would see a reduction in their income tax burden. Meanwhile, top marginal income tax rates would be no higher than rates that already exist in the Midwest.
As a result, the state tax system would become fairer, more sustainable, and better for the Illinois economy. All that’s needed is the bipartisan political will to amend the state’s Constitution to allow a graduated rate income tax in Illinois.
Institute on Taxation and Economic Policy. “Who Pays? A Distributional Analysis of the Tax Systems in All 50 States,” 3rd and 5th editions. 2009 and 2015.
Piketty and Saez, “Income Inequality in the United States, 1913–1998”, Quarterly Journal of Economics, 118(1), 2003, 1–39 (Tables and Figures Updated to 2015 in Excel format, January 2013), http://eml.berkeley.edu/~saez/
Senator Bob Casey. “How Continuing the payroll Tax cut and Federal UI Benefits Will Help American Families and Support the Recover.” A Report by the U.S. Congress Joint Economic Committee. January 24, 2012.
Zandi, Mark. “Assessing the Macro Economic Impact of Fiscal Stimulus 2008.” Moody’s Economy.com. January 2008. https://www.economy.com/mark-zandi/documents/Stimulus-Impact-2008.pdf
Illinois State Constitution. Article IX, Section 3. http://www.ilga.gov/commission/lrb/con9.htm
Institute on Taxation and Economic Policy. “Who Pays? A Distributional Analysis of the Tax Systems in All 50 States,” 3rd and 5th editions. 2009 and 2015.
Piketty and Saez, “Income Inequality in the United States, 1913–1998”, Quarterly Journal of Economics, 118(1), 2003, 1–39 (Tables and Figures Updated to 2015 in Excel format, January 2013), http://eml.berkeley.edu/~saez/
Zandi, Mark. “Assessing the Macro Economic Impact of Fiscal Stimulus 2008.” Moody’s Economy.com. January 2008. https://www.economy.com/mark-zandi/documents/Stimulus-Impact-2008.pdf
Income distributions from Illinois Department of Revenue and IPUMS Current Population Survey.
Smith, Adam. Wealth of Nations. W. Strahan and T. Cadell, London, 1776.
Smith, Adam. Wealth of Nations. W. Strahan and T. Cadell, London, 1776.
Piketty and Saez, “Income Inequality in the United States, 1913–1998”, Quarterly Journal of Economics, 118(1), 2003, 1–39 (Tables and Figures Updated to 2015 in Excel format, January 2013), http://eml.berkeley.edu/~saez/
Federal Income Tax of 1913, Major Acts of Congress. Ed. Brian K. Landsberg. Macmillen-Thomson Gale, 2004.
A Blueprint New Beginnings: A Responsible Budget For America’s Priorities. 2001.
Tax Foundation, “State Individual Income Tax Rates and Brackets: 2017.” March 9, 2017. https://taxfoundation.org/state-individual-income-tax-rates-brackets-2017/
(Two other states, New Hampshire and Tennessee, only tax dividend and interest income.)
Illinois State Constitution. Article IX, Section 3. http://www.ilga.gov/commission/lrb/con9.htm
Institute on Taxation and Economic Policy. “Who Pays? A Distributional Analysis of the Tax Systems in All 50 States,” 3rd and 5th editions. 2009 and 2015.
Institute on Taxation and Economic Policy. “Who Pays? A Distributional Analysis of the Tax Systems in All 50 States,” 3rd and 5th editions. 2009 and 2015.
Institute on Taxation and Economic Policy. “Who Pays? A Distributional Analysis of the Tax Systems in All 50 States,” 3rd and 5th editions. 2009 and 2015.
Federation of Tax Administrators, “2015 State & Local Revenue as a Percentage of Personal Income.” https://www.taxadmin.org/2015-state-and-local-revenue-as-a-percentage-of-personal-income. Note: Includes all own-source revenue, including taxes and fees.
Federation of Tax Administrators, “2015 State & Local Revenue as a Percentage of Personal Income.” https://www.taxadmin.org/2015-state-and-local-revenue-as-a-percentage-of-personal-income
CTBA analysis of GOMB and COGFA data.
CTBA analysis of GOMB and COGFA data.
Kaeding, Nicole. “Sales Tax Base Broadening: Right-Sizing a State Sales Tax.” Tax Foundation. October 24, 2017. https://taxfoundation.org/sales-tax-base-broadening/
Piketty and Saez, “Income Inequality in the United States, 1913–1998”, Quarterly Journal of Economics, 118(1), 2003, 1–39 (Tables and Figures Updated to 2015 in Excel format, January 2013), http://eml.berkeley.edu/~saez/
Piketty and Saez, “Income Inequality in the United States, 1913–1998”, Quarterly Journal of Economics, 118(1), 2003, 1–39 (Tables and Figures Updated to 2015 in Excel format, January 2013), http://eml.berkeley.edu/~saez/
Zandi, Mark. “Assessing the Macro Economic Impact of Fiscal Stimulus 2008.” Moody’s Economy.com. January 2008. https://www.economy.com/mark-zandi/documents/Stimulus-Impact-2008.pdf
Hobson, Jeremy. “As Trump Proposes Tax Cuts, Kansas Deals with Aftermath of Experiments.” NPR. October 25, 2017. https://www.npr.org/2017/10/25/560040131/as-trump-proposes-tax-cuts-kansas-deals-with-aftermath-of-experiment
Montgomery, David. “Minnesota budget surplus grows — now what will lawmakers do with it?” Twin Cities Pioneer Press. February 28, 2017. https://www.twincities.com/2017/02/28/minnesotas-projected-budget-surplus-raised-to-1-65-billion/
Tax Foundation. “State Individual Income Tax Brackets 2017.” https://taxfoundation.org/state-individual-income-tax-rates-brackets-2017/
Spread the word