
When Tyler Caforio started doing landscaping work back in 2012, winter meant plowing every weekend bundled up in a heavy coat as he added to already sky-high snowbanks that refused to budge, thanks to persistent cold.
Only 11 years later, that’s changed. A lot. If it snows, he can usually toss on just a sweat shirt to go out for the day. And the unfrozen ground quickly turns snow to slush, “like pudding on asphalt ... it’s just a big mess,” he said.
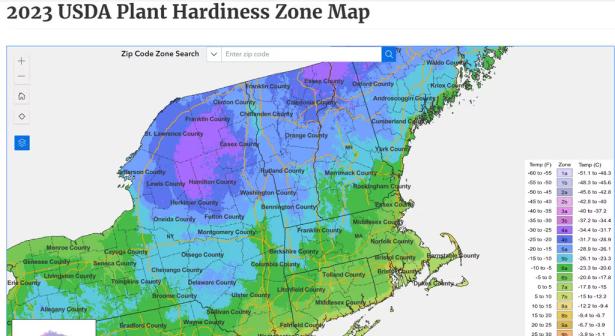
Caforio’s business in Ashburnham, in north-central Massachusetts, is in one of several parts of the state that have experienced a pronounced shift in its winter temperatures. The latest proof of that comes not in an academic finding or scientific report, but in an update this week of the US Department of Agriculture’s plant hardiness map — a guide for would-be planters wondering how much cold their plants need to withstand.
Compared to the former map, which was from 2012 and looked at extreme minimum temperatures from 1976 to 2005, the new map eliminates or shrinks the coldest zones, reflecting a state that is transitioning to a warmer climate. The new map looks at data from 1991 to 2020.
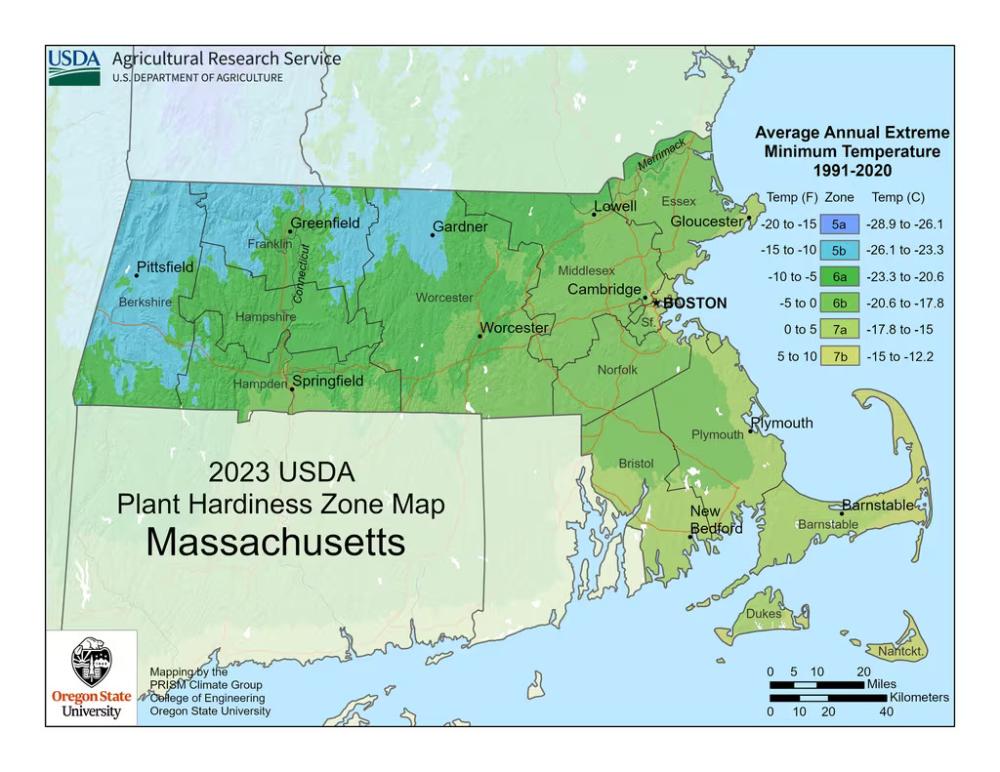
2023 Plant hardiness mapUSDA
Gone are the pockets across north-central and western parts of the state where temperatures could be expected to hit 20 to 15 degrees Fahrenheit below zero at least once in the winter. And while once nearly half the state could expect to dip down to 15 to 10 degrees below zero at some point each winter, only the far western and north-central portions are now classified that way.
On its own, the transition shown by the plant hardiness maps could seem like a good thing for home gardeners — a rare silver lining in the doom and gloom of climate change. After all, what landscaper, professional or amateur, wouldn’t like to hear that their plants could fare better than in the past? Except (sorry) it’s not that simple.
Climate change doesn’t just bring warmer temperatures. It also brings more extreme weather and more variability — such as the whiplash from Massachusetts’ record drought of 2022 to the extreme rains of 2023.
Francine Shear, owner of Echobrook Nursery in Worcester, said that’s posing big risks for plants. “This year was a very rainy season for the fall and we lost a lot of crops,” she said. But the year before, the drought was particularly hard on plants. Worcester was among the locations that the USDA maps indicated had experienced a shift in its hardiness zone.
Caforio said he encountered this problem earlier this year. “We did a big install — upwards of 100 plantings on this hillside,” he said. Then came the extreme rains that dropped 11 inches in less than five hours in nearby Leominster. “The plants uprooted out of the ground because they didn’t have any root structure.” He suggested landscapers take the extra step of staking down bigger plants, like shrubs, “or your profits will be all over the yard.”
Another lesson learned: With a rainier summer in general, he needed to cut lawns a quarter to a half-inch shorter so the grass was more likely to dry completely in between rains, or risk growing moss.
This not-quite-so-frigid-winter-anymore trend can be seen nationally. “Overall, the 2023 map is about 2.5 degrees warmer than the 2012 map,” said Christopher Daly, director of Oregon State University’s PRISM Climate Group, which helped develop the map.
Still, it’s not definitively clear that the changes in the map are yet another example of global warming, cautioned the USDA, because some weather variability is natural.
But climate scientist Michael Rawlins, of the University of Massachusetts Amherst, said the change is in line with how the shifting climate is affecting the region. “There should be no doubt that a warming climate attributable to human activities, namely the burning of fossil fuels, is the dominant influence on these changes,” he said.
It’s not just the minimum temperatures that are increasing, said Edwin Sumargo, a climate scientist with the state’s newly formed Office of Climate Science. “As we’ve seen in the weather patterns this year, with climate change, we expect to see a long-term warming trend in overall average temperature as well as the lowest temperature each year,” he said. And while he said further study is needed to attribute the change in the USDA maps to climate change, he noted that with time “we will see the trend the USDA maps suggest more and more clearly.”
Massachusetts’ average winter temperature has increased 3 degrees since 1970, according to data compiled by independent research organization Climate Central. That includes that crucial transition, the one from less snow to more slush. In Massachusetts, the average winter temperature has been above freezing for much of the past two decades.
Despite the new guidance from the USDA making it clear how temperatures have shifted in the state, neither Shear nor Caforio, the plant nursery owner and landscaper, suggested that Massachusetts residents start changing their perennials out just yet.
“In the future, if it’s going to continue to get warmer and warmer, we’ll be able to plant more kinds of plants,” Caforio said.
But asked whether he expects to ever be planting palm trees?
“Not in my lifetime,” he said.
Sabrina Shankman can be reached at sabrina.shankman@globe.com. Follow her @shankman.
Spread the word