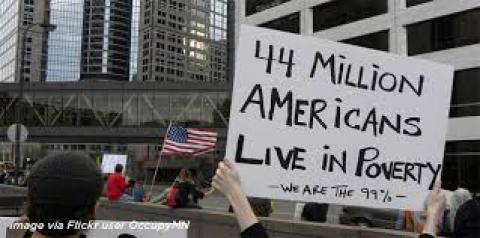
Since President Lyndon B. Johnson launched the War on Poverty 50 years ago, the characteristics of the nation’s poor have changed: A larger share of poor Americans today are in their prime working years and fewer are elderly. In addition, those in poverty are disproportionately children and people of any age who are black, Hispanic or both.
But perhaps just as striking is that the geographic distribution of the poor has changed dramatically, too. A new Pew Research Center analysis of U.S. Census Bureau data finds that the South continues to be home to many of America’s poor, though to a lesser degree than a half-century ago. In 1960, half (49%) of impoverished Americans lived in the South. By 2010, that share had dropped to 41%.
Much of the geographic shift of poverty reflects general trends in population shifts across the country over that same period. As rural areas, such as in the Midwest, have become less impoverished since the 1960s, those areas make up a smaller share of the U.S. population overall. At the same time, urban centers have gained in total population and hold a greater share of the U.S. population overall.
For example, in 1960, places like Maine and North Dakota had higher poverty rates than many of the nation’s biggest metro areas. But by 2010, the reverse was true: High-poverty areas were in counties that are a part of the nation’s largest metro areas such as Chicago, Los Angeles and New York, but not in places like Nebraska and South Dakota. At the same time, the share of the population in the nation’s urban areas increased from 70% to 81% over that 50-year period.
And much of the South still struggles with poverty. Of the 16 Southern states, only Maryland and Delaware had a poverty rate below the national average in 1960. Among the 14 Southern states with poverty rates higher than the U.S. average that year, only Virginia’s had dropped below the national mark by 2010.
Over the past 50 years, the poor have increasingly lived in the 20 most populous counties. In 2010, about one-in-five poor Americans (21%) lived in these high-density counties such as Los Angeles in California, Queens in New York and Clark in Nevada, up from 14% in 1960.
As a result, many of the nation’s biggest counties by population had high poverty rates in 2010, though that was not the case in 1960. Twelve of today’s most populous counties had poverty rates above the national average in 2010, including Los Angeles, Cook (Chicago) in Illinois, Maricopa (Phoenix) in Arizona, Kings (Brooklyn) in New York, and Dallas. In 1960, eight of these 12 counties had poverty rates below the national average. Another three had poverty rates above the national average in both 1960 and 2010: Bexar (San Antonio) in Texas, Miami-Dade in Florida, and New York (Manhattan). And one county, Broward (Ft. Lauderdale) in Florida, had a poverty rate that was above the national average in 1960 but dipped below the average by 2010.
It’s worth noting that as the geography of poverty-stricken areas has shifted, the nation’s official poverty rate has declined over the past half-century, from 22.1% in 1960 to 14.5% in 2013, according to Census Bureau data.
Even in some of the nation’s poorest regions, the poverty rate has declined. In Appalachia, the poverty rate remains above the national average, but has been cut nearly in half (from 30.9% in 1960 to 16.6% in 2010). Poverty is also entrenched in Texas counties that share a border with Mexico. In 12 border counties home to colonias – residential areas that lack basic infrastructure like clean water, septic or sewer systems, or electricity – the poverty rate has dropped from 49% to 31% over the same time period.


Spread the word