Leaning back in his chair, Jonathan Mattingly swings his legs up onto his desk, presses a key on his laptop and changes the results of the 2012 elections in North Carolina. On the screen, flickering lines and dots outline a map of the state’s 13 congressional districts, each of which chooses one person to send to the US House of Representatives. By tweaking the borders of those election districts, but not changing a single vote, Mattingly’s maps show candidates from the Democratic Party winning six, seven or even eight seats in the race. In reality, they won only four — despite earning a majority of votes overall.
Mattingly’s election simulations can’t rewrite history, but he hopes they will help to support democracy in the future — in his state and the nation as a whole. The mathematician, at Duke University in Durham, North Carolina, has designed an algorithm that pumps out random alternative versions of the state’s election maps — he’s created more than 24,000 so far — as part of an attempt to quantify the extent and impact of gerrymandering: when voting districts are drawn to favour or disfavour certain candidates or political parties.
Gerrymandering has a long and unpopular history in the United States. It is the main reason that the country ranked 55th of 158 nations — last among Western democracies — in a 2017 index of voting fairness run by the Electoral Integrity Project, an academic collaboration between the University of Sydney, Australia, and Harvard University’s John F. Kennedy School of Government in Cambridge, Massachusetts. Although gerrymandering played no part in the tumultuous 2016 presidential election, it seems to have influenced who won seats in the US House of Representatives that year.
“Even if gerrymandering affected just 5 seats out of 435, that’s often enough to sway crucial votes,” Mattingly says.
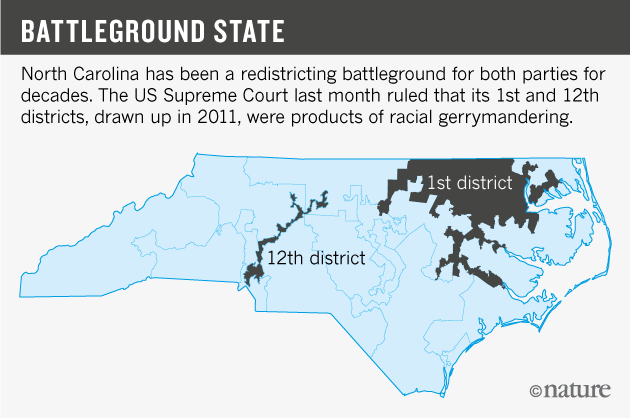
The courts intervene when gerrymandering is driven by race. Last month, for example, the Supreme Court upheld a verdict that two North Carolina districts were drawn with racial composition in mind (see ‘Battleground state’). But the courts have been much less keen to weigh in on partisan gerrymandering — when one political party is favoured over another. One reason is that there has never been a clear and reliable metric to determine when this type of gerrymandering crosses the line from acceptable politicking to a violation of the US Constitution.

Mattingly and several other mathematicians hope to change that. Over the past five years, they have built algorithms and computer models that reveal biases in district borders. And they’re starting to be heard.
In December 2016, a Wisconsin court considered a statistical analysis when ruling against partisan gerrymandering. And Mattingly will serve as an expert witness in a case this summer in North Carolina.
Although such fights have begun to crop up in other countries, such as the United Kingdom and Australia, the stakes are particularly high in the United States. Lawsuits fighting partisan gerrymandering are pending around the country, and a census planned for 2020 is expected to trigger nationwide redistricting. If the mathematicians succeed in laying out their case, it could influence how those maps are drawn.
“This is what the courts have been waiting for,” says Megan Gall, a social scientist with the Lawyers’ Committee for Civil Rights Under Law in Washington DC. “This is our way to stop it,” she says.
Draw the line
In 1812, Massachusetts governor Elbridge Gerry signed a bill that redrew some voting districts to benefit his party. One odd-looking district wrapped around the city of Boston in the shape of a salamander. Political satirists dubbed the new district the 'Gerry-mander'. Since then, this strategy has become a staple of US politics as state legislators redraw voting blocs with tortuous creativity.
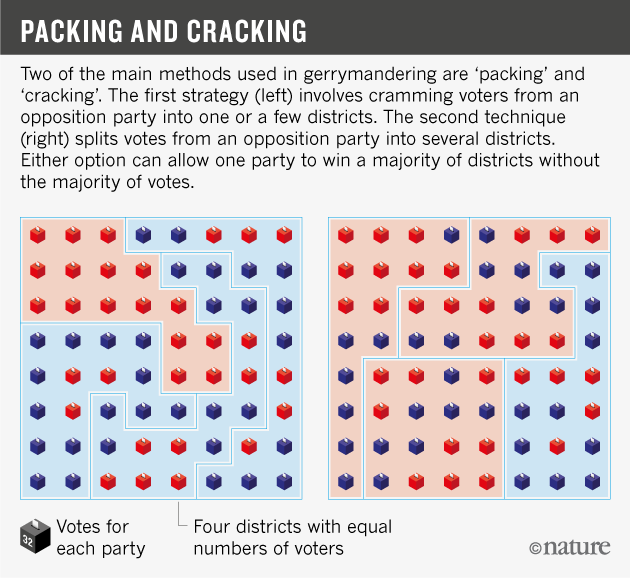
The two predominant approaches to gerrymandering are often referred to as packing and cracking. In packing, legislators from the party drawing the map try to pack likely opposition voters into as few political districts as possible. Cracking divides supporters of the rival party into several districts, reducing their ability to elect a representative, and ensuring victory for the party in power (see ‘Packing and cracking’).

The Supreme Court historically has not intervened, as long as districts meet four criteria: they are continuous; they are compact; they contain roughly the same number of people; and they give minority groups a chance to elect their own representatives in accordance with the Voting Rights Act of 1965. In the 1986 case Davis v. Bandemer, the court agreed that it had the power to intervene in cases of partisan gerrymandering, but it declined to do so because it lacked a clear measure to indicate when this had occurred.
As a specialist in statistics and probability, Mattingly had never given much professional thought to the issue. But his general interest in the political process led him to attend a public meeting in 2013, where he heard a speaker rail against North Carolina's 2012 election outcomes. For about a decade, the state had had a relatively even split in its 13 electoral districts. Sometimes Democrats took six seats, sometimes seven. But Republican redistricting before the 2012 election packed Democrats into three districts, putting the party at a severe disadvantage. Even though its candidates won 50.3% of the votes, the party captured only four seats.
Mattingly was struck both by the passion of the rant and the puzzle it posed. “If it really was unfair, there should be a way to show that mathematically,” he says. “I wanted to move beyond ‘he said, she said’ and create something more objective.” Reading around the issue, he realized he had a chance to create the metric that judges had been looking for.
Packing and cracking result in some telltale signs of interference: the opposition party tends to win by a landslide in packed districts, but lose by a narrow margin in cracked ones. And heavily gerrymandered districts are more likely to be geographically spread out and of unusual shape. With a student, Christy Graves, Mattingly got to work to combine these measures into a single, quantitative Gerrymandering Index for North Carolina.
The duo began with the state’s 2012 election districts and public data that broke down voting by neighbourhood. They then made thousands of tiny shifts to the boundaries of the districts, essentially testing every iteration that would meet the four Supreme Court criteria.
Ensuring continuity — and that each district varied in population size by only 0.1% — was relatively straightforward. So was guaranteeing that the map included a representative number of African American and Hispanic-majority districts to comply with the Voting Rights Act.
But evaluating compactness was a challenge. One problem was that it’s difficult to analyse mathematically whether a district meets a rather vague written criterion of being ‘compact’. For another, mathematicians have more than 30 different ways to calculate a shape’s compactness, each of which gives slightly different results. There is no consensus on which is the best for voting districts. Mathematician Moon Duchin at Tufts University in Medford, Massachusetts, has spent the past few years trying to devise a compactness metric for gerrymandering. “But the field is a giant mess,” she says.
Complicating the issue even further, many districts have odd shapes owing to rivers and other natural boundaries. Mattingly and Graves developed a compactness score calculated as the length of a district’s perimeter squared divided by its area, a version of what's known as the Polsby–Popper measure (see ‘Compact division’). A circle has the lowest ratio of perimeter to area; but as borders meander to include and exclude specific areas, the perimeter expands, giving a higher ratio.
With thousands of maps and their resulting voting outcomes in hand, Mattingly and Graves could begin to analyse just how gerrymandered the North Carolina voting districts were. Three of the 13 districts for the 2012 elections were more than three-quarters Democrat, much more packed than in any of the team’s randomly drawn maps, even for their bluest-of-blue Democratic districts. More telling, however, was the impact on election outcomes. Using the randomly drawn maps, 7.6 seats went to Democrats on average, compared with the 4 they actually won (J. Mattingly and C. Vaughn Preprint at http://arxiv.org/abs/1410.8796; 2014). “The more you learn, the more infuriating it gets,” Mattingly says.
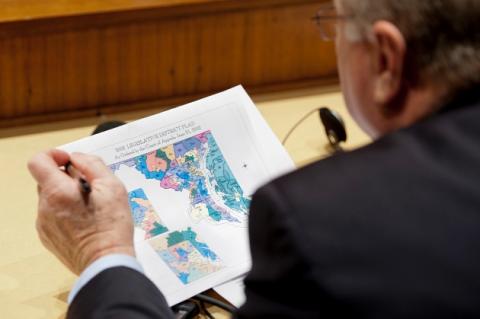
Their analysis of data from other states revealed a partisan gerrymander in Maryland perpetrated by the Democrat-controlled legislature to freeze out its conservative rivals. States such as Arizona and Iowa, which have independent or bipartisan commissions that oversee the creation of voting districts, fared much better. In a separate analysis, Daniel McGlone, a geographic-information-system data analyst at the technology firm Azavea in Philadelphia, Pennsylvania, ranked each state’s voting districts for compactness as a measure of gerrymandering, and found that Maryland had the most-gerrymandered districts. North Carolina came second. Nevada, Nebraska and Indiana were the least gerrymandered.
Measuring up
In the summer of 2016, a bipartisan panel of retired judges met to see whether they could create a more representative set of voting districts for North Carolina. Their maps gave Mattingly a chance to test his index. The judges’ districts, he found, were less gerrymandered than in 75% of the computer-generated models — a sign of a well-drawn, representative map. By comparison, every one of the 24,000 computer-drawn districts was less gerrymandered than either the 2012 or 2016 voting districts drawn by state legislators, which Mattingly, Graves and their colleagues reported in April 2017 (S. Bangia et al. Preprint at http://arxiv.org/abs/1704.03360; 2017).
“This is the result that I hope gets traction,” Mattingly says. “It shows that the election results really didn’t represent the will of the people.” When representatives from Common Cause, a pro-democracy advocacy group based in Washington DC, saw the work, they asked Mattingly to serve as an expert witness in a North Carolina partisan-gerrymandering case coming up this summer. The question for researchers and judges, however, is whether Mattingly’s approach is the best.
“The election results really didn't represent the will of the people.”
Mathematicians in other states have also been developing methods for evaluating gerrymandering. At the University of Illinois Urbana–Champaign, political statistician Wendy Tam Cho has designed algorithms to draw district maps that use the criteria mandated by state law, but do not include partisan information such as an area’s voting history. By altering the importance of the compactness score, or how equal the different populations in each district need to be, she can generate a new set of districts. Cho measures how closely a state’s existing legislative districts line up with billions of non-partisan maps drawn by her supercomputing cluster. If they diverge significantly, then the people who drew the districts probably had partisan motives for placing the lines where they did, Cho says.
Cho’s approach creates more maps than Mattingly’s, which she says gives it an advantage. But Mattingly argues that his algorithms are more transparent and so can be used to calculate a score that judges might prefer. Both strategies are highly technical and require professional expertise to implement and interpret, says Sam Wang, a neuroscientist at Princeton University, New Jersey, who analyses elections and voting in his spare time at the blog Princeton Election Consortium. “The Supreme Court has said it is looking for a ‘manageable’ standard. For constitutional questions, judges might find it more manageable to avoid having to call upon outside experts,” Wang says.
Political scientist Nicholas Stephanopoulos at the University of Chicago, Illinois, takes a much simpler approach to measuring gerrymandering. He has developed what he calls an “efficiency gap”, which measures a state’s wasted votes: all those cast for a losing candidate in each district, and all those for the victor in excess of the proportion needed to win. If one party has lots of landslide victories and crushing losses compared with its rivals, this can be a sign of gerrymandering. The simplicity of this metric is a strength, says Wang.
But Duchin argues that methods that analyse only one aspect of gerrymandering, whether it’s lopsided wins or low compactness scores, are less than ideal. She favours a metric, such as Mattingly’s, that incorporates the variety of factors that contribute.
Michael McDonald, a political scientist at the University of Florida in Gainesville, questions the validity of all these quantitative metrics, however, because they rely on creating a random sample of all possible voting districts. It is impossible to calculate how random a sample they are looking at, he argues. “There are more ways to draw voting districts in the US than there are quarks in the Universe.”
Accusations of gerrymandering have also cropped up in the United Kingdom. Until 20 years ago, the creation of voting districts by the independent Boundary Commissions was a largely apolitical process, according to geographer Ron Johnston at the University of Bristol, UK. In the 1990s, supporters of the Labour party, then in opposition, realized that they could influence the creation of parliamentary constituencies by submitting their own maps to the Boundary Commissions for consideration, which opened the door to all parties jockeying for power, Johnston says. An overhaul of UK constituencies currently under way could cut the number of Members of Parliament by 50; the final result of the Boundary Commissions' review is expected in 2018. Political parties are expected to try to shift the results in their favour, but quantitative solutions could help to depoliticize the process.
Solution in sight
US legislators have been reluctant to embrace a mathematical solution to gerrymandering. But current court cases show that pressure to do so is mounting, Gall says. In the Wisconsin case Whitford v. Gill, federal judges used the efficiency gap to rule that the state’s voting districts represented an unconstitutional partisan gerrymander. The case could end up before the Supreme Court later this year.
If judges are to accept a mathematical test for gerrymandering, they will need testimony from expert witnesses such as Mattingly to explain how and why these tests work. But the handful of mathematicians researching the subject will not be enough for the country’s pending lawsuits. Even if the courts settle on a standard metric, judges might need an expert in each case. That’s why Duchin is organizing a week-long summer camp to help mathematicians learn the underlying subtleties of the various gerrymandering models and how to apply and explain them. Duchin expected 50 people to sign up; more than 1,000 have applied. “The response blew us out of the water,” she says, and several camps will now be held.
Mattingly and his model will have their day in court this summer. Even if his algorithms don’t become the standard, Mattingly hopes that the judicial system will find a way to curb gerrymandering and restore his faith in the electoral system. “I’m a citizen, too,” he says.
Nature 546, 200–202 (08 June 2017) doi:10.1038/546200a


Spread the word