
10 Years after the Start of the Great Recession, Black and Asian Households Have Yet to Recover Lost Income
Today’s Census Bureau report on income, poverty, and health insurance coverage in 2017 shows that while all race and ethnic groups shared in the growth in median household incomes during the previous two years, that trend abruptly ended for African American households in 2017. Real median incomes were basically flat among African Americans (from $40,339 to $40,258) and down among Asians (from $83,182 to $81,331), but up 3.7 percent (from $48,700 to $50,486) among Hispanics, and 2.6 percent (from $66,440 to $68,145) among non-Hispanic whites. The decline in Asian household incomes was not statistically significant. As a result of stalled income growth among African Americans, recent progress in closing the black-white income gap over the last couple years has been reversed. The median black household earned just 59 cents for every dollar of income the white median household earned (down from 61 cents), while the median Hispanic household earned just 74 cents (up from 73 cents). Meanwhile, households headed by persons who are foreign-born saw little change in median incomes between 2016 and 2017 (from $56,754 to $57,273), compared to an increase of 1.5 percent (from $61,066 to $61,987) among households with a native-born household head.
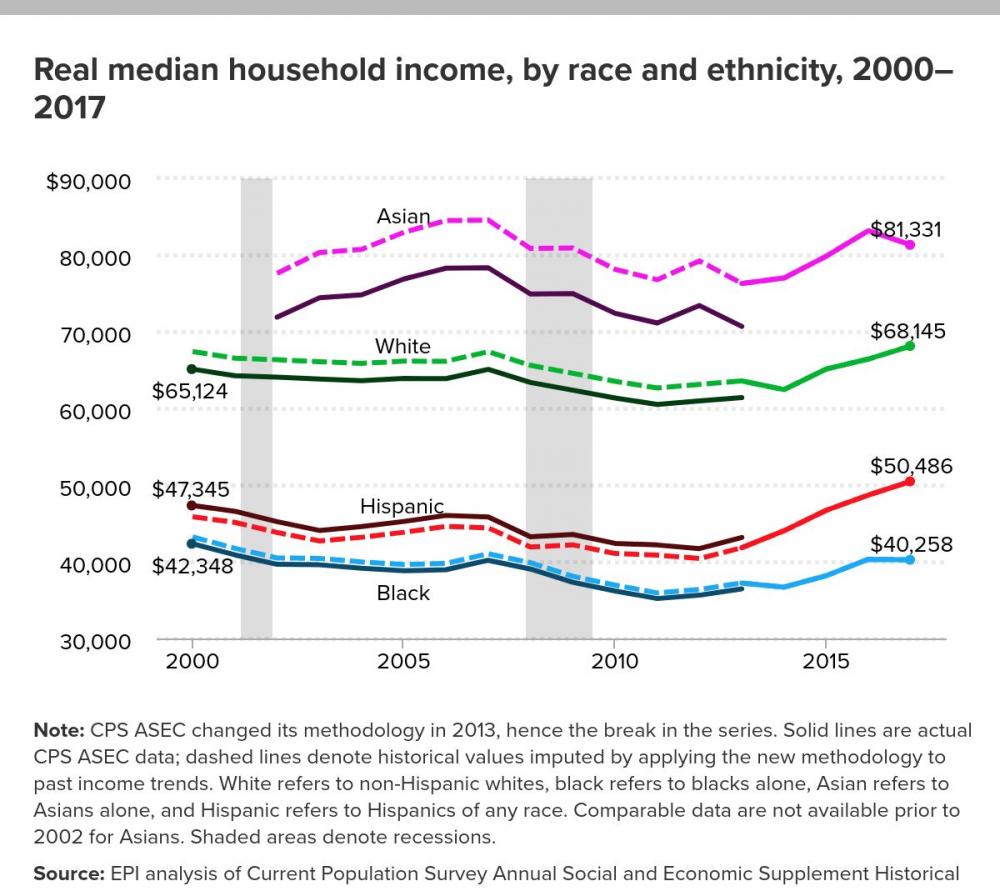
Based on EPI’s imputed historical income values (see the note under Figure A for an explanation), 10 years after the start of the Great Recession in 2007, only African American and Asian households have not recovered their pre-recession median income. Compared to 2007, 2017, median household incomes are down 1.9 percent (-$781) for African Americans and 3.8 percent ($3,225) for Asians, but up 1.1 percent ($755) for non-Hispanic whites, and 13.7 percent ($6,073) for Hispanics. Asian households continue to have the highest median income, despite large income losses in the wake of the recession.
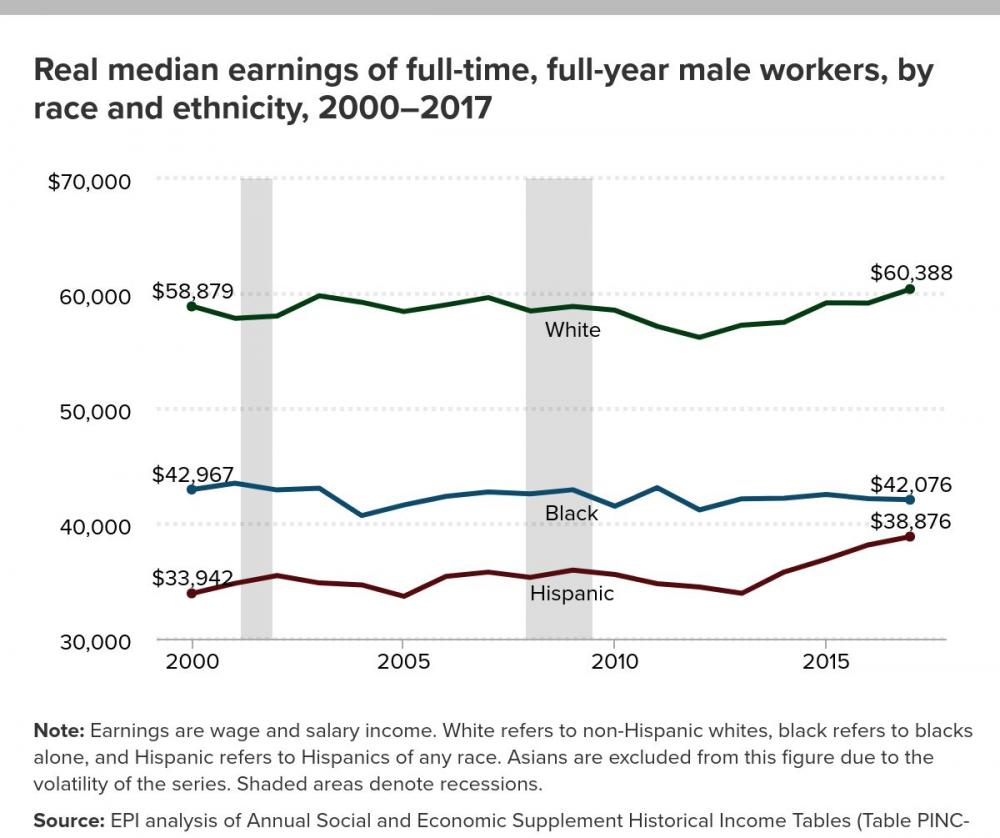
The primary driving force behind the slow return to pre-recession income levels has been stagnant wage growth. Real wages had been essentially flat since 2000 for the typical worker, until receiving a needed boost in 2015 and 2016, in part due to a sharp slowdown in inflation. Interestingly, while real earnings of the median male and female full-time full-year worker declined 1.1 percent each in 2017, there was less uniformity in earnings growth by race, ethnicity and gender. Between 2016 and 2017, real earnings of the median white and Hispanic male full-time, full-year worker increased 2.1 percent and 1.9 percent, respectively, while the median black male worker’s earnings fell 0.2 percent. Only black men have yet to fully recover their pre-recession 2007 level of earnings.
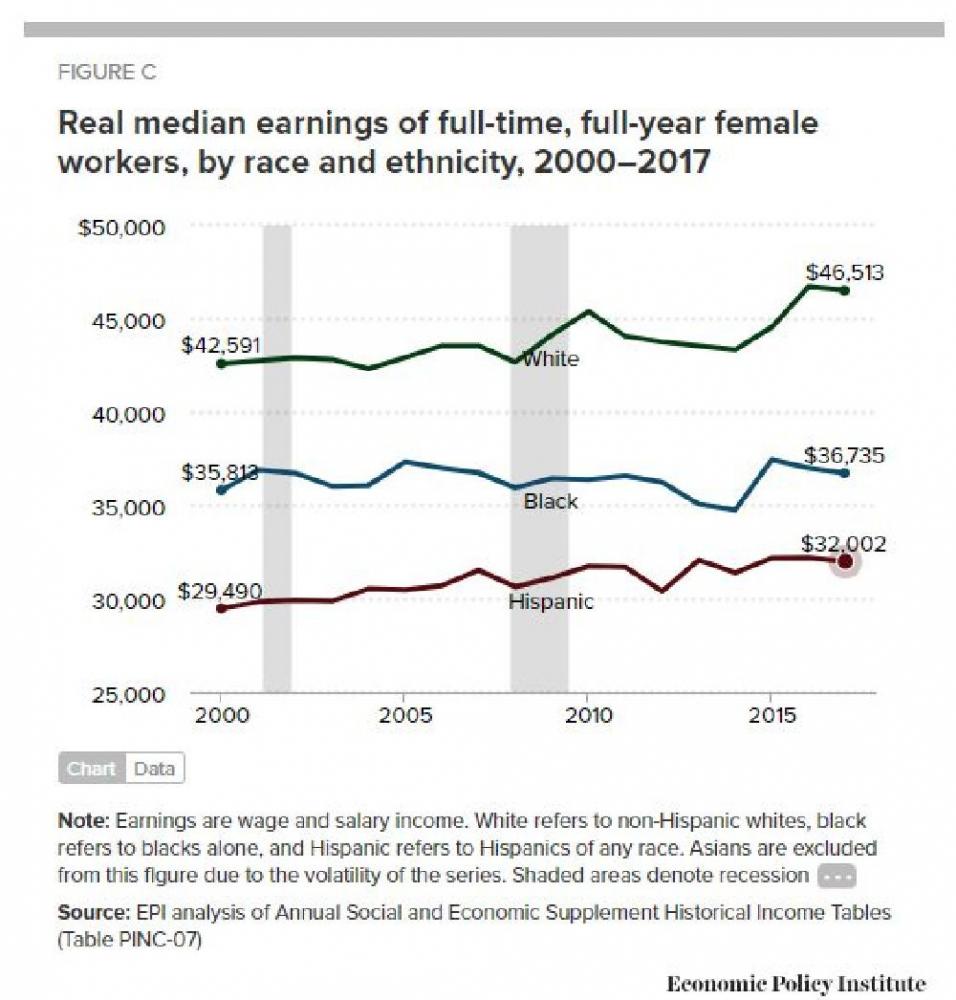
Among female workers, the decline in median earnings was more consistent across racial and ethnic groups. Between 2016 and 2017, real earnings of the median African American woman working full-time full-year declined 0.7 percent, followed by a decline of 0.6 percent among Hispanic women and a decline of 0.5 percent among white women. Inflation-adjusted median earnings for full-time, full-year workers remain below 2007 levels for each of these groups of women.
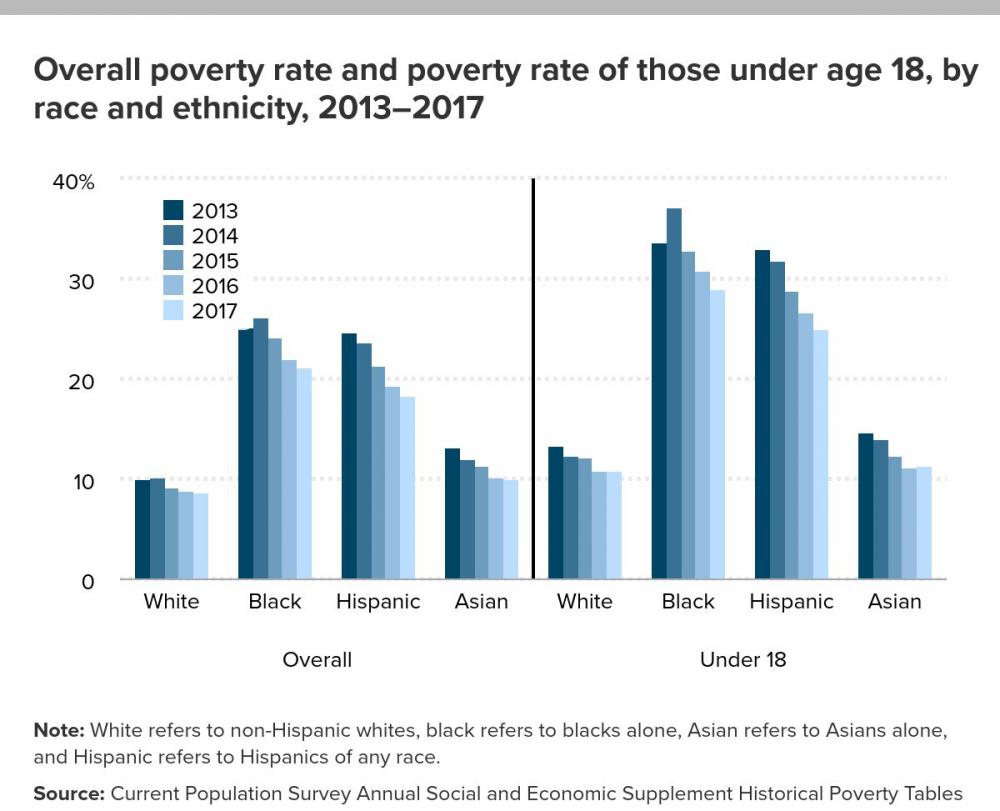
The 2017 poverty rates also reflect the patterns of income growth between 2016 and 2017. Poverty rates for all groups were down slightly or unchanged, but remain highest among African Americans (21.2 percent, down 0.8 percentage points), followed by Hispanics (18.3 percent, down 1.1 percentage points), Asians (10 percent, down 0.1 percentage points) and whites (8.7 percent, down 0.1 percentage point). Following patterns of slowed income growth, the pace of improvement in the poverty rate also slowed. African-American and Hispanic children continue to face the highest poverty rates—29 percent of African Americans and 25 percent of Hispanics under age 18 live below the poverty level. African American children are over 2.5 times more likely to be in poverty than white children (10.9 percent).
The Supplemental Poverty Measure (SPM), an alternative to the long-running official poverty measure, provides an even more accurate measure of a household’s economic vulnerability. While the official poverty rate only captures before-tax cash income, the SPM accounts for various non-cash benefits and tax credits. The SPM also allows for geographic variability in what constitutes poverty based on differences in the cost of living. According to the 2017 SPM, the official poverty rate understates poverty among Hispanics (21.4 percent) and Asians (15.1 percent) by more than among whites (9.8 percent) and African Americans (22.1 percent).
While today’s report provides a snapshot of the current economic condition of America’s largest racial and ethnic groups, Thursday’s release of the 2017 American Community Survey will provide an update on the Native American population and disaggregated data for the various ethnic groups that make up the Asian population.
Spread the word