

KEY TAKEAWAYS
- Toward the end of the 20th century, there was a lot of dissent and argument over the scientifically robust evidence that showed the Earth is warming.
- The evidence of this warming is so strong that even if we begin in the year 2000, it's robust at the 7-sigma level, with less than 1-in-100 billion chance of it being a statistical fluke.
- We're now at the point that we have to ask ourselves when we want Earth's hottest year of the 3rd millennium to be? We're capable of determining the answer.
Back in 1990, with 110 years of temperature records behind them, the world’s top climate scientists convened to put together a report on the state of the Earth’s climate. Working collaboratively, the fruits of their labor became the very first Intergovernmental Panel on Climate Change (IPCC) report. It definitively showed:
- there had been a global increase in carbon dioxide concentrations since pre-industrial times from ~280 parts-per-million (ppm) to 354 ppm,
- this was coupled with a global average temperature increase of 0.7 °C (1.3 °F),
- that the increase in temperature was being driven not by the Sun, volcanoes, or urbanization, but rather by the human-wrought changes to our atmospheric contents,
- and that this problem would continue to worsen unless carbon dioxide emissions were curbed.
Despite sounding the alarm, the past three decades have led to a far more dire situation. As identified in 2021’s 6th IPCC report, carbon dioxide concentrations now sit at 412 ppm, Earth’s average temperature is a full 1.3 °C (2.3 °F) above pre-industrial levels, and our global carbon emissions have increased to a new all-time high: nearing 40 billion tonnes of carbon dioxide annually, up from 22 billion in 1990. The best time to act was long ago, but the second best time to act is now. Here are the truths of the matter that everyone who’s vested in following what the science shows should know.
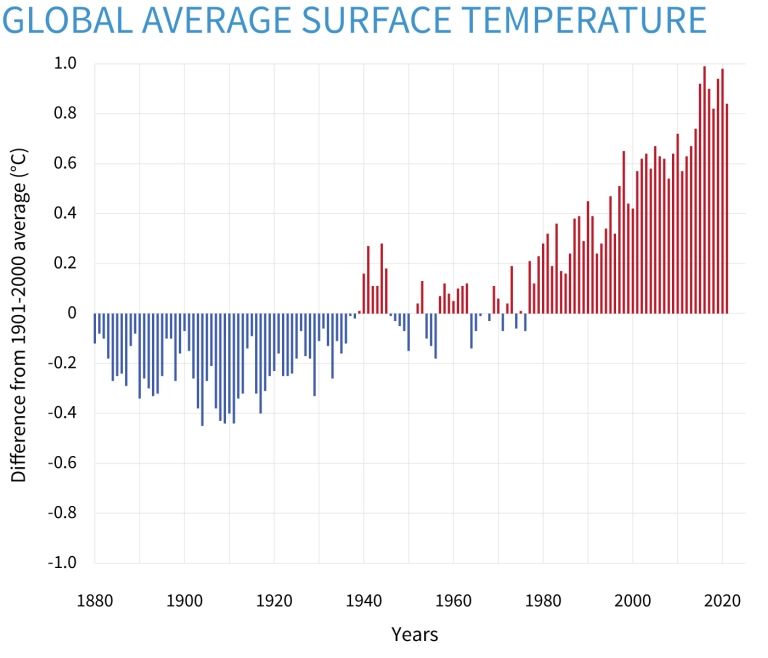
Yearly surface temperature compared to the 20th-century average from 1880–2021. Blue bars indicate cooler-than-average years; red bars show warmer-than-average years. The past 7 years on record hold the top 7 spots for the warmest year on record. Credit: NOAA National Centers for Environmental information, Climate at a Glance: Global Time Series
1.) The Earth really has warmed since pre-industrial times, and the rate of warming is increasing with time.
The Earth, at present, is indisputably a warmer planet today than at any point in all of recorded human history. This isn’t because of the Sun; it isn’t because of Milankovitch cycles; it isn’t because of volcanic activity. It’s directly due to the human-caused emission of greenhouse gases, with the concentration of carbon dioxide being the dominant driving factor in increasing the Earth’s temperature.
The Sun outputs energy, the Earth orbits at a specific distance from the Sun, where it absorbs some of that sunlight and reflects the rest, and then re-radiates its absorbed heat back into space. If we simply accounted for these factors and ignored Earth’s atmosphere, including:
- cloud cover,
- greenhouse gases like carbon dioxide, methane, and water vapor,
- and the transparent-in-visible-light but absorptive-in-infrared-light properties of those gases,
we’d calculate that Earth’s average temperature should be 255 Kelvin (-18 °C / 0 °F). Instead, owing to these effects, Earth’s average temperature is 288 Kelvin (15 °C / 59 °F). The 33 K greenhouse effect is 50% attributable to water vapor, 25% due to clouds, 20% due to carbon dioxide, and 5% to other gases. Increasing the carbon dioxide level by ~50% over its pre-industrialization value is the primary driver of the recently observed warming.
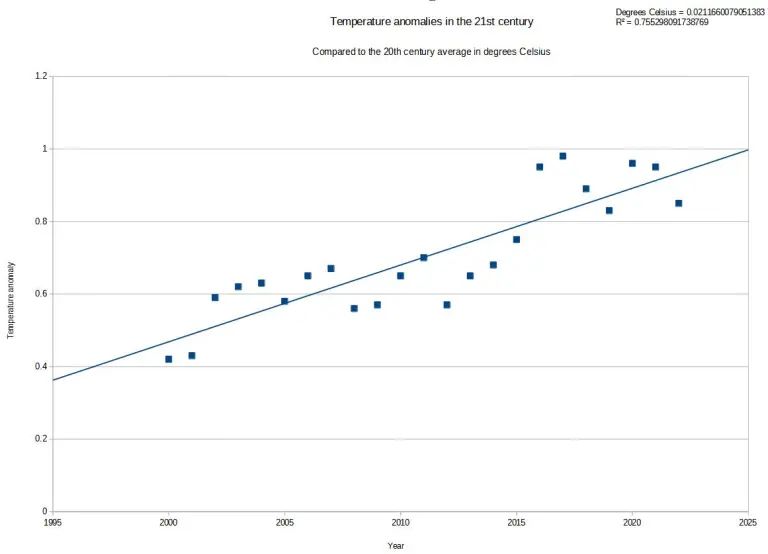
Using publicly available data from NOAA, one can plot the global average land-and-ocean temperature anomaly, compared to the 20th century average, from the year 2000 to the present. The data is so strongly indicative of warming that a no-warming scenario can be ruled out with greater than 7-sigma confidence. (Credit: E. Siegel; data, NOAA National Centers for Environmental information)
2.) It’s so significant that if we only look at global temperatures since 2000, the signal is robust, significant, and terrifying.
It took over 100 years from the time when global average temperatures began being measured back in 1880 before a robust, 5σ signal (with less than 0.0001% chance of it being a statistical fluke) demonstrated that the Earth was, in fact, warming. The start of the 21st century has shown an alarming increase in this rate of warming. In fact, since the year 2000:
- global average temperatures have increased by 0.47 °C (0.84 °F),
- which is triple the average 20th century warming rate,
- with a “no warming” scenario excluded at a whopping 7σ significance already (1-in-300 billion odds of being a fluke).
Things are not only getting worse, but the rate at which they’re getting worse is increasing substantially. We may be the first species in history to scientifically realize how our activities are impacting, polluting, and damaging our environment in an existential way. It remains to be seen whether we’re up to the challenge of addressing it.
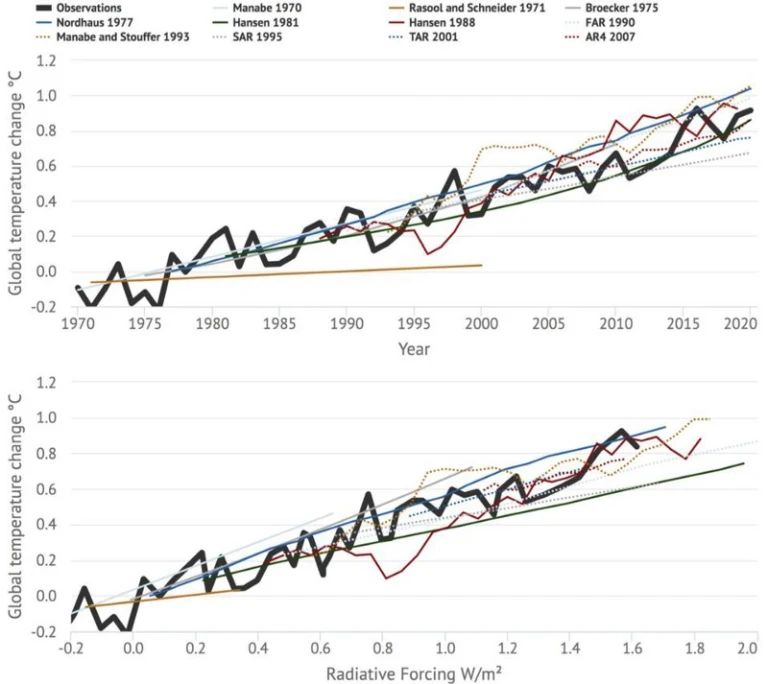
The predictions of various climate models over the years (colored lines) as compared with the observed global average temperature (black, thick line). Note how thoroughly well these models performed historically, and how well the observations continue to fit the data. (Credit: Z. Hausfather et al., Geophys. Res. Lett, 2019)
3.) The major predictions of climate science from over 50 years ago — including the hockey stick and warming trends — were all correct.
The above graph shows a variety of climate models and their predictions for how the global mean temperature would increase, going as far back as 1970 and showing the prediction beginning the year they were made. The black, thick line shows the actual observed temperature on a year-to-year basis. As you can clearly see with a visual inspection, or as you can robustly find with a more detailed statistical analysis, historical climate models and past IPCC projections have accurately predicted real-world temperatures in subsequent years.
It’s more than just the warming trends, however. The “hockey stick” graph now goes back more than 2000 years and shows definitively how unprecedented the modern warming trend is; the first two centuries of the 3rd millennium will be warmer than any multi-century period over the past 100,000 years. Skeptics often question how much of the warming is due to natural factors versus how much is due to human activity, and the latest report has answered that: approximately ~95–100% is human-caused; approximately ~0–5% is natural (due to solar and volcanic effects). Humans are the cause of this unprecedented warming, and it is up to us to be the solution, too.
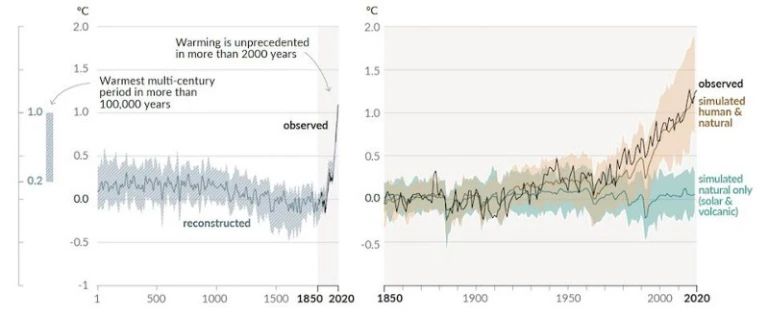
The past 2020 years of temperature (left) clearly shows the hockey stick nature of global temperature. The past 170 years (right) shows the observed temperature variations and the simulated impacts of natural variability (blue) and human impacts (orange) added to the natural effects. 95–100% of the warming is due to human activity. (Credit: IPCC AR6, 2021)
4.) The key to stopping further, future warming relies on decreasing human-caused carbon dioxide emissions.
One of the key things you have to realize is that what we call “the greenhouse effect” is a little bit of a misnomer; it’s actually more like a “blanket” effect. The heat-trapping gases in our atmosphere behave like blankets, keeping the heat our planet emits here on our planet for longer than it would’ve been kept here in the absence of those gases. The more gases there are — i.e., the more “blankets” we continue to put onto our planet — the more we’ll re-absorb and re-absorb and re-absorb that heat, over and over, before finally emitting it back into space for good.
All attempts at geoengineering a solution without simultaneously reducing carbon dioxide emissions, including:
- reflecting sunlight back into space before it’s incident on the top of Earth’s atmosphere,
- seeding clouds to reflect sunlight back into space,
- injecting aerosols into the stratosphere of Earth,
- sequestering carbon in either natural (i.e., trees) or artificial (i.e., captured carbon) stores,
- and enhancing the alkalinity of the ocean,
are stopgap measures at best, where the underlying cause of the problem continues to be exacerbated. “Ceasing to put new blankets on” has to be part of a sustainable solution to human-caused climate change.
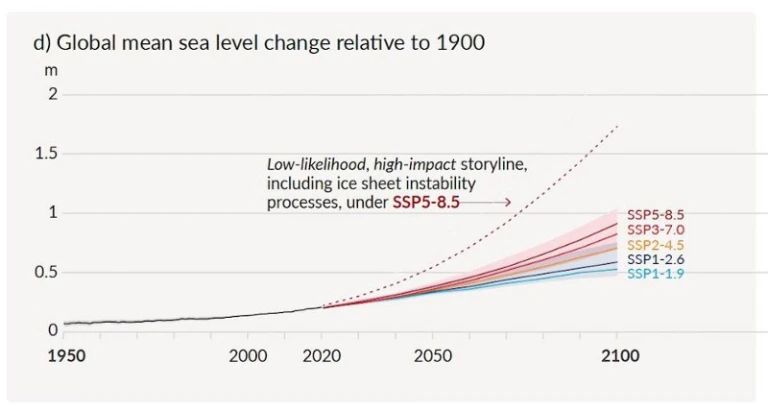
The five expected warming/emissions scenarios and the corresponding sea-level rise, as detailed in the 6th IPCC report. If the Antarctic ice sheet becomes unstable, a possibility in the highest-emission scenarios, the impacts will be much more severe, as indicated by the dotted line. (Credit: IPCC AR6, 2021)
5.) Sea levels will rise throughout the 3rd millennium by anywhere from 2 meters to up to 22 meters, depending on our current and near-future actions.
The biggest risk, of course, is that an abrupt and colossal change will occur: what we’ve traditionally called a “tipping point.” Two of these are intimately related to the seas: ice sheet collapse and abrupt changes in ocean circulation. Most climate projections result in 0.5–1.0 meters of sea level rise through 2100, with an acceleration occurring in the moderate and high-end emissions scenarios. However, a destabilized Antarctic ice sheet (shown on the above graph as a dotted line) will lead to an ensuing catastrophic rise in sea levels. According to the IPCC:
“Global mean sea level rise above the likely range — approaching 2 m by 2100 and 5 m by 2150 under a very high… emissions scenario — cannot be ruled out due to deep uncertainty in ice sheet processes.”
Coastal flooding events will occur more frequently, particularly along the Gulf and Atlantic coasts of the United States. A combination of sea level rise, tidal cycles, and shifting ocean currents could transform what were once-in-a-century flooding events in the 1900s into annual events by 2100. The report also warns that the combination of deep ocean warming and ice sheet melt will likely, with high confidence, result in elevated sea levels for millennia. If warming is limited to 1.5 °C, 2 °C, or 5 °C over the next few centuries, we can still expect sea levels to rise by 2–3 m, 2–6 m, or 19–22 m, respectively, by the year 3000.
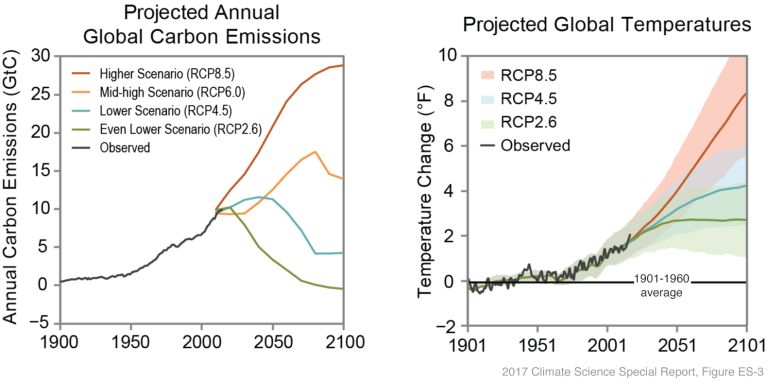
A comparison of the projected global temperatures into the future alongside several projected global carbon emissions scenarios. The higher and mid-high scenarios are still in play; the “even lower scenario” is looking unlikely given the present state of affairs. (Credit: Katharine Hayhoe/NOAA/Climate.gov)
6.) 1.5 °C (2.7 °F) warming is inevitable and will occur by the early 2030s, but isn’t “game over” for the climate.
The IPCC, in their most recent report, considered 5 climate scenarios. Each one, individually, was driven by predictions for the future of carbon emissions on planet Earth.
- SSP1–1.9 was the scenario chosen to limit temperatures in 2100 to below 1.5 °C warming,
- SSP1–2.6 was the most plausible low-end emissions scenario considered,
- SSP2–4.5 was a scenario that assumed that policies adopted in 2021-era Europe would be successfully implemented worldwide,
- SSP3–7.0, represented a high-end emissions pathway where emissions slowly increase, doubling by century’s end,
- and SSP3–8.5 represented the most pessimistic high-end emissions scenario considered.
In these 5 scenarios, respectively, it’s estimated that the Earth’s global average temperature in the year 2100 will be 1.4 °C, 1.8 °C, 2.7 °C, 3.6 °C, and 4.4 °C warmer than the 20th century average.
In all cases, we will pass the 1.5 °C mark sometime in the early 2030s: about 10 years from now. In all but the two most optimistic scenarios for emissions, we will pass 2.0 °C of warming sometime around 2050. None of this, however, means “game over” for the climate. Temperature trends should reverse once emissions go carbon-negative. The less time we spend with extreme temperatures on Earth, the more successful we’ll be at mitigating the ill effects of climate change; the more rapidly we decarbonize the energy sector, the better those mitigations will be.
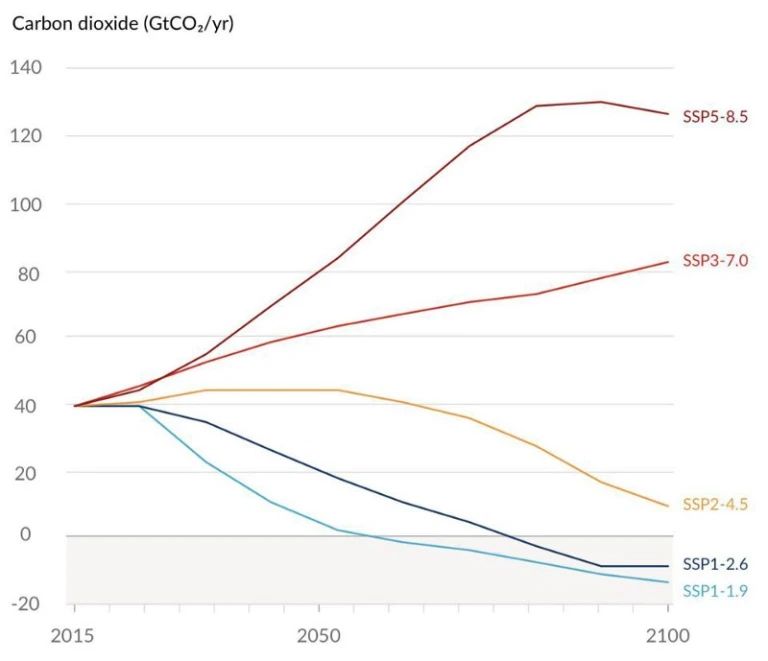
Carbon emissions under the 5 scenarios considered by the IPCC in their 6th (2021) report. Emissions are measured in billions of tons of carbon dioxide per year (y-axis). The blue scenarios are dependent on immediate and rapid decarbonization, while the orange line assumes substantial steps occurring in short order to reduce emissions. The redder scenarios are far more troubling, and possibly a more realistic reflection of the status quo. (Credit: IPCC AR6, 2021)
7.) The timescale over which we decarbonize our energy economy determines the severity, consequences, and longevity of future warming.
The longer we delay meaningful climate action, the more severe the consequences will get not just for all of humanity today, but for generations and even millennia to come. Each time we add more of any of these greenhouse gases to the atmosphere, they:
- increase the atmospheric concentration of that gas,
- which behaves as a blanket, increasing the atmospheric and surface temperatures,
- where that gas and the heat mixes with the top of the ocean, increasing its chemical concentration and overall temperature,
- which mixes with the deep ocean, distributing that chemical and that heat throughout the oceans,
- where that extra oceanic heat leads to thermal expansion of the ocean, icecap melting, and the destabilization of polar vortices,
among other effects. The longer that gas and that heat remains present here on Earth, the more enduring and more severe the effects of climate change are going to be. The ideal solution will be to decarbonize our energy economy — overwhelmingly the top contribution to greenhouse gases and rising temperatures — rapidly, thoroughly, and sustainably. The worse we let things get, and the longer they stay that way, the more difficult it’s going to be to mitigate, deal with, and eventually reverse those downstream effects.
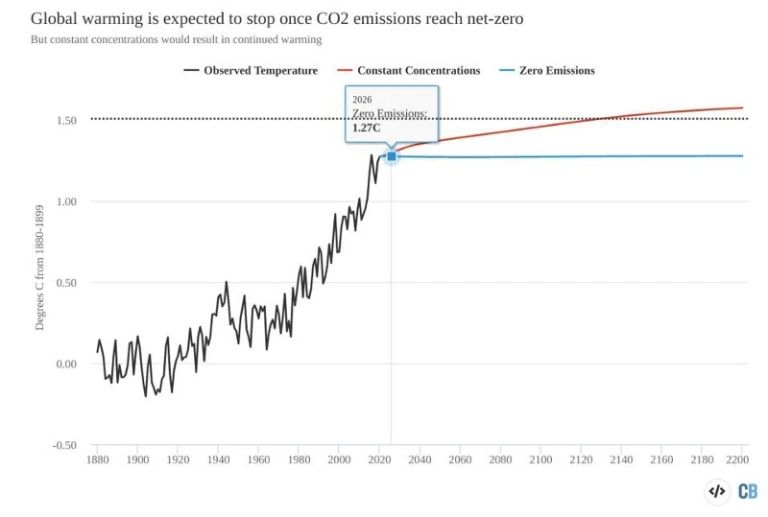
If zero carbon emissions were to be achieved today, temperatures would level off and remain at their current elevated levels (blue line). The scenario of constant concentrations, where temperatures continue to rise, is not supported by the full suite of the interplaying systems on Earth, requiring net emissions to maintain the current concentrations (red line). (Credit: Carbon Brief/H. D. Matthews & A. Weaver, Nature Geosciences, 2010)
8.) There is hope: global warming is expected to stop once net carbon dioxide emission reach zero.
As fast and severe as our current global warming trends are — with temperatures increasing at an alarming rate of 0.21 °C (0.38 °F) per decade — it isn’t a foregone conclusion that things must continue to worsen very far into the future. If we start producing large amounts of energy from sources that don’t emit large amounts of carbon dioxide in the process, there’s reason for optimism. Once we reach the point — and we all assume that we someday will — where we achieve net-zero carbon emissions, global warming will pretty much cease at that time.
Even though temperatures lag carbon dioxide concentrations, once we reach that net-zero emissions goal, we can robustly predict that the atmospheric concentrations of carbon dioxide will decrease, leading to roughly level temperatures. (And yes, temperatures will drop if we move to negative carbon emissions.)
The Zero Emissions Commitment Model Intercomparison Project (ZECMIP) is discussed thoroughly in the new IPCC report, and agrees with an important 2010 paper. The conclusion is that as soon as we hit net-zero emissions, the temperature will roughly be frozen-in at that value unless/until negative emissions work to reverse the warming trend.
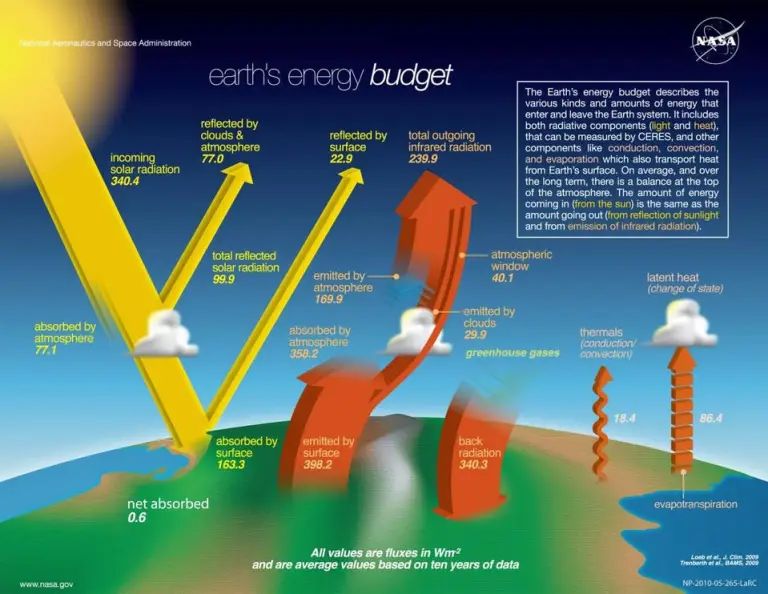
Earth energy budget diagram, with incoming and outgoing radiation (values are shown in W/m^2). Satellite instruments (CERES) measure the reflected solar, and emitted infrared radiation fluxes. The energy balance determines Earth’s climate. (Credit: NASA)
All of this leads to an enormous question that humanity, as a collective, is capable of determining the answer to: what will the hottest year of the third millennium be? If we rapidly decarbonize the energy sector over the next decade or two — reflecting the scenario outlined in the two low-emissions IPCC scenarios — we can expect those maximum temperatures to occur soon, in the latter half of the 21st century. If we follow a slower decarbonization path, like the SSP2–4.5 scenario, the hottest year will likely occur sometime in the 22nd century.
But if we follow one of the more sobering high-emissions scenario, where 2100-era emissions are greater than they are today, we could be eventually looking toward
- global temperature increases in excess of 5 °C (8 °F),
- global sea level increases in excess of 6 meters (20 feet),
- global carbon dioxide concentrations that crest above the 800 or even the 1000 ppm threshold,
- and a rise in global temperatures that continues for many centuries to come.
It’s up to all of us, collectively, to quite literally clean up humanity’s act. The price of civilization doesn’t have to be the thriving, wild ecosystem of planet Earth. But if we’re not careful in how we steward this world we all rely on for our survival, this will go down as yet another chapter in human history where we knew what needed to be done, but failed to act in that necessary fashion.
Ethan Siegel is a Ph.D. astrophysicist and author of "Starts with a Bang!" He is a science communicator, who professes physics and astronomy at various colleges. He has won numerous awards for science writing since 2008 for his blog, including the award for best science blog by the Institute of Physics. His two books "Treknology: The Science of Star Trek from Tricorders to Warp Drive" and "Beyond the Galaxy: How humanity looked beyond our Milky Way and discovered the entire Universe" are available for purchase at Amazon. Follow him on Twitter @startswithabang. Support Ethan Siegel and Starts With A Bang (with benefits!) HERE.
Join our community of more than 10 million lifelong learners and get smarter, faster today.
Spread the word