
Inequalities abound in the U.S. economy, and a central driver in recent decades is the widening gap between the hourly compensation of a typical (median) worker and productivity—the income generated per hour of work. This growing divergence has been driven by two other widening gaps, that between the compensation received by the vast majority of workers and those at the top, and that between labor’s share of income and capital’s. This paper presents evidence that the divorce between the growth of median compensation and productivity, the inequality of compensation, and the erosion of labor’s share of income has been generated primarily through intentional policy decisions designed to suppress typical workers’ wage growth, the failure to improve and update existing policies, and the failure to thwart new corporate practices and structures aimed at wage suppression. Inequality will stop rising, and paychecks for typical workers will start rising robustly in line with productivity, only when we enforce labor standards and embrace policies that reestablish individual and collective bargaining power for workers.
Between 1979 and 2017, the compensation of median workers trailed economywide (net) productivity growth by roughly 43%, leading to rising inequality. The effects have been felt broadly: During this time 90% of U.S. workers experienced wage growth slower than the economywide average, while workers at the top (mostly highly credentialed professionals and corporate managers) and owners of capital reaped large rewards made possible only by this anemic wage growth for the bottom 90%. Because the historical legacy of racism has concentrated Black and Latinx workers in the lower half of the wage scale more so than white workers, widespread wage suppression based on class position has inflicted disproportionate harm on them. Further, while women’s wages have grown faster than those for men in recent decades, women’s wage growth still has lagged the economy’s potential. In the fight for a piece of the ever-shrinking share of economic growth available to the bottom 90%, any one group’s gain can feel like another’s loss, leading to political divisions and hindering the formation of cross-racial coalitions based on common interests as workers. In other words, the disappointing wage growth of recent decades is an important economic and political issue.
Yet sluggish wage growth is not a political secret; it has been widely recognized across the political spectrum, even cited by both the Republican and Democratic Party platforms in 2016.1 The root causes of the trend have frequently been misidentified, however. One prominent interpretation is that disappointing wage growth is an unfortunate result of apolitical market forces that one neither can nor would want to alter. Since labor markets are generally competitive and workers and employers have roughly balanced degrees of market power, this argument naively assumes, fundamental apolitical forces like technological change and automation, as well as globalization, have mechanically shifted demand away from non-college-educated and middle-wage workers. But, as this paper will show, the premier research cited in support of an automation/technological theory has itself actually offered empirical metrics that demonstrate that automation/technological change fails to explain wage trends and wage inequality, especially in the period since 1995. Since the automation/technological change explanation is the preeminent explanation drawn from competitive labor market analyses based on equal bargaining power between employers and employees, the failure of automation/technological change to explain wage suppression and wage inequality represents the inability of competitive labor market analyses to adequately explain one of the most salient features of the economy over the last four decades.
Thus, we need to look further for more convincing empirical explanations of why, during a period of rising productivity, hourly compensation for the bottom 90% of all workers has risen so slowly in spite of overall income growth. Doing so requires explaining the key dynamics. The growing wedge between rising productivity and compensation growth for the typical worker financed the increased share of compensation going to top earners, especially those in the top 1% and 0.1%, along with a declining share of income going to labor. In addition, over the last four decades there has been a persistent disparity in the growth of earnings between those in the 90–99% range and those in the middle. Further, wage disparities by gender, race, and ethnicity from the late 1970s, reflecting systemic sexism and racism, remain with us and have sometimes even worsened. Any accounting of where we are and what policies we need must address these issues.
This paper offers a narrative and supporting evidence on the mechanisms that have suppressed wage growth since the late 1970s. We refer in this analysis to wage suppression rather than wage stagnation because it was an actively sought outcome—engineered by policymakers who invited and enabled capital owners and business managers to assault the leverage and bargaining power of typical workers, with the inevitable result that those at the top claim a larger share of income. These policy changes and the change in business practices they enabled have systematically undercut individual workers’ market (exit and voice) options and the ability of workers to obtain higher pay, job security, and better-quality jobs. These corporate and policy decisions had the most adverse consequences for low- and middle-wage workers, who are disproportionately women and minorities, the groups whose legacy of being discriminated against in labor markets means that they especially need low unemployment, unions, strong labor standards, and policy supports for leverage when bargaining with employers.
Neither slow productivity growth nor inevitable economic forces can explain U.S. wage problems. Rather, wage suppression reflects the failure of economic growth to reach the vast majority. It was a “failure by design” (Bivens 2010), engineered by those with the most wealth and power. The dynamics are primarily located in the labor market and the strengthening of employers’ power relative to their rank-and-file workforce (which increasingly includes those workers with a four-year college degree). In other words, the dynamics that have challenged the growth of living standards for the vast majority are based on workers not sharing in economic gains, not, as some have argued, on consumers suffering from monopolistic prices. Changes in product market monopoly and corporate structures have had an impact, but primarily by squeezing supply chain profits and wages rather than by spurring higher consumer prices through much wider profit margins.
As we will discuss, six factors can collectively explain most of the growth of wage inequality and the erosion of labor’s share that resulted in wage suppression over the last four decades (specifically 1979–2017):
- Austerity macroeconomics, including facilitating unemployment higher than it needed to be to keep inflation in check, and responding to recessions with insufficient force;
- Corporate-driven globalization, resulting from policy choices, largely at the behest of multinational corporations, that undercut wages and job security of non-college-educated workers while protecting profits and the pay of business managers and professionals;
- Purposely eroded collective bargaining, resulting from judicial decisions, and policy choices that invited ever more aggressive anti-union business practices;
- Weaker labor standards, including a declining minimum wage, eroded overtime protections, nonenforcement against instances of “wage theft,” or discrimination based on gender, race, and/or ethnicity;
- New employer-imposed contract terms, such as agreements not to compete after leaving employment and to submit to forced private and individualized arbitration of grievances; and
- Shifts in corporate structures, resulting from fissuring (or domestic outsourcing), industry deregulation, privatization, buyer dominance affecting entire supply chains, and increases in the concentration of employers.
Concretely, our analysis attempts to account for the 43 percentage point divergence between the growth of productivity (net of depreciation) and median hourly compensation (wage and benefit) growth between 1979 and 2017. This 43 percentage point wedge excludes any impact of the differing measures of prices used to inflation-adjust productivity and compensation growth. Had median hourly compensation grown with net productivity it would have increased from $20.48 in 1979 to $33.10 in 2017 ($2019). In fact, median hourly compensation was $23.15 in 2017, a $9.95 shortfall from the net productivity benchmark.
We estimate that the first three factors—the impacts that are largest and best measured, i.e., excessive unemployment, eroded collective bargaining, and corporate-driven globalization—explain 55% of the divergence between growth in productivity and median hourly compensation, and specific other factors included above—a diminished overtime salary threshold, employee misclassification, employer-imposed noncompete agreements, and corporate fissuring-subcontracting and major-buyer dominance—explain another 20%. Together, the factors for which we have been able to assess their impact on the median wage can account for three-fourths of the divergence between productivity and median hourly compensation growth from 1979 to 2017. Other factors that we have not been able to empirically assess—increased wage theft and weak enforcement, anti-poaching agreements, increased discrimination, forced arbitration agreements, guestworker programs, and increased prevalence of employer-created “lawless zones” in the labor market where workers are deprived of effective labor protections because of their immigration status—have also contributed to wage suppression.
Our analysis also seeks to account for the falling wages at the 10th percentile and the growth of the wage gap between the 10th percentile and the 50th. We find that these are readily explained by excessive unemployment and the failure to maintain the real value of the minimum wage, factors that have lowered the earnings of the bottom third. Other factors for which we do not yet have good measures of their impact (increased wage theft, the increased share of workers without effective legally protected rights due to their immigration status, and employee misclassification) likely play a role as well. In contrast, our analysis of data (in a section below and in Appendix A) related to automation and skill-biased technological change finds that these factors have had no impact on the suppression of median wages for at least the last 25 years.
Centering power and policy, not apolitical ‘market forces,’ in debates over U.S. wages
The large increase in inequality in the U.S. economy coincided with a pronounced political movement that called for increasing the reach and influence of markets in American life. This movement, known as market fundamentalism and often shorthanded as neoliberalism, has a long history in both U.S. and international policy debates. By the late 1970s, it achieved great prominence, even within the Democratic Party. Neoliberalism’s belief that markets are more efficient and effective than alternative instruments for distributing resources and organizing economic life led it straight to many of the policy recommendations that drove the rise in inequality. Neoliberals, for example, see minimum wages as an inefficient friction in otherwise competitive and efficient labor markets. So, minimum wages have been allowed to be battered by inflation.
The neoliberal policy agenda has often had its most enthusiastic proponents among economists. Under the influence of neoliberalism the economics profession, encompassing both the liberal and conservative wings, shed many older but supremely valuable insights about the importance of institutional checks on markets (especially labor markets) and began analyzing all labor market developments through the lens of textbook competitive models. In these models, the great wage deceleration for the vast majority of workers after 1979 and the resulting rise in inequality could only have happened if impersonal market forces shifted relative demand or supply curves for different sorts of labor.
The mistake of assuming that markets are always well characterized by the simplest competitive models of textbooks proliferated well beyond the labor market. With regard to product markets, the assumption led economists to argue for a retreat from robust anti-trust enforcement and for the deregulation of industries in sectors such as trucking, airlines, interstate busing, and utilities. The assumption that financial markets were competitive led economists to argue for financial deregulation. The promotion of shareholder primacy, that corporations and executives should only advance the profit needs of shareholders, was an important component of this market fundamentalism.
But the greatest damage occurred in labor markets. The focus on labor market competition led to the promotion of “labor flexibility” to achieve growth; this policy agenda sought to weaken collective bargaining, worker protections, and the social safety net (e.g., unemployment insurance). If your model says that only apolitical market-driven shifts of demand and supply curves can explain wage and employment trends, then what might these forces be? As wage suppression took hold, the consensus of elite economists, both liberals and conservatives, excused it as the result of computer-driven automation, a factor we would neither want to nor could restrain. In this scenario, the sole answer is to provide more skills and college education for the workers who have skill deficits—or essentially telling workers that they themselves are to blame for their loss of quality jobs.
But these explanations just don’t fit the data, and when data and model conflict, the wise move is to follow the data. So, if the neoliberal analysis fails to explain wage trends, then the resulting neoliberal policy recommendations should be jettisoned. If we manage to do this, our analysis of just what has happened to U.S. wages and inequality will be stronger and provide a better basis for fixing these issues going forward.
A good example of how the policies we have adopted rather than markets explain wage trends can be found by looking at the wage gaps between workers of different races, genders, and ethnicities. Understanding wage suppression as the result of the exercise of power in labor markets widens our understanding of the potential sources of these long-standing race and gender disparities, gaps that widened during the coronavirus pandemic. The systemic racism that slots minority workers into lesser-paid jobs has made these workers the primary victims of the systematic weakening of worker power. Consequently, one of the key mechanisms to lessen racial and gender inequities is to restore worker power generally as well as to shape policy to ensure all workers have access to good jobs.
This paper’s analysis complements and points in the same direction as other recent research that has focused attention on worker power. For instance, Stansbury and Summers (2020) also argue that reduced worker power explains sluggish wage growth and a declining labor share of income. New empirical examinations of employer monopsony power have identified a growing (at least since the late 1990s) and pervasive employer ability to mark down wages from 20% to 50% and to exert more power over low-wage workers than others. This new monopsony literature provides a top-down analysis, estimating the aggregate potential employer power to suppress wages and then examining the contributing role of countervailing forces like unionization, high-pressure labor markets, and high values of minimum wages in explaining an aggregate net metric of employer power. In contrast, we provide a bottom-up analysis examining the impact of many specific factors and gauging their contribution to the overall divergence between productivity and median compensation growth.
Joseph Stiglitz (2012, 2021) has long focused on power in markets, emphasizing both product market monopoly power and the weakening of employee power relative to employers. He recently provided an analysis similar to the framework of this paper:
The commonsense statement that employers have power over their employees has long been heretical in the economics profession…. More and more, firms have demonstrated high and increasing levels of market power. At the same time, the bargaining power of workers has weakened…. his imbalance of market power has consequences…. It enables firms to suppress wages of workers below what they would be in a competitive marketplace—contributing to the inequality crisis facing the country…. Employers and employees need to be able to bargain on more-equal footing. (Stiglitz 2021)
Our research and these other recent findings demonstrate that employer power is ubiquitous in labor markets, and that wages will be lower and wage growth suppressed absent institutions and policies that provide countervailing power. In other words, employer power is a constant of modern labor markets, but what has changed over the past generation or two is the erosion of institutions and policies—high-pressure labor markets, robust enforcement, unions, and meaningful minimum wages—that once provided that countervailing power.
The paper proceeds as follows. The first step is examining the wage and profit trends that any theory of wage suppression needs to explain. The second section assesses the conventional explanation of “skill-biased technological change”—namely, that in the face of rapid technological change or automation workers lack the skills necessary for more modern production systems. The third section identifies the six factors, from excessive unemployment and eroded collective bargaining to shifts in corporate structures, that we believe much better explain wage suppression. The final section reviews how this paper fits into the overall literature on wage inequality and draws on the estimated impact of the various factors to establish how much they explain the overall divergence between productivity and median hourly compensation as well as the growth of the 50/10 wage gap and changes of the 10th percentile wage.
Wage trends and patterns to be explained
There are three remarkable disparities in growth of wages by workers’ wage rankings that policymakers need to understand and economists need to explain: the one between the highest earners (the top 1% and top 0.1%) and other high-wage earners; the one between high-wage and middle-wage earners (the 95/50 or the 90/50 wage gaps); and the one between middle- and low-wage earners (the 50/10 wage gap). In addition, a theory about wage trends will need to explain the decline in the share of overall income accruing to labor, since this drop saps wage growth; the differing growth rates by educational credential, especially four-year college degrees; the growing divergence between typical workers’ pay (including both wages and benefits) and economywide productivity; and the widening wage gaps that appear between workers of different races, genders, and ethnicities.
Wage growth trends by percentile
Below we delve into some detail in these trends. The rough summary of inflation-adjusted wage growth, detailed below, is as follows. Between 1979 and 2019 (the end of the last business cycle), inflation-adjusted annual wages at the very top have grown tremendously. Those in the top 1% enjoyed 160% growth, and those at the very top—the top 0.1%—experienced growth of 345%. Growth was much slower at the 95th percentile—63% (using hourly wage data), slower still at the 50th (15%), and a snail’s pace at the 10th (3%)—though it is worth noting that growth rates at the middle and the bottom were not remarkably different since the late 1980s. Two key wage gaps have grown since the late 1980s: the one between the top and very top on the one hand and all other earners, including even those at the 95th percentile, on the other, and the gap between high earners and middle earners, illustrated by the ratio of wages at the 95th (or 90th) percentile and the median wage.
Wages at the top—the upper 1% and 0.1%
One of the trends that went unrecognized and unexamined in the mainstream labor economics literature for decades was the remarkable growth for those in the upper 1% and the even faster growth among those in the top 0.1% of wage earners. This growth in wages for the highest-earning households is a key cause of the better-known phenomenon of growth in the household incomes of the top 1%, a finding popularized by Occupy Wall Street and based on the well-known data developed by Thomas Piketty and Emmanuel Saez (2003). The headline Piketty and Saez data are for households (“tax units” to be precise, but importantly they are not for individual workers) and include both wages earned by household members but also other income such as dividends, capital gains, and business income. However, one can analyze data to focus solely on wage and salary income of individual earners. Such an examination also shows superlative growth at the very top and demonstrates the importance of the upward redistribution of wage and salary income to the overall growth of top 1% household incomes.
Figure A, based on Social Security Administration data (see Mishel and Kandra 2020 for details), shows wage growth by the differing wage groups, including those at the top and very top. The Social Security data include all W-2 earnings as reported by employers (including the value of realized stock options and vested stock awards received by executives). Between 1979 and 2019, annual wages for the top 1% grew 160%. The wage growth of the top 0.1%—345%—is listed but not represented on the graph because it is on such a different scale.
In contrast, the wages of the bottom 90% grew by just 26% over those 40 years, with most of the growth occurring in a couple of brief and discrete periods of sustained low unemployment. The total wage growth in the 1995–2000 and 2013–2019 periods was 20%, roughly three-quarters of the cumulative wage growth for the bottom 90% over the entire 1979–2019 period. High earners in the 90th to 95th percentiles had wage growth faster than the vast majority (up 52%) but nowhere near that of those at the very top.
The share of all wages earned by those in the top 1% nearly doubled from 1979 to 2019, from 7.3% to 13.2%. Correspondingly, the share of wages earned by the bottom 90% eroded throughout this time, from 69.8% in 1979 to 60.9% in 2019 (Mishel and Kandra 2020). Had this redistribution not taken place, wages for those in the bottom 90% could have grown by 44.6%, 18.5 percentage points more than was the case.2 In short, the redistribution of wages from low and middle to high percentiles has greatly mattered for what the vast majority took home in their paychecks.
Wage gaps for most everyone else: The 95/50 and 50/10 gaps
Outside the top 1%, the clearest growth in wage gaps between percentiles in the wage distribution has been between high earners and middle-wage earners. This is often illustrated by the wage gap between the earners at the 95th percentile and the median (50th percentile) worker. Perhaps surprisingly to some, wage gaps in the bottom half of the distribution of wages (those between middle-wage and low-wage workers) have not grown for more than 30 years (basically since 1987–1988).
Figures B and C show the trends in the 95/50 and 50/10 wage gaps by gender. One striking dimension of the growth of wage inequality is the persistent, continuous growth of the wage gap between those higher up, the 95th percentile, and middle-wage workers since 1979, among both men and women (Figure B). The growth of the 95/50 wage gap has accelerated over time, growing faster in the more recent period (either 1995–2019 or 2000–2019) than it did earlier.3 The growth of the gap between those at the top and the middle of the wage distribution, and its acceleration after the late 1990s, is one of the key wage patterns that need to be explained.
In contrast, there has been little change (or an actual decline) in the 50/10 wage gap since the late 1980s (Figure C). The log 50/10 wage gap (using the same data as in the figure) grew from 0.57 in 1979 to 0.75 in 1987 and then declined to 0.68 in 2000 and to 0.65 in 2019. There was a jump in this gap in the early and mid-1980s, especially among women. The fact that there was a much more modest increase in the 50/10 wage gap among men provides an important clue as to the source of this rising gap: the erosion of the real value of the federal minimum wage. Federal inaction on the minimum wage in the 1980s had a much larger impact on low-wage women than low-wage men because women are far more likely to earn wages low enough to be affected by the minimum wage. The importance of institutions (the federal minimum wage) in this case will become a pattern as we look at the data on wage gaps and their causes more generally. The decline in the 50/10 wage gap since 1987–1988 presents a severe challenge to explanations of wage inequality focused on skill or education premiums, since it appears that those with the least education fared somewhat better than those with middling educations. The fact that the 50/10 wage gaps were relatively constant since the late 1980s indicates that a similar, or related, set of forces were at work suppressing wages at both the bottom and the middle.
Wage differences by education
The academic and policy debate about wage inequality has often focused on wage gaps across education groups, especially between those with a (four-year) college degree versus those without. Growing education wage differentials have been the basis of the premier conventional explanation of growing wage inequality, which attributes it to “skill-biased technological change.” This theory holds that labor markets are well characterized by competitive models and that an exogenous technology shock—often identified as automation driven by information technologies—has reduced the relative demand for workers without a college degree relative to their college peers, leading to widening inequality between wage earners. The policy corollary to this view has been a call for workers to get college degrees.
The automation-driven skills-gap narrative is critically examined in a later section and in Appendix A. In this section the basic contours of education wage gaps over time are examined. The key metric for capturing education wage differentials is the college–high school premium, or simply the college wage premium, the difference in hourly wages between a college graduate and a high school graduate, controlling for demographic characteristics such as gender, race, and experience. The trend in the college wage premium since 1979 is shown in Figure D.4
The college wage premium grew sharply in the 1980s and early 1990s, the era when research arguing for a skills-based explanation of wage inequality grew in prestige. However, growth in the college wage premium has been quite modest since the mid-1990s: It rose by 17.5 log points over the 16 years between 1979 and 1995 but by only 6.4 log points in the 24 years from 1995 to 2019. In annual terms the premium grew 1.1% in the 1979–1995 period but just 0.3% between 1995 and 2019—and just 0.1% per year in the 2000s. The deceleration did not occur because there was an upsurge in the availability of college graduates; in fact, Autor, Goldin, and Katz (2020) show that the relative supply of college graduates grew more slowly in the 1999-2017 period than in the earlier 1979–1999 period.5
It is worth noting that other education wage differentials, such as that between high school graduates and those who left high school and between associate-degree holders and high school graduates, have been fairly stable since 1995. For example, the wage gap, regression-adjusted, between those with a high school degree and those not completing high school (or a GED) rose only slightly between 1979 and 1987—up 2.6 log points—hardly sufficient to explain the sharp rise in the 50/10 wage gap over that period. Between 1987 and 2018 this wage gap shrank by 3.0 log points, reversing the entire 1979–1987 rise and leaving the wage gap where it was in 1979. Since there was hardly any growth in education wage gaps among the bottom three education groups, any explanation for wage gaps in the bottom half that relies on education gaps has little explanatory power.
The gap between productivity and median hourly compensation
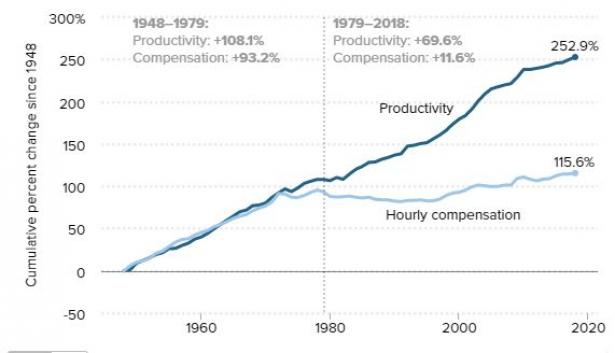
The last four decades have seen a systematic divergence between the growth of economywide productivity (the amount of income generated in an average hour of work) and the growth of hourly compensation (wages and benefits) for typical workers. We proxy the wages of “typical” workers as either wages for nonsupervisory workers (roughly 80% of the private-sector workforce) or wages for the worker earning the median wage. Figure E, which shows the growth of productivity and the typical worker’s hourly compensation since 1948, uses the hourly compensation of production-nonsupervisory workers because that is the only series available for the entire period since 1948.6 While productivity and a typical workers’ compensation grew in tandem over the 1948–1973 period, they diverged thereafter, splitting entirely after 1979. In the latter period productivity decelerated significantly, but much more rapid deceleration (or even stagnation) occurred in a typical worker’s compensation. Productivity grew 108.1% from 1948 to 1979, accompanied by 93.2% growth in a worker’s compensation. Between 1979 and 2018 productivity grew 69.6% (1.2% annually) further, but a typical worker’s compensation (wages and benefits) grew only by 11.6% (0.24% annually).
This divergence was first pointed out in the early 1990s (Mishel and Bernstein 1994) to demonstrate that stagnant wages for the typical worker over the previous decade or so could not be explained solely by the slowdown of productivity growth. Bivens and Mishel (2015) examined the wedge between typical workers’ pay and productivity and decomposed the main factors generating it. Once technical influences like differing price deflators were accounted for, the remaining wedge between pay and productivity growth was driven by two facets of inequality: the decline in labor’s share of income (particularly in the 2000s) and the growth of inequality of compensation, such that compensation grew far faster at the very top, as shown above.7 In other words, the factors driving inequalities in the labor market are responsible for workers’ inability to make gains commensurate with productivity growth. Whether workers make wage gains commensurate with future productivity growth will depend on whether we prevent this ongoing, and eminently preventable, growth in wage inequality. These dynamics will, in turn, dictate the extent of inequalities across households.
What has this divergence meant for a typical worker’s compensation? Building on the Bivens and Mishel (2015) analysis, we calculate that between 1979 and 2017 economywide productivity rose 68.1% while median hourly compensation rose 13.0% (the median hourly wage rose 12.2%), yielding a 55.2 percentage point divergence. Excluding the impact of differing price deflators (using the same index to deflate both productivity and median hourly compensation) yields a 43 percentage point divergence. Thus, the pay for typical workers would be more than 40% higher today if inequality had not risen over the 1979–2017 period. In the final section we examine the impact of particular factors to gauge whether their cumulative impact can explain the productivity–median compensation divergence. We use the 1979–2017 period as the benchmark, since that period corresponds to some key estimates of the impact of particular factors on median wages.
The decline in labor’s share of income
One of the trends that alerted analysts to the erosion of worker bargaining power and the corresponding strengthening of employer bargaining power has been the erosion of labor’s share of income in the 2000s. The distributional conflict between workers and employers (or capital and labor shares) is best examined in the corporate sector, where all income is divided between compensation going to workers and income accruing to owners of capital. Focusing on the corporate sector hence avoids issues of having to decide whether some other form of income—”proprietor’s income,” or income of noncorporate businesses—is labor or capital (see Bivens 2019 for measurement details).
The trend in the labor share of corporate-sector income is presented in Figure F.
The data clearly show a lowering of labor’s share in the 2000s, even when cyclical ups and downs are factored in. In business cycles before the 2000s, labor’s share generally rose during recessions, as profits fell, but then dropped sharply in early recoveries, as high unemployment weighed on wage growth even as the economy and profits recovered. By the time of each business cycle peak, labor’s share had generally recovered its previous peak. After 2000, though, labor’s share has often not recovered its previous peak following recessions. For example, it fell from 82.4% in 2000 to 77.9% in 2007, the last year before the Great Recession, and by 2016, when unemployment had reached levels comparable to what had prevailed in 2006 and 2007, it remained roughly 2.5 percentage points below its 2007 level. The fall in labor’s share from 82.4% in 2000 to 75.5% in 2016 is the equivalent of an 8.4% across-the-board cut in compensation for every employee; equivalently, it would require an across-the-board compensation boost of 9.1% to restore labor’s share to its 2000 level.8 This computation may exaggerate the impact of labor’s falling share, since 2000 was a near high point for it historically, driven in part by unemployment falling to its lowest level in decades (4.0%). However, the unemployment rate in 2018 and 2019 also averaged below 4.0%, and labor’s share ended 2019 at 77.3%, well below 2000’s level. This shift toward greater capital income and returns is even more impressive given that real interest rates have fallen sharply in recent years, a development that should (all else equal) be accompanied by a lower return to capital (Farhi and Gourio 2018).
Wage disparities by race and gender
Race and gender wage disparities have been persistent and insidious and reflect key dynamics that need to be understood in any analysis of the labor market.
Most measures of overall gender wage inequality have fallen over the last four decades. Figure G traces the gender wage gap over 1979–2019 in two ways, the percentage gap between the male and female median wage and the unexplained (log) percent of the gender wage gap (on average) after controlling for race and ethnicity, education, age, and geographic division. By both measures the wage disparities between men and women have substantially declined. The gap at the median has been cut in half, from 36.7% in 1979 to 15.8% in 2019, and the gap that is unexplained fell from 37.7 to 22.6 log points.
Conversely, most measures of Black–white wage disparities have grown in the last four decades (Figure H) and have exacerbated the growth of overall wage inequality (Wilson and Rodgers 2016; Wilson 2020). The increase has not occurred along a straight line, however. During the early 1980s rising unemployment, declining unionization, and policies such as the failure to raise the minimum wage and lax enforcement of anti-discrimination laws contributed to the growing Black–white wage gap. During the late 1990s the gap shrank in part due to increases in the minimum wage and in part to tighter labor markets, which made discrimination more costly to employers. Since 2000 the gap has grown again. As of 2015, relative to the average hourly wages of white men with the same education, experience, metro status, and region of residence, Black men made 22.0% less and Black women 34.2% less. Black women earn 11.7% less than their white female counterparts. The median Black worker’s hourly wage rose only 5.3% from 1979 to 2019, lagging far behind the 20.0% hourly growth enjoyed by the median white worker. The 7.6 log point growth of the “unexplained” portion of the Black–white average wage gap suggests that the economic bite of discriminatory pay practices has grown and accounts for a large share of the relative wage growth disadvantage of Black workers.9
The causal connection between racial, gender, and ethnic wage growth differences and wage growth differences by percentiles likely runs in both directions. On the one hand, because white women and Black workers tend to be disproportionately concentrated in the bottom 90% of the wage distribution, any force that suppresses wages for the bottom 90% will make them lose ground to white men and whites overall, all else equal. In a study of racial differences in household income, for example, Manduca (2018) finds that the percentile rank of the median Black household in the overall household income distribution climbed rapidly between 1968 and 2016, from the 24th to the 36th percentile. Yet because inequality concentrated gains in the top half of the income distribution over that time, and because white households were disproportionately concentrated in the top half, the income gap (measured in dollars or as a percentage) between white and Black households actually grew. So, a redistribution of income or wages to top and very top earners can increase gender and racial inequities even when Blacks and women achieve better equity among the bottom 90%.
Conversely, racial and gender differences in pay could in theory feed through to measures of inequality by percentile. For example, if the gap in wages paid to otherwise-equivalent Black and white workers can be pocketed entirely by the employers of Black workers, then this pay-setting discrimination would translate one-for-one into lower measured wages of typical workers of all races. If, on the other hand, pay-setting discrimination reflects employer preferences for white workers over Black workers, then some of this Black/white wage gap is a de facto transfer from Black workers to white workers. Less mechanically, if the maintenance of racial and gender wage gaps fosters division and hamstrings collective cross-race and cross-gender efforts to raise wages in workplaces, then these gaps could be a powerful force for employers looking to keep overall wages suppressed.
The failure of automation and skill gaps to explain wage suppression or wage inequality
That a huge proportion of U.S. workers have “skills deficits,” i.e., lack the skills necessary to deal with technological change (including primarily automation of the tasks performed by workers without a four-year college degree), has been the predominant explanation offered by economists, pundits, policymakers, and the media to explaining sluggish wage growth and inequality in the United States, at least until recently (see Box A for why we focus on “automation” rather than a more general “technological” explanation). This is the skill-biased technological change hypothesis, which points to the increased use of computer equipment in the workplace and the onset of the information age. One version, focused on education wage gaps, argues that computerized automation has made more-educated workers—generally referring to those with at least a four-year college degree—more valuable to employers and has correspondingly reduced the value of those without a college degree (Katz and Murphy 1992; Goldin and Katz 2007, 2008). This growing wage gap between college-educated and non-college-educated workers—the college wage premium—is used to explain rising wage inequality between high earners and the majority of earners who lack a four-year college credential (62% of earners in 2019, down from 82% in 197910).
BOX A
The difference between ‘technology’ and ‘automation’ as a driver of inequality
Economists inadvertently talk past the public when they refer to “technology” driving wage inequality when they are really talking about the skill-biased technological change thesis, which centers on workplace automation of tasks performed by workers without a four-year college degree. Technological change is a broad term that applies to everyday life and involves communications technology, technology embedded in consumer products (e.g., phones, cars, energy-saving appliances), and other technologies separate and independent of workplace automation. There may be rapid change in the technologies observed in consumer products or in telecommunications even though workplace automation—and its relative effect on workers with different education credentials—is proceeding at a historically average or slower pace. Changes in communications technology may help fuel globalization and may help enable domestic outsourcing (“fissuring”) to be undertaken more cheaply, but these channels through which technology may affect labor market trends are quite different than those sketched out by theories of skill-biased technological change in the workplace.
Skill-biased technological change represents automation, the change in production methods where machinery and software replace the tasks formerly performed by workers without a four-year college degree, thereby generating a new mix of the human capital needed (more “skilled labor,” less “less-skilled” labor).
A second version of the automation story, frequently referred to as the “job polarization thesis,” argues that technological change
has increased the value of abstract reasoning, of creativity, of expertise, of judgment and devalued a lot of skilled work that people did that followed well-understood rules and procedures. So that would be many clerical jobs, phone answering jobs, calculating, accounting, bookkeeping, copying, and filing, but also many production jobs, which often involved skilled, repetitive tasks. But increasingly once we understand the rule book for that type of work, it’s feasible to encode it in software and have it executed by machines or by computers.” (David Autor, interviewed by Greenhouse 2020)
This type of automation sees the replacement of human labor by computers or other modes of automation as not just falling along the lines of greater/fewer education credentials (whether a worker has a college degree or not). Instead, occupational susceptibility to having tasks automated is said to be “polarized”—middle-wage occupations specializing in routine, automatable tasks shrink while employment expands in both higher-wage “abstract reasoning” occupations and in lower-wage non-routinized occupations.
These versions of skill-biased technological change portray the cause of wage suppression and wage inequality as due to a factor, automation, that is both inevitable (one can’t stop technology’s forward march) and desirable (after all, technological change is a key driver of rising living standards). Thus, the resulting economic adversity for some workers is the unfortunate byproduct of a dynamic that one would neither want to nor could change. Given this view, the only appropriate remedy is to adapt to automation, primarily by upgrading workers’ skills and education and perhaps by providing a more adequate safety net for workers temporarily displaced.
The skills narrative is the premier explanation of wage inequality that relies on the existence of competitive labor markets and sees a role for policy only in fostering skills development—not in boosting workers’ bargaining power or mandating changes in corporate practices. As such, the failure of the skills narrative to explain wage suppression and wage inequality also reflects the failure of analyses based on equal bargaining power between employers and employees and competitive labor markets to adequately address one of the most salient features of the economy over the last four decades.
As examined in detail in Appendix A, skill-biased technological change has always been a weak explanation for the wage trends since 1979, but is a prima facie implausible explanation for the trends since the mid-1990s or since 1999. None of the basic indicators of automation’s impact and of skill deficits used to establish these narratives has been evident over the last 25 years. Consequently, there is no basis for considering automation-driven skill-biased technological change as a significant factor in wage suppression or the growth of wage inequality since the mid-1990s—and we assign it an impact of zero since 1995 in our analysis below.
The extreme weakness of the hypothesis is why the consensus, at least of center-left economists, no longer highlights it in discussions of wage problems. Lawrence Summers went so far as to say:
I am concerned that if we allow the idea to take hold that all we need to do is there are all these jobs with skills and if we just can train people a bit then they will be able to get into them and the whole problem will go away. I think that is fundamentally an evasion of a profound social challenge. (Summers 2015, 75–76)
The following sections, drawing on Appendix A, offer some critiques of the skills narrative, focusing particularly on its inability to explain wage trends since the mid-1990s.
Omissions in the skills-based wage-gap story
One problem with the automation narratives is that they ignore, or perhaps fail to address, important dimensions of wage suppression and wage inequality. For instance, they sidestep the superlative wage growth of the top 1% (and the top 0.1%) and the corresponding upward shift of 6 percentage points of aggregate earnings to the top 1% between 1979 and 2019 (Mishel and Kandra 2020). The growth of wages for the top 1% primarily reflects the growth of executive compensation and the expansion of the financial sector (and its high earners). Similarly, the narratives accord no attention to the erosion of labor’s share of income, and the data show that the link between automation and the decline of labor’s share is at least as inconsistent with real-world data as is the link between automation and wage inequality (Stansbury and Summers 2020). These are substantial oversights.
Evidentiary problems with the skills-gap, or automation, hypothesis
Recent research by the leading proponents of the skill-biased narrative (Autor, Goldin, and Katz 2020) demonstrates the failure of this hypothesis to contribute to our understanding of wage suppression since the mid-1990s. The three biggest evidentiary failures are the following.
There has been little growth in the college wage premium
Autor, Goldin, and Katz (2020) note that “returns to a year of college rose by 6.5 log points, from 0.076 in 1980 to 0.126 in 2000 to 0.141 in 2017.” Yet note the slowdown from the 1980–2000 period to the 2000–2017 period. In the former period, the log college wage premium rose 0.0325 percentage points each year, far faster than the 0.0088 percentage point increase each year between 2000 and 2017. This represents a 70% reduction in growth. Given that the log 95/50 wage gap grew faster between 2000 and 2019 than in 1979–2000 (see Appendix Figure A), it is evident that the education wage gap has not driven wage inequality in the top half since 2000.
There has been a sharp deceleration in automation-driven relative demand for college graduates since the mid-1990s
The substantial deceleration in the college wage premium, even as the supply of college graduates slowed, implies a dramatic slowing in the growth of relative demand for college graduates. As Autor, Goldin, and Katz (2020) note:
he model’s results…divulge a puzzling slowdown in the trend demand growth for college equivalents starting in the early 1990s. Rapid and disruptive technological change from computerization, robots, and artificial intelligence is not to be found though the impact of these technologies may not be well captured by this two-factor setup.
Their results (based on Autor, Goldin, and Katz, Table A2) show a deceleration in growth of relative demand for college graduates in the 1999–2017 period relative to earlier periods: a 45.8% deceleration relative to the 1979–1999 period and a 41.8% deceleration relative to the longer 1959–1999 period. The period since 1999, therefore, has been one featuring a historically small impact of automation on (relative) demand for college graduates.
Autor (2017) provides similar findings in an update of the Katz and Murphy (1992) metric of relative demand for college graduates and dates the slowdown to the mid-1990s.
If automation’s impact has been far less in the last 25 years than in earlier decades, it cannot explain the ongoing strong, even faster, growth of wage inequality in the top half, illustrated by the growth of the 95/50 wage gap.
There has been no expansion of the wage gap in the bottom half since 1987
In the skills-gap story, the more education workers have, the more they are in demand and the higher their wages. Yet over the last three decades there have been no increases in the wage gaps between those with some college, those with a high school diploma, and those who left high school. Similarly, that the wage gap between median (50th percentile) workers and low-wage (10th percentile) workers has been stable or declining since 1987 stands as a long-standing critique of the education wage-gap hypothesis (Mishel, Bernstein, and Schmitt 1997a; Card and DiNardo 2002; Acemoglu and Autor 2012).
Evidentiary problems with claims that ‘occupational polarization’ of labor demand can explain wage patterns
As mentioned earlier, a recent twist on the traditional story of skills-driven wage trends is the idea of labor market “polarization.” In this view, labor demand has not been rising commensurately with every level of education; rather, there has been an increase in labor demand for high-skill occupations but also for nonroutine manual occupations generally associated with low wages. The losers are those with routine, nonabstract skills that have traditionally been associated with middle-wage occupations, such as in manufacturing.
There are two clear empirical problems with the polarization narrative as an explanation for the wage trends over the full 1979–2019 period.
There has been no occupational employment polarization since 1999
Most strikingly, Autor (2010) and Acemoglu and Autor (2012) document that job polarization has not been evident since 1999:
rowth of high-skill, high-wage occupations (those associated with abstract work) decelerated markedly in the 2000s, with no relative growth in the top two deciles of the occupational skill distribution during 1999 through 2007, and only a modest recovery between 2007 and 2012. Stated plainly, the U-shaped growth of occupational employment came increasingly to resemble a downward ramp in the 2000s. (Autor 2014)
A “downward ramp” and the absence of a “U-shaped growth of occupational employment” amount to an acknowledgment, although offered in a less-than-direct fashion, that job polarization was not present between 1999 and 2012.
Occupational employment patterns do not correspond to wage patterns
The job polarization narrative relies on mapping occupational employment patterns to explain wage trends. But surprisingly, the polarization literature has never presented evidence that these occupational employment shifts directly affect wages. And indeed, they don’t. Mishel, Shierholz, and Schmitt (2013) show that in the 1980s, 1990s, and 2000s, changes in occupational employment shares (whether employment in an occupation expands or contracts relative to other occupations) were not related to changes in relative wages by occupation (whether wages rose or fell in that occupation relative to wages of other occupations). It is also worth noting that middle-wage occupations have shrunk and higher-wage occupations have expanded since the 1950s, but median wages and wage inequality have risen and fallen over this time with no apparent correspondence to employment polarization trends.
If occupational employment patterns do not directly correlate with occupational relative wages, then the narrative that employment polarization reflects a shift in the relative demand for specific types of skills makes little sense; shifting relative labor demand curves should cause both employment and wages to move together. Moreover, if occupational job polarization does not shape relative occupational wages, then it is certainly not much of an explanation for wage inequality.
A more convincing theory of sluggish wage growth and inequality in the U.S.: Policy-driven wage suppression
If forces unrelated to policy decisions, particularly automation, do not seem to be driving wage trends, what are the factors leading to wage suppression? Our answer is that there has been an intentional policy assault—including policy forbearance in the face of new anti-worker business practices—that diminished the institutional sources of leverage and bargaining power for typical workers in the labor market. The point was to suppress labor costs. This policy assault (acts of commission and omission, such as failing to update labor law or the value of the minimum wage) either directly undercut these institutional sources of power or accommodated employers’ efforts to undercut them. Business forces were secure knowing that policymakers (legislators, executive branch officials, and judges) would not change legislation, enforcement priorities and effectiveness, or legal interpretations to countermand this assault on a typical workers’ power in the labor market.
Why this policy and corporate assault began when it did, and why it was successful politically, are questions mostly outside the bounds of this paper. (See two relatively recent books by Hacker and Pierson (2011, 2020) for the political science explanations.) Among academic and policy economists starting in the 1970s, policies promoting wage suppression were forwarded as the solution to decelerating productivity growth, accelerating inflation, and high unemployment, where the goal was to improve aggregate efficiency and growth. But it did not work: Economic growth between 1979 and 1995 was historically slow, and the brief pickup between 1995 and 2000 was driven by a burst of business spending to connect to the internet and the decision by the Federal Reserve to shunt aside inflation fears and allow unemployment to fall to historically low levels. Slow productivity growth reasserted itself quickly in the 2000s as the burst of information-technology investment receded.
BOX B
Wage suppression and the upward distribution to the top 1%
The data are clear that wage growth for the vast majority of U.S. workers decelerated radically in the post-1979 era. This near-stagnation of wages cannot be nearly fully explained by the slowdown in the economy’s overall ability to pay higher wages (measured, for example, by growth in economywide productivity). Overall economic growth did slow significantly post-1979, but growth for the bottom 90% of wage earners slowed far more. This pattern left a large excess available for the top 10% to grab, and most of it went to the top 1% and, especially, the top 0.1%. While this paper does not undertake to directly explain the growth of wages at the very top—those of the top 0.1% and 1%—we would argue that this growth is just the mirror image of wage suppression at the bottom. The forces that weighed on wage growth for the majority (excess unemployment, stagnation of the minimum wage, deunionization) largely do not slow wage growth for the top 1%; instead, they just allow more income (income, wages, and profits that are not going to typical workers’ paychecks) to be claimed by the very top. In a sense, the wage suppression felt by the bottom 90% was zero-sum (or even negative sum), as their loss financed a sharp redistribution of wages and incomes to the very top.
As Bivens and Mishel (2013) argue:
The increase in the incomes and wages of the top 1% over the last three decades should be interpreted as driven largely by the creation and/or redistribution of economic rents, and not simply as the outcome of well-functioning competitive markets rewarding skills or productivity based on marginal differences. This rise in rents accruing to the top 1% could be the result of increased opportunities for rent-shifting, increased incentives for rent-shifting, or a combination of both. Second, this rise in incomes at the very top has been the primary impediment to having growth in living standards for low- and moderate-income households approach the growth rate of economywide productivity. Third, because this rise in top incomes is largely driven by rents, there is the potential for checking (or even reversing) this rise through policy measures with little to no adverse impact on overall economic growth.
As evidence for this view, Bivens and Mishel highlight the growth of chief executive officer (and other executive) pay and the incomes of financial-sector professionals. A vast body of research demonstrates that no plausible force coming from the interplay of competitive markets could account for the explosive income growth of these actors. These are not the “just deserts” of the high earners reflecting their heightened productivity.
The opinions of academic economists aside, the larger political dynamics of why this wage-suppression campaign began and became a key priority for corporate and business interests in the 1970s are clearly important. Levy and Temin (2007), Bivens (2010), and Mishel, Rhinehart, and Windham (2020) provide an overview of this period and document the concerted shift of the corporate sector away from the “Treaty of Detroit” regime established in the early 1950s that tolerated (or even encouraged) collective bargaining and toward policies maximizing shareholder value and deregulation. The falling profitability of the corporate sector in the 1970s was clearly a part of this dynamic, as was the rising ease of moving production offshore.
While the root causes and the political support behind the policy assault on bargaining power are not addressed here, a growing body of evidence shows that the specific policies launched in this attack can explain the overwhelming majority of wage suppression experienced in recent decades. This section examines these policies and estimates the impact of each. When added together, as we do in the final section, the impact is large enough to explain the lion’s share of the 43% difference since the late 1970s between the growth of median hourly compensation and economywide productivity.
Austerity macroeconomic policy: Excessive unemployment
The Federal Reserve Board’s dual mandate is to pursue the maximum level of employment consistent with stable inflation. However, since 1979 the Fed’s actions suggest that it took the inflation mandate more seriously, thereby tolerating (by failing to lower) or actually generating excessive unemployment for extended periods in the name of keeping inflation tame. Whenever an economic expansion pushed unemployment down, the Fed often feared that tighter labor markets would mean that workers, endowed with more leverage since they were now in a better position to quit or strike, would demand higher nominal wages, in turn putting upward pressure on inflation.
Wage growth resulting from tight labor markets can indeed feed into price growth, and so sufficiently empowered workers may demand even higher wages, allowing wage/inflation momentum to build. The policy recourse for stopping the wage/price spiral has traditionally relied on the Fed raising interest rates to slow the expansion and stop the downward movement of unemployment.
Presumably in this policy vision there is a sweet spot where workers can experience decent wage growth without fostering unsustainable inflationary pressure. But nobody knows for sure beforehand where that level is, and efforts to empirically identify the economy’s “natural rate of unemployment” are notoriously imprecise (Staiger, Stock, and Watson 1997). Given this uncertainty, the Fed must exercise judgment in weighing the benefits of tighter labor markets against the risks of inflationary pressure. Too often in the post-1979 period, Fed policymakers have been so worried about the inflation risks and not impressed enough by the benefits of full employment that they have raised interest rates prematurely and cut expansions short before they generated decent wage growth. The result has been unemployment higher than it had to be to ensure stable inflation.
Historically, the anti-inflation orientation of the Fed was quite political and conscious of the institutional determinants of wage growth. Specifically, past Fed chairs, determined to keep wage growth “moderate,” explicitly saw the use of high unemployment as a means to restrain union-negotiated wage increases or even to seek union wage concessions.
Mitchell and Erickson (2005) characterized this policy orientation during the era of Paul Volcker’s chairmanship of the Fed (1979–1987), when there was a deep recession and a sharp reduction in unionization (40% of the erosion of unions over the 1979–2017 period occurred in 1979–1984):
Volcker viewed affecting union wage determination through monetary restraint as important for the Fed’s disinflation campaign. One commentator characterized the Fed chair’s view as founded on the idea that “inflation would not be securely defeated…until all those workers and their unions agreed to accept less. If they were not impressed by words, perhaps the liquidation of several million more jobs would convince them.” …Others at the Fed apparently had similar wage-push ideas. To Volcker, direct intervention in particular wage settlements was not desirable (and clearly not the province of the Fed). But a monetary squeeze that forced the union sector to hold down nominal wages in the hopes of preserving jobs was an appropriate policy instrument. Squeeze the unions and other wages (and prices) would fall into line.
Hooper, Mishkin, and Sufi (2019, 25) note that “since the 1980s the Fed focused much more on avoiding labor market overheating in order to stabilize inflation.” The discussion in Appendix B provides a further analysis of the Federal Reserve policy that maintained excessive unemployment.
Bivens and Zipperer (2018), analyzing the links between excess unemployment and wage growth, note that full employment (at least by the too conservative measure of matching actual unemployment to preexisting estimates of the “natural rate”) was the norm after World War II but became the exception after 1979. Between 1949 and 1979, the cumulative difference between the actual unemployment rate and estimates of the unemployment rate consistent with stable inflation—the “natural rate” or the NAIRU, the nonaccelerating inflation rate of unemployment—was negative 15.3 percentage points, meaning that on average actual unemployment was 0.52 percentage points below the estimated NAIRU each year. In contrast, between 1979 and 2017 the cumulative difference was positive 35.7 percentage points, meaning that actual unemployment was persistently above the estimated natural rate. This trend was not driven only by the Great Recession: Between 1979 and 2007 the cumulative difference was a positive 15.5 percentage points. Put another way, unemployment was 1 percentage point higher each year in 1979–2007 than in 1949–1979.
This consistent excess unemployment was deeply damaging to wage growth. Research indicates that a 1 percentage point drop in unemployment results in annual wage growth 0.5–1.5 percentage points faster for workers at the 10th percentile. For example, if annual real wage growth is 1%, then a 1 percentage point fall in unemployment would result in annual real wage growth rising to 1.5% to 2.5%. For workers near the median of the wage distribution, wage growth is faster by 0.4–0.9 percentage points, and for workers at the 90th percentile it is 0.3–0.5 percentage points faster. These estimates indicate that excessive unemployment generates increases in both the 50/10 and 90/50 wage gaps.11
Using the lower bound of the Bivens and Zipperer estimates to assess the impact of excessive unemployment on median and 10th percentile wages in the 1979–2017 period, we find excessive unemployment had lowered the median hourly wage by 12.2%. These estimated impacts of unemployment are far below those of Katz and Krueger (1999, Table 8), whose Phillips curve estimates using a 1973–1998 time series were double those of Bivens and Zipperer at the median and three times those at the 10th percentile.
However, to err on the side of caution we make an adjustment to our estimates of the wage impact of higher unemployment to account for the “flattening” of the Phillips curve in recent years (a lessening of the relationship between unemployment and wage growth): We apply one impact for the 1979–2007 years and a lesser impact for the 2008–2017 years.12 The coefficient on unemployment levels in regressions explaining wage growth is notably smaller in the time period after 2008.13 It should be noted that, as Hooper, Mishkin, and Sufi (2019) found, the “wage-Phillips curve…flattened significantly less and retained greater nonlinearity” than the price Phillips curve. However, one should be clear what is driving the flattening of the wage Phillips curves in the post-2008 period: the failure of high unemployment to force actual reductions in nominal wages in just a small number of years (2008-2014, mostly), a finding highlighted in Bivens (2019). If one removes this subset of years from the sample, the regression coefficient for the overall post-1979 sample is far closer to what one obtains from running the regression over the period from 1979 to 2007. It seems clear that this is the issue of “downward nominal wage rigidity bending the Phillips curve,” as expressed by Daly and Hobijin (2014). This implies that we are overcorrecting in our markdown of the impact of unemployment on wages post-2008; that is, we are understating the negative impact of high unemployment.
Taking this flattening of the Phillips curve into account we find that, if unemployment over 1979–2017 had averaged just the “natural rate” of 5.5% rather than 6.3%, median wages would have been 10.0% higher in 2017. If the unemployment rate had been held even lower, say 5.0%, median wages would have been 18.3% higher by 2017.
About a fourth of this impact is the result of the corrosive effects of the extended period of high unemployment following the Great Recession. In those years, the real culprit for keeping labor markets too soft to generate decent wage growth was not the Federal Reserve Board (the Fed actually tried hard to boost economic growth in those years). Instead, fiscal policymakers—both the Republican-led Congress and state and local governments after 2010—imposed historically contractionary degrees of spending austerity.
As analyzed in the final section, excessive unemployment’s impact on the median wage of 10.0% can explain nearly a fourth of the productivity–median compensation divergence of 43.0% and is a sizable factor expanding the wage gaps in both the bottom and top halves of the wage structure. For instance, excessive unemployment had a larger impact on low-wage workers, lowering the 10th percentile wage by 11.6% by 2017 and raising the 50/10 wage gap by 2.7 percentage points. If our analysis uses 5.0% rather than 5.5% as the full employment target, then the 10th percentile wage would have been 21.2% higher in 2017 absent excessive unemployment.
Because Black workers are disproportionately concentrated in the bottom half of the wage distribution, the corrosive effect on wage growth of excess unemployment falls more heavily on them. Wilson (2015) has found that the wage-depressing effect of each additional percentage point of unemployment is roughly twice as large for the median Black wage as for the median white wage. Wilson and Rodgers (2016) find that the wage penalty for the median Black worker relative to the median white worker increased by nearly 9 percentage points between 1979 and 2014. This growth in the Black–white wage gap could be entirely explained by excessive unemployment over this period, given the differing responsiveness of Black and white wages to unemployment.
Erosion of workers’ rights to form unions and bargain collectively
The erosion of collective bargaining has been a major factor that has depressed wage growth in the middle and drove the growth of wage inequality over the last four decades. In fact, the only factor having a larger impact is the excessive unemployment perpetrated by policymakers. The impact has been especially adverse for men because they were far more likely to be unionized in 1979 than women (31.5% versus 18.8%), so men had more to lose from the subsequent attack on unions and collective bargaining.14
That collective bargaining leads to more equal wage outcomes was firmly established by research by Richard Freeman and James Medoff in the late 1970s and popularized in their important book, What Do Unions Do?, published in 1984 (Jake Rosenfeld’s 2014 book, What Unions No Longer Do, provides an update of the issues). Consider first the ways that collective bargaining leads to more equal wage outcomes among unionized workers and in unionized industries and occupations.15 First, unions make wage differences between occupations more equal because they give a larger wage boost to low- and middle-wage occupations than to high-wage occupations. Second, unions have boosted wages for low-wage workers the most, and increases have been larger at the middle than at the highest wage levels, larger for Black and Hispanic workers than for white workers, and larger for those with lower levels of education. This pattern of wage increases narrows wage inequalities. Third, unions make wages of workers with similar characteristics more equal in union settings because wages are “standardized,” meaning that wages are set for particular types of work and do not vary across people doing the same work to the same degree as exists in nonunion settings. Fourth, unions have historically been more likely to organize middle-wage than high-wage workers, which lowers inequality by closing gaps between, say, blue-collar and white-collar workers.16 The union impact on inequality is even greater with compensation than with wages alone (Pierce 1999).
Research from the early 1990s documented that the erosion of collective bargaining was responsible for around a fifth of the rise in wage inequality among men in the 1980s (Card 1991; DiNardo, Fortin, and Lemieux 1996; Freeman 1991) but had a more modest impact on women’s wage inequality.
More recent research has incorporated an assessment of the impact of unions on nonunion workers’ wages—sometimes referred to as “spillover effects”—and finds a much larger impact. When the share of workers who are union members is relatively high, as it was in 1979, wages of nonunion workers are higher. For example, had union density remained at its 1979 level, weekly wages of nonunion men in the private sector would have been 5% higher in 2013, equivalent to an additional $2,704 in earnings for year-round workers; among those same workers but without a college education wages would be 8% higher, or $3,016 more per year (Rosenfeld, Denice, and Laird 2016; Denice and Rosenfeld 2018).17 Consequently, estimates of the impact of eroded collective bargaining on wage inequality that incorporate union spillover impacts find a larger role of the impact of unions on wage inequality. For instance, Western and Rosenfeld (2011, Table 2 and analyzed in Mishel et al. 2012, Table 4.38) find that the weakening of collective bargaining explains a third of the increase in male wage inequality and a fifth of the rise of wage inequality among women over the 1973–2007 period. Such research demonstrates that the erosion of collective bargaining has been the largest single factor driving a wedge between middle- and high-wage male workers, which, as established above, is the main dimension of wage inequality that grew among men other than the soaring of earnings for the top 1% (keep in mind that the wage gap between middle- and low-wage men has not grown).
The most recent research provides a more up-to-date analysis that incorporates a spillover impact and provides additional insight because the results directly report on the impact of eroded collective bargaining on the wage gap between high-wage (90th percentile) and middle-wage (50th percentile) workers by gender. These results from Fortin, Lemieux, and Lloyd (2021) are shown in Table 1.
The erosion of unions (column 3) can explain from 28.8% to 36.7% of the growth of male wage inequality as measured, respectively, by the standard deviation of log wages and the Gini coefficient. The most salient finding is that eroded unionization explains 37.3% of the growth of the 90/50 wage gap over the 1979–2017 period. As discussed earlier, this is the only source of growing wage inequality among men in the bottom 90% of earners. Fortin, Lemieux, and Lloyd (2021) show a smaller impact of eroded unions on women’s wage inequality; the erosion explains 6.7% to 8.8% of the growth of women’s wage inequality as measured by the standard deviation of log wages and the Gini coefficient and only 13.0% of the growth of the 90/50 wage gap.
Using an (unpublished) analysis by Thomas Lemieux, who relied on the model in Fortin, Lemieux, and Lloyd (2021), we can examine the impact of deunionization on the median and the 90th percentile wages for men and women combined over the 1979–2017 period. Deunionization raised the log 90/50 wage gap by 7.7 log points, almost entirely by reducing the median hourly wage by 7.6 log points, or by 7.9% (0.2% annually). The impact on men alone is larger, with deunionization lowering the male median wage by 10.9 log points, or 11.6% (0.29% annually). Deunionization therefore explains 33.1% of the 23.2 log point growth of the 90/50 wage gap over the 1979–2017 period.
The Fortin, Lemieux, and Lloyd (2021) results are very comparable to those of Stansbury and Summers (2020). In particular, we have benchmarked the Fortin, Lemieux, and Lloyd estimates of the impact of deunionization on the median wage with the estimate of Stansbury and Summers of the impact on the non-college-educated wage. Once one aligns the time periods, one finds that the Stansbury and Summers estimate is even larger.18 The Fortin, Lemieux, and Lloyd results for how much deunionization explains the growth of wage inequality also align with those by Western and Rosenfeld (2011).19
Newly developed historical data from the early postwar period affirm that collective bargaining was a strong force for greater equality of wages. For instance, Callaway and Collins (2017), using data from a survey of men living in Philadelphia; New Haven, Conn.; Chicago; St. Paul, Minn.; San Francisco; and Los Angeles in 1951, found “the wage premium was larger at the bottom of the income distribution than at the middle or higher, larger for African Americans than for whites, and larger for those with low levels of education,” findings that are “consistent with the view that unions substantially narrowed urban wage inequality at mid-century.” It follows, of course, that the consequent erosion of collective bargaining would increase wage inequality and have the most adverse impact on nonwhite workers, those with the least education, and low- and moderate-wage workers.
Likewise, Farber et al. (2021, 33), who developed data on union households from Gallup surveys going back to 1936, find that “mid-century unions a powerful force for equalizing the income distribution.” This happened because unions disproportionately represented “disadvantaged” workers (nonwhite or less educated), raised the wages of low- and moderate-wage workers the most, and had a large, stable impact of raising wages for union workers by roughly 15–20 log points over the last 80 years.20
Some pundits and analysts, skeptical about the impact of weaker unions on wages or wage inequality, claim that the decline of unions reflects a decline in worker interest in unions or is due to globalization and automation, i.e., endogenous factors. Neither objection is well founded.
Kochan et al. (2018) examined the level of interest in joining a union among unorganized workers and found that the “demand for unions” has risen substantially since the late 1970s. Kochan and Kimball (2019) described these results as
differences in the percentage of non-union workers who indicated a preference for union representation in nationally representative surveys in 1977, 1995, and 2017. Note that the 1977 and 1995 results were nearly identical: approximately one third of the non-union workforce indicated they would vote to have union representation if given an opportunity to do so on their current job. In 2017 that number increased to 48 percent. This number translates into an under-representation of unions of approximately 58 million workers.
Mishel, Rhinehart, and Windham (2020) assess the endogeneity of union decline and find that manufacturing employment decline can account for only a small part of it, perhaps 15–20%. Ongoing automation of manufacturing and globalization surely contributed to the shrinkage of manufacturing employment and the loss of union jobs in manufacturing, but the authors point out that the share of workers covered by collective bargaining declined strongly across the private sector in sectors not heavily affected by globalization, including construction, transportation, communications, utilities, supermarkets, hotels, and mining. So, any focus limited to manufacturing will not capture the full picture. Moreover, the erosion of unions in manufacturing is not due only to automation and globalization.
An Organisation for Economic Co-operation and Development (OECD 2019b) analysis of the cross-country decline in collective bargaining across advanced nations found:
Contrary to a commonly held belief, the combined contributions of demographic changes and structural shifts, such as the shrinking of the manufacturing sector, are small and leave most of this declining trend [in collective bargaining] unexplained.
This confirmed an earlier analysis by Schmitt and Mitukiewicz (2012) that: “The observed patterns suggest that national politics are a more important determinant of recent trends in unionization than globalization or technological change.”
The primary reason that collective bargaining eroded was a concerted corporate attack on unions starting in the 1970s that exploited weaknesses in our labor laws to suppress the ability of workers to choose collective bargaining and organize (Windham 2017). The scale of union organizing collapsed, dramatically, in the 1970s as the share of nonagricultural workers in private-sector National Labor Relations Board elections fell from 1.0% to 1.2% each year in the 1950s and 1960s to just 0.3% each year in the 1980s and to 0.1% each year in the early 2000s (Mishel, Rhinehart, and Windham 2020). As Windham (2017) documents, this collapse of organizing was due to increased employer aggressiveness and use of both legal and illegal tactics, including captive audience meetings, threats of shutdowns or relocation, firing of union organizers, use of a rapidly expanded group of anti-union consultants, and process delays.
McNicholas et al. (2019), analyzing union representation elections that took place in 2016–2017 and building on earlier work by Bronfenbrenner (2009), have recently documented the pervasive lawlessness prevailing in union organizing attempts:
Employers are charged with violating federal law in 41.5% of all union election campaigns. And one out of five union election campaigns involves a charge that a worker was illegally fired for union activity. Employers are charged with making threats, engaging in surveillance activities, or harassing workers in nearly a third of all union election campaigns.
Other developments, enabled by employer aggressiveness and changes in the rules governing collective bargaining, limited collective bargaining power by eroding coverage and weakening unions’ ability to strike (Mishel, Rhinehart, and Windham, 2020).
Managing globalization on capital’s terms
Evaluating the impact of globalization on wages has been controversial because it has inevitably been intertwined with the politics of trade agreements. Some analysts contend that globalization has a barely measurable impact, while others see it as an all-encompassing force shaping everything, limiting our ability to have higher wages or pursue regulatory or tax policies. In fact, globalization has indeed put substantial downward pressure on wages for the vast majority, but its effects are likely not just driven by the mechanical impacts it has on demand and supply curves for different types of labor in a competitive model. Instead, it is as likely that globalization has played a powerful role in disempowering workers and giving capital owners and managers a much-improved fallback position in their bargaining with workers.21 As such, the way that globalization has proceeded from U.S. workers’ perspective has been profoundly shaped by intentional policy decisions that maximized its wage-suppressing effects.
Bivens (2017a) presents a summary of globalization’s wage impacts, based on his own calculations and on the wider economics literature. He finds:
The challenge of globalization for American workers is often painted as a problem of industrial workers losing their jobs to imports. Because manufacturing employment is now a small share of overall employment, these trade-induced losses are often described as “small and concentrated”.… But this assessment of the situation is wrong—growing trade (particularly with poorer nations) actually inflicts losses on the majority of the American workforce.… he big damage is the permanent wage loss resulting from America’s new pattern of specialization that requires less labor and more capital. Further, this wage loss is not just suffered by workers in tradeable goods sectors who are displaced by imports; it’s suffered by all workers who resemble these workers in terms of credentials and labor market characteristics. A simple way to say this is that while landscapers may not be displaced by imports, their wages suffer from having to compete with apparel (and auto, and steel) workers who have been displaced by imports…. The wage-suppressing effects of globalization hit all workers without college degrees, across the country. Workers of all races and ethnicities are affected, and communities of color are disproportionately harmed. The harm of globalization is absolutely not a niche issue affecting only white working-class workers in the upper Midwest.
Globalization has contributed significantly to wage suppression. The first round of the academic debate about trade and wages was spurred by debate over approval in 1993 of the North American Free Trade Agreement, and accordingly the debate relied largely on data from the late 1980s or early 1990s. The majority view of economists coming out of this debate was that trade was not putting significant downward pressure on wages. But this view persisted even as the underlying reality changed significantly. For example, Bivens (2013) found that the implied wage effects of trade expanded rapidly after 1995, as trade with lower-wage nations (particularly Mexico and China) picked up significantly. He also found that, by 2013, trade flows with low-wage nations were likely reducing wages for workers without a four-year college degree by roughly 5.6%. For a non-college-degreed worker making the median hourly wage and working full time, full year, the earnings reduction translated into just under $2,000 annually.
This estimate is nearly identical to what Autor, Dorn, and Hanson (2013) found in a regression-based investigation of the wage impacts of imports from low-wage countries. Their results indicate that each $1,000 in imports per worker from low-wage countries lower American wages by 0.7%. Imports from all low-wage countries in 2016 stood at roughly $8,000 per worker, implying a wage reduction of roughly 5.6%, or about $2,000 annually, for a full-time worker earning the median wage.
Policy decisions have amplified globalization’s downward wage pressure. Much of the conventional wisdom among Washington policymakers has assumed that the trade agreements signed in the past 20-odd years have been exercises in good-faith liberalization of trade and have greatly expanded access by the world’s poor to U.S. markets. But this is not the right way to think about these agreements. Instead, these agreements have been the result of corporate capture creating selective and regressive protectionism that has severely restricted the policy space of our trading partners.
Even globalization that was driven solely by changes in communications and transportation technology and political change among our trading partners would have been likely to depress wage growth for the majority of American workers. But U.S. policy failures significantly amplified these damaging effects, turning globalization from a manageable challenge into a deep economic wound for workers—and a political disaster for the country. These policy failures include failing to secure any reasonable compensation or countervailing domestic boost to bargaining power and leverage in labor markets for those on the losing end of globalization; failing to address currency misalignments that have led to large trade deficits and hemorrhaging employment in manufacturing; and passing trade agreements that have consistently aimed to undercut workers’ economic leverage while carving out ample protections for corporate profits. This unbalanced feature of trade agreements has encouraged U.S.-based employers to substitute imports for the production formerly made by U.S. workers, and thus their jobs.
Weakened labor standards
Recent decades have seen the steady weakening of a number of key labor standards that once provided leverage and bargaining power for workers to improve job quality. The rapid erosion of the federal minimum wage’s purchasing power is the most dramatic and most consequential; others are the erosion of overtime protection for salaried workers, weaker labor-standards enforcement and rising wage theft, the increased share of the workforce with no effective labor protections because of its immigration status, and more extensive misclassification of workers as independent contractors.
Erosion of the federal minimum wage
The failure to update the value of the minimum wage in line with wage or productivity growth is a premier illustration of policy choices, made on behalf of capital owners and corporate managers, that have had a huge impact on wage growth for low-wage workers and is the primary explanation for any growth in the wage gap between low- and middle-wage workers over the last four decades. Specifically, the failure to raise the federal minimum wage to an adequate level (defined for our purposes as $15 an hour by 2025) has lowered the wages of at least the bottom 22.2% of earners and a full 31.0% of earners if one includes those benefitting from state and local minimum wage increases since 2017.22
In 2019, the federal minimum wage of $7.25 was worth 16.3% less, after adjusting for inflation, than when it was last raised in 2009—the longest period of history without a minimum wage increase—and 25% below its peak inflation-adjusted value in 1968. In contrast, productivity doubled (up 103.3%) and the average wage grew by 65% from 1968 to 2019.23 Thus, the value of the minimum wage fell while the labor market became far more capable of paying higher wages overall. This lag in the minimum wage occurred despite low-wage workers being older (and therefore likelier to have greater work experience) and significantly more educated than their counterparts in 1968 (Mishel 2014).
Another way of illustrating how low the minimum wage has fallen is by examining the impact of raising the federal minimum wage to $15 in 2025, which represents a 79.0% real increase24 over its current value and a 25.6% increase in purchasing power from the 1968 peak. This is a substantial, bold increase from the current policy, yet still falls short of updating the minimum wage to correspond to the growth of average wages or productivity (projected in 2025 to be 119% greater than in 1968), and would barely make up for its shortfall relative to median wages. Yet, increasing the minimum wage to $15 in 2025 (Cooper 2019) would have a tremendous impact.
The growth of the minimum wage shapes the entire wage distribution of the bottom half, essentially setting the scale of the gap between the lowest-wage workers at the 10th percentile and the wages at the median. In 1968, the federal minimum wage was equal to roughly half (52.8%) of the wage of the typical (median) U.S. full-time worker. In 2019, that share was less than a third (31.7%). An increase of the minimum wage to $15 in 2025 would reset it to 55.1% of the typical or median worker’s wage, restoring the wage standard achieved in 1968.25 This outcome implies that the declining value of the minimum wage more than explains the increase in the 50/10 wage gap over the 1968–2019 (or 1979–2019) time frame, and the rise to $15 in 2025 would totally reverse the increase in wage inequality in the bottom half, despite the modesty of the $15 proposal.
The work by Fortin, Lemieux, and Lloyd (2021), presented earlier in Table 1 (see the “changes in wage measure” column), provides further evidence. The 50/10 wage gap among women grew by 21.2 (log) percentage points from 1979 to 2017, and three-fourths (73.6%) of that increase can be explained by the erosion of the inflation-adjusted value of the minimum wage. Among men there was essentially no increase in the 50/10 wage gap, which is not surprising since men’s wages at the bottom have been less affected by a falling or rising minimum wage.
Using (unpublished) analyses provided by Thomas Lemieux based on the Fortin, Lemieux, and Lloyd (2021) model, we can pinpoint the impact of the decline in the minimum wage on the 10th percentile wage and on the 50/10 wage gap for men and women combined (Table 2). Over the 1979–2017 period the fall in the real value of the minimum wage meant that the 10th percentile wage fell 0.022 log percentage points instead of rising by 0.133 log percentage points, a 0.155 log point impact of the failure to maintain the value of the minimum wage. The impact of the declining minimum wage threshold was comparably as large among both men and women at the 10th percentile. Breaking out the 1979–1988 period shows that it was the dramatic fall in the minimum wage in the 1980s (a 0.179 log point decline in the 10th percentile wage) that explains the impact over the longer-term 1979–2017 trend.
These results are echoed in the 50/10 wage gap. Among men and women combined the 50/10 gap grew 0.091 log percentage points from 1979 to 2017 but would have fallen by 0.047 log points had the minimum wage been maintained. The 50/10 wage gap’s increase of 0.214 log points among women would have been just 0.060 log points absent the fall in the minimum wage. Again, the results over the entire 1979–2017 period were driven by the developments in the 1979–1988 period.
The timing and pattern of changes in the wage gap in the bottom half (the 50/10 wage gap) seems to be entirely explained by changes in minimum wage policy—the choice to not maintain the real value let alone restore it to its 1968 peak. This can also be seen in Figure C above, where the growth of the 50/10 wage gap was limited to the 1979–1987 period. The 50/10 wage gap has been stable or falling since the late 1980s as the minimum wage was raised moderately26 (in 1990–1991, 1996–1997, and 2007–2009) and periods of persistent low unemployment boosted the lowest wages.
Other research confirms the major impact of the fall in the minimum wage on the expansion of the wage gap in the bottom half. For instance, the analysis of Autor, Manning, and Smith (2010) in Mishel et al. (2012, Table 4.41) shows that the fall in the minimum wage explains 65.5% of the 25 (log) percentage point increase in the 50/10 wage gap between 1979 and 2009. The wage gap at the bottom half grew very little among men (as they are far less likely to be affected by the minimum wage) over the 1979–2009 period, rising just 5.3 (log) percentage points.
That analysis, however, understates the degree to which policy changes have adversely affected the earnings in the bottom half if the standard applied is restoring the real value of the minimum wage to its 1979 value. Other reasonable counterfactuals would yield substantially higher estimated effects of a lower minimum wage. For instance, one could hold the ratio of the minimum to the median at its 1979 level or even benchmark to the 1968 peak rate. Further, using the standard of the ratio of the minimum wage to the median wage understates the impact of policy since the median itself was suppressed. That is, the minimum wage could be raised substantially more if median wage growth had not been suppressed. In this light, the fall of the median due to rising inequality of wages and the falling labor share of income—what we estimate to be a 43% decline—also adversely affected low-wage earners. If, for example, the minimum wage had kept up with economywide productivity growth after its high-water mark of 1968 (as it roughly had for the first 30 years of its existence), the federal minimum wage would be roughly $20 today.
The erosion of overtime protection among salaried workers
To be exempt from the minimum wage and overtime protections of the Fair Labor Standards Act under the “white collar” rule, a worker must be paid a salary (i.e., not be paid by the hour), must have bona fide “executive, administrative, or professional” duties (i.e., be an executive or a highly credentialed professional, or have supervisory duties), and earn above a specific salary threshold. Without a strong salary threshold, salaried workers who spend only a small share of their time actually doing exempt/”professional” work can be required to do hourly-worker-type duties (e.g., a store “manager” stocking shelves, unloading trucks, doing checkout at the cash register) for most of their worktime, including those beyond 40 hours in a week. Those hours beyond 40 are essentially unpaid.
The eroded share of the salaried workforce eligible for this overtime protection (i.e., receiving 150% of regular hourly wages when working more than 40 hours a week) is another example of a labor standard that was substantially weakened in the last four decades. The share of the salaried workforce automatically eligible for overtime based on its pay was whittled down from roughly half (49.6%) in 1975 to just 9.9% in 2014 (Kimball and Mishel 2016).
This issue gained prominence in the latter years of the Obama administration when the Department of Labor issued a rule that raised the annual salary threshold from $23,700 to $47,476 (an increase that still fell short of returning it to its 1975 level) (Department of Labor 2016). The benefit to workers of receiving overtime protection is a combination of higher hourly and annual wages and more leisure (as overtime hours are scaled back by employers when they are required to pay for them). The Department of Labor’s analysis (2016) of the 2016 rule showed that raising the salary threshold increased hourly wages by 1.1%, 2.8%, and 1.4% for salaried workers directly affected by the rule who, respectively, occasionally worked overtime, who regularly worked overtime and were newly covered by overtime protections, and who regularly worked overtime and remained exempt.27 However, because these groups comprised only about 40% of the 4.2 million workers directly affected by the higher threshold, the overall impact would be to raise hourly wages of directly affected workers less than 1.0%.
A broader group, however, is affected by the salary threshold. The Department of Labor estimated that another 8.9 million workers would have had their “overtime protection strengthened in Year 1 because their status as overtime-eligible will be clear based on the salary test alone without the need to examine their duties.” Eisenbrey and Mishel in two analyses (2015, 2016) presented evidence that much of this broader group had actually already lost overtime protections due to court cases and changes in rules introduced in the early 2000s and therefore would be directly affected by the new, higher salary threshold.
The changes in overtime eligibility affected middle-wage workers but not low-wage or higher-wage (90th percentile) workers. How much has the erosion since 1979 affected median wages? This depends on the impact on hourly wages of those affected and the share of middle-wage workers, say the middle fifth, affected by these overtime rules. The impact on the hourly wages of those affected by eroded protections would likely be about 1%.28 But not all mid-level earners have been affected by changes in overtime protections. In 2017 there were 160 million wage and salary earners, so the middle fifth comprised 32 million earners. As noted, the changes in the 2016 rule might have affected 13.5 million workers and, even if they all fell within the middle fifth, they would comprise only about 42% of middle-wage earners. In fact, the workers affected by the lowered overtime salary threshold fall between the 20th percentile and somewhat above the 60th percentile of the overall wage distribution.29 One should add in those who would have been covered if the 2016 rule had restored the 1979 salary threshold: That measure would increase the total affected by 22%.30 If one-third of middle-wage earners lost 1% of wages due to lost overtime protections, then the overall impact would be a 0.3% reduction of hourly wages for the middle fifth.
Wage theft and weaker enforcement of labor standards
Many workers, particularly low-wage workers and the women and men of color who are disproportionately in this category, frequently fail to receive the wages they are owed.31 This is referred to as “wage theft” and reflects workers being paid below the minimum wage, not being paid for all hours worked, not being paid time-and-a-half though legally eligible for overtime, experiencing illegal deductions from pay, and having their tips stolen by employers or supervisors. A recent example involved Amazon, which agreed to pay the Federal Trade Commission $61.7 million because it shorted its drivers tips over a two-and-a-half-year period starting in late 2016 (Greene 2021).
How extensive is wage theft? The available information shows the problem is pervasive. The best analysis is from a 2008 study of 4,387 workers in low-wage industries in Chicago, Los Angeles, and New York; it found that two-thirds of workers surveyed experienced at least one pay-related violation in any given week. The average violation amounted to 15% of earnings (Bernhardt, Milkman, and Theodore 2009).
Another study (Cooper and Kroeger 2017) examined the wage theft affecting minimum wage workers in the 10 most populous states (accounting for more than half the national workforce); it found that total wages stolen from workers due to minimum wage violations alone exceeds $15 billion annually on a national basis. The average minimum wage violation amounted to $64 per week or $3,300 per year for a year-round worker—nearly a quarter of the worker’s earned wages—and affected 17% of low-wage workers. The authors detail who was affected:
Young workers, women, people of color, and immigrant workers are more likely than other workers to report being paid less than the minimum wage, but this is primarily because they are also more likely than other workers to be in low-wage jobs. In general, low-wage workers experience minimum wage violations at high rates across demographic categories. In fact, the majority of workers with reported wages below the minimum wage are over 25 and are native-born U.S. citizens, nearly half are white, more than a quarter have children, and just over half work full time.
A back-of-the-envelope estimate, extrapolating from the Bernhardt, Milkman, and Theodore (2009) study, suggests that by 2016 aggregate wage theft was on the order of $52 billion annually (McNicholas, Mokhiber, and Chaikof 2017). This estimate does not include the stealing of tips where the wage received is nevertheless the minimum or violations of prevailing wage laws. This understated estimate of aggregate wage theft is, nonetheless, four times greater than the FBI’s $13 billion estimate of the total annual value of all robberies, burglaries, larceny, and motor vehicle theft.
Other insights can be gleamed by identifying the amounts recovered in wage theft suits and enforcement actions by the U.S. Department of Labor, by states, and through class action settlements. McNicholas, Mokhiber, and Chaikof (2017) did so and found $880.3 million in 2015 and $1.1 billion in 2016, for a total of $2 billion over both years. This estimate, according to the researchers, likely dramatically underrepresents the problem of wage theft, since probably only a fraction of victims actually file government complaints or are involved in class action settlements.
Shierholz (2021) details the reasons for the prevalence of wage theft:
One reason is workers’ diminished bargaining power relative to their employers. The fact that this unlawful employer behavior is not being “competed away” underscores that, for a variety of reasons, workers do not have the ability to quit these jobs as a de facto form of enforcement.
Another reason is that government resources devoted to combating violations of workplace protections are insufficient and have diminished. For instance, at the federal level, Shierholz writes: “In 1978, there were 69,000 workers per wage and hour investigator on average, but today that ratio is 175,000 to one.” The increased use of forced arbitration agreements, as detailed in a later section, has prevented workers from holding their employers accountable both in court and in the private arbitrations they are forced to use (frequently without the ability to do so as a class). As Shierholz (2021) notes:
To underscore the importance of class-action lawsuits in our enforcement framework: in 2015 and 2016, the top 10 private wage and hour class-action settlements alone exceeded the combined total wages recovered by all state and federal enforcement agencies. Forced arbitration with class and collective action waivers make it virtually impossible for low-wage workers to get any meaningful type of remedy.
Last, declining unionization enables more wage theft to go unchallenged. In effect, nearly every option workers have of holding employers accountable for stealing their wages has eroded in recent years: There is less protection through government enforcement, weaker access to legal recourse, and far less union advocacy in workplaces.
How much does wage theft affect wages in the middle and at the bottom? We do not have an estimate of aggregate wage theft across the wage spectrum or for middle-wage workers, so it is not possible to assess the impact of wage theft on the median wage. Among low-wage workers, Bernhardt, Milkman, and Theodore (2009) found that 68% experience wage theft violations averaging 14.95% of earnings. This translates into an average loss across all low-wage workers of 10.2%.32 Even this estimate omits certain types of wage theft, and we do not know how representative the study’s sample is of the national low-wage workforce. Nevertheless, the Bernhardt, Milkman, and Theodore study indicates that wage theft drains a substantial amount of low-wage workers’ earnings. We also do not know the extent of wage theft’s growth over the 1979–2017 period, though researchers judge that there has been substantial growth. A speculative estimate is that if wage theft has doubled to the 10.2% level implied by the Bernhardt, Milkman, and Theodore study, then it caused low-wage workers’ earnings to fall 5% over the 1979–2017 period due to weaker wage standards enforcement, less access to legal recourse, and eroded unionization. For mid-level wages, theft of overtime pay, unpaid worktime, and the undercutting of prevailing wages likely also had an adverse impact.
Misclassifying employees as contractors
Employers in an array of industries have increasingly (and illegally) misclassified employees as independent contractors or are paying workers “off-the-books.” This practice cheats workers of fringe benefits, social insurance protection (Social Security, unemployment insurance, workers’ compensation), labor protections (regarding safety/health and race, age, and gender discrimination), and union rights. The point of this misclassification is to lower labor costs, and it undercuts labor standards and “undermines other, more responsible employers who face costs disadvantages arising from compliance with labor standards and responsibilities” (Weil 2017).
It is difficult to quantify the extent of misclassification, since it is an illegal activity, and the extent to which it lowers wage and benefit costs. The fact that venture capitalists force this model on gig economy upstarts provides practical confirmation that the business strategy lowers labor costs and shifts risks to workers.33 Uber, a prominent example of a firm whose business strategy is built on misclassifying rideshare drivers, acknowledged in its registration for an initial public offering (Uber 2019) that misclassification provides substantial cost savings:
If, as a result of legislation or judicial decisions, we are required to classify Drivers as employees (or as workers or quasi-employees where those statuses exist), we would incur significant additional expenses for compensating Drivers, potentially including expenses associated with the application of wage and hour laws (including minimum wage, overtime, and meal and rest period requirements), employee benefits, social security contributions, taxes, and penalties.
David Weil, who has studied misclassification and has served as the administrator of the Wage and Hour Division of the Department of Labor (which oversees this issue), has noted:
Week after week, it seemed, I was witness to an investigation from our district offices involving the incorrect classification of all types of workers: janitors, home health aides, drywall workers, cable installers, cooks, port truck drivers, and loading dock workers in distribution centers. In one telling case, construction workers went home at the end of the week as employees only to be informed on the following Monday that, perhaps by the magic of some unknown force, they had become “member/owners” of hundreds of limited liability companies, effectively stripping them of federal and state job protections…. At the Department of Labor…we saw long-standing practices of employment undermined as misclassification spread quickly across sectors like restaurants, residential construction, and trucking and logistics. (Weil 2017)
Indications are that the practice has greatly increased. The last comprehensive federal estimate of independent contractor misclassification, a General Accounting Office (GAO) examination of tax year 1984, “found that 15% of employers nationwide and across industrial sectors engaged in misclassification of a total of 3.4 million workers” (Carré 2015). There is no national estimate for recent years, but Carré’s review (2015) of state audits of unemployment compensation data across 21 states completed as of 2012 showed that “the prevalence of misclassification ranges from 11% to 30% depending on the method used by state unemployment insurance agencies to select companies for audits…. here is remarkable consistency in the prevalence of misclassification found across states using similar audit methods.” Weil’s (2017) interpretation is that “anywhere from 10% to 20% of employers misclassify at least one employee.”
Industry analyses provide information, too, on the numbers of workers affected. Ormiston, Belman, and Erlich (2020) estimate that in construction “between 1.30 and 2.16 million workers were misclassified or working in cash-only arrangements in an average month of 2017.” The major rideshare companies, whose business model incorporates misclassification, have between 1 million and 2 million drivers. Other online demand firms also rely on misclassification. A newspaper investigation by Locke and Ordonez (2014) analyzing payroll records for government-backed construction housing projects across 28 states found that “companies using stimulus money routinely snubbed labor law and the Internal Revenue Service by treating workers as independent contractors in a clear violation of what’s allowed.” These companies “listed workers as contractors instead of employees in order to beat competitors and cut costs….Scofflaws can save 20% or more in labor costs by treating employees as independent contractors.”
Misclassification is common in trucking. Following deregulation, large transport companies “sold their trucks to the drivers, then contracted with them on a per-load basis” (Bensman 2009, cited in Carré 2015). Appel and Zabin (2019) summarize the history:
The trucking firm practice of contracting with drivers for their services became a standard strategy across many parts of the commercial trucking industry by the mid-1990s. Contracting allows companies in many instances to shift responsibility for equipment to truck drivers, reduce payroll expenses such as employment taxes and employee fringe benefits, and retain the same effective control over the transporting of loads. Some trucking firms transformed their business model after deregulation entirely, becoming brokers by selling their trucks to former employee drivers and leasing those drivers’ services on an exclusive basis….For twice as much measurable output today, long-haul truckers now make 40% less in wages than they did in the late 1970s, when trucking was considered highly desirable blue-collar work.
A series of articles in USA Today in 2017 focusing on port truck drivers, who haul goods from ports to warehouses, found that
a good chunk of the port trucking industry relies heavily on a modern-day form of indentured servitude. The abuse starts when a trucking company pressures its drivers to sign lease-to-own contracts on their tractor-trailer rigs. Often, these drivers speak little English and do not understand what they are getting into. Once under contract and in debt, these short-haul drivers are at the mercy of the companies they’ve signed on with. The truckers can work days on end without making enough to cover expenses the companies charge them. If they complain, they are fired or given less profitable routes.
Precise estimates of the impact of rising misclassification are not possible with available data, but one can speculate about a range of possible impacts. To gauge the impact we assume that the 3.4 million misclassified workers found by GAO in 1984 (4.4% of nonagricultural wage and salary employment) have risen to 9.0 million (a 7.4% share), and that misclassification lowers wages by either 15% or 30%. Further, we will assume that misclassification is either spread throughout the private nonagricultural wage and salary workforce or, more likely, targeted at the bottom two-thirds; in the former case the share of misclassified workers in total employment rises by 3.0 percentage points, while in the latter case it rises by 4.5 percentage points. The impact is likely to have been on both low-wage and middle-wage workers. These parameters provide a range of impacts: Misclassification lowered wages by between 0.5% and 0.9% if applied across the whole workforce and between 0.7% and 1.4% if affecting and applied to only the bottom two-thirds.34 If one included all workers, including those in the public sector, then the estimated impacts would be proportionally less. We take a 1% decline in the median wage as our ballpark estimate.
Immigration policy that creates ‘labor standard free zones’
Employers have increasingly hijacked immigration policy to create zones in the labor market where workers’ ability to obtain enforceable basic labor standards is compromised by their immigration status. Note that the issue is not just the presence, or supply, of immigrants, but the legal situation that makes undocumented workers exploitable. In our economy, if you can be exploited, you will be. This exploitation of a sizable share of the workforce lowers the wages of migrants as well as those of the workers in their occupations and industries.
Costa (2019) has examined this issue and argues:
n certain local labor markets and industries where a significant share of workers are migrants who do not have access to worker protections and basic labor rights—either because they are unauthorized immigrant workers or because they are migrants employed through nonimmigrant, temporary work visa programs (i.e., “guestworkers”)—the migrant workers’ lack of rights makes it difficult for them to bargain effectively for decent wages, and their weak leverage spills over to undercut the leverage of U.S. workers—i.e., citizens and immigrants who are lawful permanent residents.
Unauthorized immigrants comprise nearly 5% of the U.S. labor force, and these nearly 8 million workers (Krogstad, Passel, and Cohn 2019) are not fully protected by U.S. labor laws because of their precarious immigration status.35
As of 2013 approximately 1.4 million guestworkers were employed through temporary work visa programs, and they accounted for roughly 1% of the labor force (Costa and Rosenbaum 2017); the Organisation for Economic Co-operation and Development recently estimated that 1.6 million full-time equivalent jobs in the U.S. were filled by guestworkers in 2017 (OECD 2019a).36 Although they are legally authorized to work, guestworkers are among the most exploited laborers in the U.S. workforce because the employment relationship created by the visa programs leaves workers powerless to defend and uphold their rights.
Combining the estimates of unauthorized immigrants and guestworkers means that 6% of the workforce is vulnerable to exploitation due to its legal status. The presence of these exploitable migrants is greatest in various service industries—hospitality, restaurants—as well as in construction and agriculture. But there is also evidence that skilled, college-educated guestworkers are underpaid and have been subjected to financial bondage and even human trafficking (Costa and Hira 2020; Smith, Gollan, and Sambamurthy 2014; Stockman 2013). Costa and Rosenbaum (2017) estimate that there were roughly 800,000 skilled guestworkers employed in the United States in 2013.
Wage theft is a common form of exploitation of migrants, and estimates are that it occurs to an extreme degree. As Costa (2019) notes:
The exploitation described here is not theoretical. A landmark study and survey of 4,300 workers in three major cities (Bernhardt et al. 2009) found that 37.1% of unauthorized immigrant workers were victims of minimum wage violations, as compared with 15.6% of U.S.-born citizens. Further, an astounding 84.9% of unauthorized immigrants were not paid the overtime wages they worked for and were legally entitled to.
Research by Apgar (2015) comparing the wages of comparable migrant Mexican workers who were undocumented, had legal permanent resident status, or were temporary guestworkers in the H-2A and H-2B visa programs,37 found that unauthorized workers earned about 13% less than legal permanent residents; temporary foreign workers (i.e., guestworkers) earned about 11% less than legal permanent residents, and their wages did not significantly differ from unauthorized workers’ wages.
Apgar concluded: “Wage gaps suggest that employers use fear of deportation to pay lower wages—not just to unauthorized immigrant workers but to temporary foreign workers as well.”
The presence of exploitable migrant workers therefore undercuts labor standards in immigrant-intensive occupations and industries and thereby depresses wages and benefits of nonmigrants. This exploitation is likely to affect wages in the bottom two deciles more than those at the mid-level, although there are probably some impacts in the middle and further up the scale, where technology-sector guestworkers depress labor standards.
While there is not a deep economic literature that quantifies this type of spillover effect, much qualitative and historical research highlights that it is exactly the intent of many employers in expanding the pool of workers in the U.S. who lack basic worker rights because of their immigration status. Nevertheless, the conscious policy decisions to allow these circumstances clearly contribute to wage suppression.
Failures to police or check new forms of employment ‘contracts’
Employers are increasingly requiring employees to relinquish various rights when they accept employment or even after they are already employed. Noncompete and forced arbitration agreements are chief among these restrictions, and employers within various franchise chains also collude against employees through anti-poaching agreements. All of these agreements limit workers’ options by limiting access to courts and the ability to readily find another job or even to know the basic terms of their employment arrangement. This works to suppress wages.
Noncompete agreements
Employers have increasingly required employees to sign noncompete agreements, which limit options for future employment and are now widespread. The practice suppresses worker mobility and suppresses wages, and it depresses firm entry and dynamism because employees are prohibited from starting their own firms.
This section draws heavily on the Federal Trade Commission testimony of Evan Starr (2020) and Starr’s recent review (2019b) of the evidence on noncompete agreements. John Lettieri’s recent American Enterprise Institute study provides an additional useful analysis.
An example of a noncompete agreement is the one Amazon requires its employees to sign (Woodman 2015):
During employment and for 18 months after the Separation Date, Employee will not, directly or indirectly, whether on Employee’s own behalf or on behalf of any other entity (for example, as an employee, agent, partner, or consultant), engage in or support the development, manufacture, marketing, or sale of any product or service that competes or is intended to compete with any product or service sold, offered, or otherwise provided by Amazon (or intended to be sold, offered, or otherwise provided by Amazon in the future) that Employee worked on or supported, or about which Employee obtained or received Confidential Information.
This is a remarkable agreement for the breadth of its scope (Amazon sells a wide array of goods) and for the fact that it applies to low-wage warehouse workers, even seasonal ones, and that Amazon is one of America’s largest private-sector employers.
How widespread are noncompete agreements? According to a national survey of private-sector American business establishments with 50 or more employees in 2017 (Colvin and Shierholz 2019), “roughly half, 49.4%, of responding establishments indicated that at least some employees in their establishment were required to enter into a noncompete agreement. Nearly a third, 31.8%, of responding establishments indicated that all employees in their establishment were required to enter into a noncompete agreement, regardless of pay or job duties.” The researchers estimate that “somewhere between 27.8% and 46.5% of private-sector workers are subject to noncompetes.”
These data indicate that noncompetes have grown in their use since a survey (Starr, Prescott, and Bishara 2020) of employees in 2014 showed just 18% of the U.S. workforce covered by them, though 38% were subject to one at some point in their careers. The precise extent of the increased incidence of noncompetes is uncertain, however: The Colvin and Shierholz employer-based survey probably captures more noncompete use than the earlier employee-based survey, since many employees are unaware of having signed a noncompete agreement.
Noncompetes are intensively used in establishments with high pay or high levels of education, but they are also common in those with low pay and low education credentials. The 2014 employee survey found that 53% of those covered by noncompetes were paid by the hour and had median earnings around $14 an hour; 33% of the surveyed workers earning under $40,000 reported signing a noncompete agreement during their careers.
Job-to-job mobility is critical for earnings growth—employers don’t have to pay as much if they know workers don’t have good outside options—and so noncompetes, especially enforceable ones (not every state allows their enforcement) can be expected to lower wages. Some workers will be pushed to industries in which they are paid less. There is evidence that employers require employees to sign noncompete agreements even in states where they are not enforceable and that even in those states the agreements hamper wage growth and mobility.38
The contrary view is that noncompetes must be advantageous to employees or they would not have signed them. This “freedom of contract” paradigm presumes employees and employers have equal power and options in a competitive labor market. Lettieri (2020) rejects the freedom of contract interpretation:
The vast majority of noncompete agreements are not subject to any negotiation between the employer and employee, suggesting that the employee is unlikely to receive any benefits in return for their signature. A large share of these agreements are presented for signature only after the employee has already accepted the job offer—often on the first day of work. Employers frequently exploit workers’ lack of knowledge and resources when crafting noncompetes. For example, employers commonly request that workers sign noncompetes even in states where they are completely unenforceable—and workers nevertheless sign the agreements assuming they are valid. Likewise, employers often craft extremely broad provisions knowing that employees generally lack both an understanding of what is enforceable and the wherewithal to challenge the terms in court.
In fact, Starr (2019b) reports that “less than 10% of workers reported negotiating over non-competes”; 83% of affected workers simply read and signed the contract. “When you ask workers, what did you—what were you promised in exchange for signing a non-compete, 86% of them say nothing, and roughly a third of non-competes were delayed until after the worker accepted the job without any change in responsibilities or a promotion.”
Starr (2019b), assessing studies examining the relationship between noncompete enforceability and wages, found:
orkers in states that enforce non-competes earn less than equivalent workers in states that do not enforce non-competes. One recent study finds that the Hawaii ban on noncompetes for technology workers increased new-hire wages by 4%. The same study also documents that technology workers who start jobs in an average enforceability state have 5% lower wages even eight years later relative to equivalent workers in non-enforcing states. Another two studies looking at broader segments of the labor market document that the negative wage effects of non-compete enforceability are generally borne by those with less education.
Simply put, noncompetes lower wages and mobility for both technical and low-wage workers, whether they reside in states where the contracts are enforceable or in those, such as California, where they are not. Moreover, “where non-competes are really common and highly enforced, the whole labor market suffers” (Starr 2019b), as wages, job mobility, and job satisfaction decline even among those not directly affected.
In his testimony to the Federal Trade Commission, Starr (2020) noted that noncompetes are frequently accompanied by other restrictive agreements, such as nondisclosure, nonsolicitation of clients, nonsolicitation of co-workers, intellectual property assignment (giving the firm ownership of any intellectual property created on the job), and forced arbitration. That noncompetes are included in this cluster of agreements provides further evidence that their purpose is to restrict employee options rather than to protect beneficial investments in and information held by employees. Colvin and Shierholz (2019) also find a strong correlation between the presence of noncompete and forced arbitration agreements.
What is the impact of increased use of noncompete agreements on median wages, low wages, and various wage gaps? The best evidence regarding noncompetes and wage levels is the Lipsitz and Starr (2020) examination of the relationship between Oregon’s 2008 ban on noncompetes for low-wage workers and the average hourly wages of hourly paid workers. The finding that the ban raised wages for hourly workers by 2.2% to 3.1% reflects the impact on those directly affected (about 14% of hourly workers are subject to noncompetes) and the spillover effects on other comparable workers. It is important to note that these results are for hourly, not all, workers, and hourly workers comprised 67% of Oregon earners. Two indications in the Lipsitz and Starr research provide clues to the impact on the median worker. One is that the ban’s impact was comparable across the 20th to 80th wage percentiles of hourly workers, suggesting that the impact on the median would be comparable to the 2–3% average effect (if hourly workers comprise the bottom 67% of earners, then the overall median is the 75th percentile of hourly workers). On the other hand, Lipsitz and Starr report that the impact of the noncompete ban was higher for two occupation groups with wage levels close to the overall median: In construction occupations and installation, maintenance, and repair occupations wages rose by 4.9% and 4.3%, respectively.39 The ban’s impact on wages in construction occupations occurred even though the incidence of noncompetes in construction was below average.40 The ban had basically no effect on a low-wage occupation, food service preparation. These differences across occupations reflect both the incidence and direct impact of noncompetes. In sum, these results suggest that the impact of noncompetes on the median is in the 4.3% to 4.9% range, there is little if any impact for the lowest-paid workers, and noncompetes actually narrow the wage gap (50/10) in the bottom half by depressing the median wage but not affecting the lowest-wage workers.
Another study, Johnson, Lavetti, and Lipsitz (2020), analyzed how the legal enforceability of noncompetes affects wages and labor market mobility. Using a newly constructed state–year panel of noncompete enforceability spanning 1991 to 2014, the authors found that enforceability of noncompetes leads to a decline in workers’ earnings and mobility and increases racial and gender wage gaps (“the earnings effect among women and black workers is twice as large as the effect among white men”). They estimate that average earnings would increase by 8.5% nationally if noncompetes were made unenforceable. We do not draw on these results for our assessment of noncompetes on the median wage, but the 4.3% to 4.9% range we do rely on is far below that of these results. Johnson, Lavetti, and Lipsitz also show that noncompetes lower the wages of college-educated workers more than non-college-educated workers, suggesting that noncompetes narrow the 90/50 wage gap, especially since there is a greater incidence of noncompetes among college-educated workers (25% compared to the average incidence of 18%, according to Starr, Prescott, and Bishara 2020, Figure 3). Elimination of noncompetes would also drain the business profits that accrue to upper-income households, so the overall impact of eliminating them or scaling back their use and enforceability on overall income inequality is uncertain.
Assessing the impact of the increased use of noncompetes on median wage growth since 1979 requires quantifying that increased use. Unfortunately, there is no historical series on noncompete incidence. The agreements have been used for many years, especially among higher-wage professionals and executives, and use has increased as evidenced by the increased public and policymaker attention to the agreements, particularly for middle-wage or lower-wage (e.g., Jimmy John’s sandwich shop workers) workers. If, say, the incidence among hourly workers has doubled since 1979 and the wage impact is roughly 4.5% in recent years, then noncompetes have lowered the median wage by about 2.25%. The impact might be lower if we base the assessment on the 2.2% to 3.1% overall wage effect identified by Lipsitz and Starr (2020) or if the rise in incidence is less than double. It seems equally plausible to us, however, that “doubling” is an underestimate, since we know the incidence of forced arbitration agreements has enormously increased since the early 1990s (from 2% in 1992 to more than 50% in 2017), and firms insisting on forced arbitration also tend to insist on noncompetition agreements. So, we take the 2.25% impact on median wage growth as a rough estimate.
Forced arbitration and class action waivers
Employers increasingly requiring their workers to sign arbitration agreements is another clear example of policy decisions, this time from court decisions starting in 1991, limiting workers’ options to resist workplace exploitation and contributing to wage suppression and inequalities. As noted above, forced arbitration is among a suite of agreements being forced on workers as a condition of employment (Colvin and Shierholz 2019). This trend accompanies the weaker enforcement of labor standards and workplace civil rights by public authorities, as discussed in the wage theft section. Forced arbitration suppresses claims, makes them less likely to succeed, and reduces awards. The consequence is the undermining of the enforcement of employment rights ranging from minimum wage and overtime pay to rights to equal pay and freedom from discrimination or harassment based on race, gender, or religion (see Stone and Colvin 2015, Colvin 2018, and Deutsch et al. 2019).
The incidence of forced arbitration agreements took off after key Supreme Court decisions in 1991 and 2001 made clear “that an American employer may, with near total impunity, require an employee, as a condition of hiring and continued employment, to use private arbitration as the means of resolving public claims against the employer that involve a statutorily protected right” (Lipsky 2007). In 1992, just over 2% of the workforce was covered by forced arbitration agreements, but that share rose to almost a quarter by the early 2000s. By 2017 the share was 56.2% (Colvin 2018).
Of the employers who mandate arbitration, some 30.1% also mandate class action waivers, meaning that besides losing the right to file a lawsuit on their own behalf employees also cannot pursue even their private arbitrations through collective legal action. Colvin (2018) found that “23.1 percent of private-sector nonunion employees, or 24.7 million American workers, no longer have the right to bring a class action claim if their employment rights have been violated.” Individual lawsuits are often unrealistic for low-wage and even middle-income workers because the cost of legal representation may exceed their lost wages. In contrast, class and collective actions allow workers to aggregate claims, making litigation cost-effective (Deutsch et al. 2019). The Supreme Court’s 2018 Epic Systems v. Lewis decision held that employers can require employees to give up their right to sue either as an individual or on a collective basis, a development expected to lead to a further surge in the incidence of mandatory individual and class forced arbitration agreements.
Mandatory arbitration agreements are required across the wage spectrum but have the highest incidence among low-wage workers: Workplaces paying less than $13 per hour mandated arbitration 64.5% of the time, while those with higher wages did so 48–54% of the time (Colvin 2018, Table 4). The largest employers mandate arbitration most often: Those with at least 5,000 employees mandate it 67.7% of the time, while employers with fewer than 500 employees do so 49% of the time (Colvin 2018, Table 1).
There’s a catch-22 to the mandatory arbitration scheme, as illustrated by this example (Deutsch et al. 2019):
Low-wage employers like Chipotle have demonstrated that they never intended arbitration to be a viable alternative to class-action litigation. After being sued for systemic wage theft, Chipotle forced workers to sign arbitration clauses to prevent them from joining the suit. Then when individual workers filed for arbitration, Chipotle blocked the arbitrations from proceeding by refusing to pay its share of the fees.
It is not possible to assess the wage impact of the spread of forced arbitration agreements. The practice is intended to and does undermine the enforcement of employment and civil rights workplace protections, further limiting employee options to resist employer exploitation.
Has any harm done by forced arbitration agreements been offset by the gains made by workers in agreeing to such terms? The majority opinion in Epic Systems asked, “Should employees and employers be allowed to agree that any disputes between them will be resolved through one-on-one arbitration?” and assumed that when employers and employees have a “freedom” to contract they will both obtain optimal outcomes. Justice Ginsburg in her dissent noted the incongruity of such a claim given that these forced arbitrations were imposed on already-employed workers given “a Hobson’s choice: accept arbitration on their employer’s terms or give up their jobs.” Justice Ginsburg asked:
Were the “agreements” genuinely bilateral? Petitioner Epic Systems Corporation e-mailed its employees an arbitration agreement requiring resolution of wage and hours claims by individual arbitration. The agreement provided that if the employees “continue to work at Epic,” they would “be deemed to have accepted th Agreement.” Ernst & Young similarly e-mailed its employees an arbitration agreement, which stated that the employees’ continued employment would indicate their assent to the agreement’s terms.
Employer collusion and anti-poaching agreements
Do employers collude to suppress pay and restrict competition in the labor market? Adam Smith is often cited as recognizing extensive collusion, writing that employers “are always and everywhere in a sort of tacit, but constant and uniform combination, not to raise the wages of labour above their actual rate.” This behavior cannot be readily studied since, as Smith also said, “We seldom, indeed, hear of this combination, because it is the usual, and one may say, the natural state of things, which nobody ever hears of” (quoted in Krueger and Ashenfelter 2018). A remarkable case of collusion did come to light in recent years when a class action civil suit on behalf of more than 64,000 software engineers and other employees of Apple, Google, Adobe, Intel, Intuit, Pixar, and Lucasfilm was settled in 2015 for half a billion dollars.
We do not know the extent of collusion among employers and how it has changed over time. It is, after all, illegal. There is research on explicit collusion in franchising, however, because this is a gray area in the law.41 Krueger and Ashenfelter (2018) report on anti-poaching agreements in franchises, agreements that limit a particular franchise of McDonald’s, for instance, from hiring a worker from another McDonald’s franchise. To be clear, this type of agreement differs from a noncompete, where employers limit a worker’s options. An anti-poaching agreement is a direct collusion among employers not to recruit workers from each other.
In discussing their findings, Krueger (2018) noted:
58 percent of franchise companies have a no-poaching clause that prevents or restricts the ability of one franchisee in a chain from hiring workers employed by other franchisees. This is up from 36 percent in 1996. The practice is particularly common in fast food chains. We find that 80 percent of the 40 largest Quick Service Restaurant franchise chains have a no-poaching requirement. Since the human capital would remain within the chain, there is little business justification for such a clause other than to restrict worker mobility and opportunities.
No-poaching agreements are more common in low-wage and high-turnover industries (Krueger and Ashenfelter 2018).
Krueger and Ashenfelter (2018) provide a quantitative example to illustrate the impact of no-poaching agreements to facilitate employer market power over workers within franchise chains. In Rhode Island, for instance, instead of 261 employers competing for Quick Service Restaurant workers, anti-poaching agreements effectively limit the competition to just six.
Of course, employers do not have to pay as much when workers have fewer options. Unfortunately, there is no systematic evidence of no-poaching agreements’ impact on workers’ pay and within-franchise job mobility. We do know that these agreements grew substantially over the 1996–2016 period, however, and disproportionately affect workers in low-wage industries and “potentially affect a large number of workers” (Krueger and Ashenfelter 2018).
Tolerating new business structures that disempower workers
In recent decades, employers have increasingly tried to build up concentrated power in product markets (as well as labor markets directly) and to leverage this increased product market power to augment their profitability and the pay of executives by lowering costs and suppressing wages. One mechanism has been to match market concentration with efforts to outsource key parts of their production or workforce to keep those costs from making a claim on the firm’s income. In past years, policymakers might have used industry regulation such as in airlines and trucking and antitrust enforcement to keep these changes in check. But in recent decades, the pushback against these changes in business structure has been rare and muted.
Fissuring: contracting out/outsourcing, temping, and franchising
Perhaps the most pronounced way that employers have attempted to shape labor market outcomes to their advantage through changes in business structure is the “fissuring” of workplaces. David Weil’s book, The Fissured Workplace (2014), as well as analyses by Appelbaum and Batt (2014), provide the details about what fissuring is and how it works to the advantage of employers.
In fissuring, Weil explains, companies seek to focus on the tasks that provide the greatest return while shedding those that are harder to reap extra-normal returns from. The “lead business” maintains tight control of the outcomes of the tasks it sheds by careful monitoring of the spun-off or contracted supplier firms. A classic example is universities: Many once hired employees directly to run student services like cafeterias, but they now hire outside firms instead. In retailing, detailed mechanisms of monitoring and control exist between the lead firm and contracted firms, including franchising agreements, supply chain monitoring mechanisms, and increasingly sophisticated software algorithms. Essentially, lead firms insist on a high degree of control over much of the contracted firms’ output, but abdicate any responsibility for the contracted firms’ employment conditions.
Weil points out that fissuring should be distinguished from contingent work or alternative work arrangements. “Fissured workplace arrangements can exist even though employment itself might be traditional (that is, ongoing and full time) when the worker is employed by a subcontractor, franchisee, or other business organization undertaking the work of a lead business.” In fact, as discussed below, traditional employment arrangements dominate the fissured workplace, and the increase in fissuring, as best as we can surmise, has primarily occurred through subcontracting to firms still using traditional employment arrangements. In short, most of the “fissured economy” does not reflect independent contractors, the gig economy, or other forms of contingent work.
Fissuring is a corporate strategy that emerged from the focus on shareholder value. It raises profits in part by squeezing the costs of subcontractors, who in turn cut wages, and shifting risks onto other firms and workers. Further, fissuring allows workers who may have once benefited from firm-specific economic rents to be cast out of the firm and forced to do the same work at a contracted firm that does not have access to these rents. In a real sense, part of the rationale for fissuring is to hire contracting firms to do the dirty work of cutting pay for workers who were once in the lead firm but who happened to not be performing tasks where rents could be extracted. Fissuring also redistributes profits from contractors to the lead firms. It does not reflect a new way of producing goods and services but rather a rearranging of the business hierarchy in which particular workplaces fit (Appelbaum and Batt 2014). As such, fissuring probably has no impact on aggregate productivity, or on making the production of goods and services more efficient. Instead, its effects are overwhelmingly distributional. Fissuring also does not reflect technological change in how goods and services are produced. Technology does, though, play a role in that communications and other connectivity better enable firms to monitor dispersed economic activity and the fulfillment of standards.42
Appelbaum and Batt (2014) argue that political and institutional factors have also enabled fissuring:
inancial market deregulation gave investors and stockholders more power to pressure firms to maximize shareholder value, and the lax enforcement of labor laws and the decline of union power freed them from prior constraints to do so.
So, fissuring and domestic outsourcing should be interpreted is a business strategy choice and not a beneficial “market force” that satisfies consumer preferences or adapts to newfound abilities to improve efficiency.
Weil’s (2019) estimates show the fissured economy to be substantial:
lose to 19 percent of the private-sector workforce were in industries where fissured arrangements predominate…prevalence could easily double, the presence of fissuring in one workplace spills over to the wage-setting decisions of other businesses and to the labor markets in which they compete for workers.
But estimating the size of the fissured economy is a major challenge researchers are only now undertaking. However, it seems clear that somewhere between a fifth and a third of the economy is characterized by fissuring as a dominant force. Moreover, where fissuring is present it can be extensive, as witnessed by the fact that “about half of Google’s workers are contractors who don’t receive the same benefits as direct employees” (Bergen and Eidelson 2018).
For fissuring to contribute to wage suppression in recent decades it would have to have grown in size and/or provided a more intense push downward on wages and job quality in this time. In terms of growth there is much we don’t know and some things we do. Bernhardt et al. (2016, 40) concluded that “available information points to rapid growth in domestic outsourcing in a wide range of industries since the 1980s.” Fissuring’s growth seems to have primarily occurred in its least-well-measured component, business-to-business subcontracting (frequently relying on traditional employment arrangements), and not through any substantial growth in other components that are better measured, such as use of independent contractors,43 staffing agencies,44 or franchising.45
In any case, there are likely to be downward wage pressures from fissuring. As Weil (2019) notes: “The fissured workplace has been accompanied by the erosion of wage and other workplace norms in many industries and occupations” (p. 160). This is because “y shedding their employees in a variety of ways and making those workers the employees of other organizations, a wage-setting problem becomes a pricing problem. The janitor, maintenance person—or even lawyer—who no longer is a member of the company also no longer need be bounded by the pay considerations of that company’s wage structure” (p. 154).
Various studies confirm that workers in contractor firms earn less, including security guards and janitors (Berlinski 2008; Dube and Kaplan 2010); call center workers (Batt, Doellgast, and Kwon 2006; Batt, Holman, and Holtgrewe 2009; Batt and Nohara 2009); airline workers (Callaci 2019); and logistics (i.e., truck drivers, warehouse workers), cleaning, security, and food services workers (Goldschmidt and Schmieder 2017). Reviews of this literature all indicate the adverse impact of outsourcing on wages (Weil 2019; Appelbaum 2017; Bernhardt et al. 2016; and Rosenfeld 2021).
Moreover, outsourcing not only lowers wages; it also leads to greater wage theft and more dangerous working conditions (Weil 2014, 2019).
Fissuring, and particularly the outsourcing of particular tasks, is probably responsible for the fact that workers in the largest firms no longer receive higher pay than those in medium-sized firms. Where large firms once likely had a core competency that generated economic rents for workers but also directly employed many in occupations outside this core competency, fissuring has allowed lead firms to outsource these noncore occupations and restrict employment to only those jobs performing the tasks that generate or share rents. At the same time, large subcontracted firms dominated by the cast-offs of lead firms now provide relatively low-wage work concentrated in occupations where rents are harder to generate and protect.
As Bloom et al. (2018) show, those in firms with more than 2,500 employees were not paid more in the 2007–2013 period than those in firms that had 1,000 to 2,500 employees, a sharp drop from what prevailed in the 1980s. For instance, a firm with 10,000–15,000 employees paid 15 (log) percentage point more than a firm with 1,000–2,500 employees in the 1980s, but that differential was absent in the 2007–2013 period. The impact is felt beyond wages, since large firms also provide better-quality jobs overall, including higher benefits and better working conditions (Maestas et al. 2017). This erosion of the quality of jobs in large firms affected a large swath of the workforce, as employment in firms exceeding 2,500 employees comprised 39.0% of all jobs in 2014 compared to 37.0% in 1999 and 35.3% in 1979.46
Weil (2019) drives home the point in showing the wage disparities in delivery services: a traditional union employee at UPS earns $23.10 an hour, an “independent contractor” for FedEx earns $14.40, and an Amazon contracted worker (driving the “last mile” of a delivery scheme) earns $5.30, less than the minimum wage.47 In all three case the basic tasks are the same but the corporate structure differs.
A speculative gauge of the impact of fissuring might find that a shift of 15 percentage points of employment into fissured workplaces earning 15.0% less (Goldschmidt and Schmieder 2017) would yield an overall decline of wages of 2.25% overall but even more among non-college-educated and more vulnerable segments of the workforce.
Product and labor market concentration
There has been increasing interest in two key changes in corporate structure in recent decades: product and labor market concentration (sometimes referred to as monopoly and monopsony). We will not use the label “monopsony” here for labor market concentration, as modern labor economics has adopted the term “monopsony” to describe a wide range of influences—including but not limited to market concentration—that give employers power to set wages. It seems clear that there are many reasons for policymakers to be concerned about market concentration, and robust efforts (antitrust or regulation) to confront the malign effect of concentration should be part of the policy toolkit going forward.
Labor market concentration. Though labor market concentration is definitely associated with lower wages, evidence remains lacking that it has increased so as to greatly contribute to wage suppression. Key papers assessing the effect of labor market concentration include Azar, Marinescu, and Steinbaum (2017); Benmelech, Bergman, and Kim (2018); Rinz (2018); and Naidu, Posner, and Weyl (2018). Bivens, Mishel, and Schmitt (2018) surveyed the evidence presented in these papers and found it to show persuasively that labor market concentration is negatively correlated with average wages. The evidence also shows that the average labor market is highly concentrated but the average worker is not employed in a concentrated labor market. This is because concentration is prevalent in rural areas and other labor markets with lower population density, but most people work in labor markets with low to moderate degrees of concentration. The disproportionate labor market concentration faced by rural workers is a key source of the economic stress felt by such workers.
Evidence on trends in aggregate labor market concentration is harder to obtain. Labor market concentration within manufacturing shows a modest increase between 1979 and 2009. This time-series analysis also shows that the adverse wage effects of concentration within the manufacturing sector are greatly attenuated by unionization. If overall labor market concentration rose as fast as concentration within manufacturing over the 1979–2014 period, then rising concentration would have lowered average wages by roughly 1% over the period.
Rinz (2018) found that local labor markets (which he defines as industry by geography) have become substantially less concentrated over time, while national labor markets have become more concentrated. He explains this finding by noting that large players in local labor markets may have become bigger national players over time. For example, if 30 years ago regional fast-food chains dominated local labor markets but now just one or two national chains dominate all local labor markets, local labor market concentration would be unchanged (there was always only a small number of players in any local labor market) but national concentration would be greater. The effect of this pattern of concentration on earnings and wage inequality depends on what is more important—local or national labor markets.
Product market concentration—monopoly power in product markets. The growth of product market monopoly power over prices does not seem to have contributed to wage suppression, though firms may have leveraged their monopoly positions to suppress wages and profits in supplier chains. Key papers directly assessing the effect of product market concentration include Autor et al. (2017b); Barkai (2020); De Loecker, Eeckhout, and Unger (2020); Grullon, Larkin, and Michaely (2015); and an analysis by Goldman Sachs (Struyven 2018). Bivens, Mishel, and Schmitt (2018) surveyed some of the evidence presented in these papers and found that they demonstrated that product market concentration rose steadily across six sectors from 1982 to 2012 (manufacturing, retail, wholesale, services, finance, and utilities and transportation). The magnitude of this rise has varied substantially across sectors. Data after 2012 are not yet available from the Census Bureau. Other sources of data on industry concentration (for example, from Compustat, a private database of publicly owned firms) are often viewed with some suspicion by scholars of industrial organization.
The main channel through which increased product market concentration would affect wages in most textbook conceptions is through a shift in income from wages to profits. The increased concentration gives firms pricing power, and the higher prices increase profit margins while reducing the purchasing power of wages. Between 1997 and 2012, during the time when concentration in a number of industries increased, the overall share of corporate-sector income claimed by labor shrank significantly. However, labor markets were very different in 1997 as compared to 2012; the unemployment rate was 4.9% in 1997 and 8.4% in 2012. As labor markets tightened after 2012, labor’s share rose in the corporate sector.
To more rigorously test the hypothesis that there has been a secular decline in product market competition that has transferred income from wages to profits through higher prices, one would want to see the labor share in equivalently tight labor markets over time. Bivens (2018) notes that economists have often been too quick to declare declines in the labor share “structural” and hence not amenable to reversal by more expansionary macroeconomic policy. That is, the fall in labor’s share could be the result of firm monopoly power but could also be due to eroded worker power due to excessive unemployment. Many of the studies of monopoly’s impact on labor’s share cannot distinguish between these two competing, or complementary, explanations.48
The rise in labor’s share as unemployment fell in the recent recovery suggests a strong role for eroded worker power, since monopoly power is not expected to diminish with lower unemployment. For instance, labor’s share (in the corporate sector) rose from 75.6% in 2016, when unemployment was 4.9%, to 77.3% in 2019, when unemployment averaged 3.7%.49 Stansbury and Summers (2020) note in support of the eroded worker power explanation that “Greenwald, Lettau, and Ludvigson (2019) find that a reallocation of income from labor to shareholders can account for a large share of the rise in equity valuations from 1989 to the present.”
Barkai (2020) finds that increases in product market concentration in recent decades have reduced both labor and capital shares across detailed industries, with a concomitant rise in the “pure profit” share, which he interprets as evidence of declining competition and greater monopoly power. His framework of parsing out profit and capital shares separately is extremely useful. However, the capital share requires estimating a return to physical capital, and because this return and the pure profit return are bundled together in any observable data series, it is a real empirical challenge to do and no professional consensus exists on the scale of his estimates.
Autor et al. (2017b) estimate that the increase in product market concentration between 1997 and 2012 could account for a third of the decline in the labor share over that period. Bivens, Mishel, and Schmitt (2018) calculate that this translates into a reduction in overall wages of roughly 2.9% over that time. It is also possible that what Autor et al. are measuring reflects fissuring rather than product market concentration.
While the rise of profit shares is consistent with evidence of rising monopoly power in product markets, Stansbury and Summers (2020) note that this is also consistent with reduced labor market power of workers. They further note that textbook models of increased monopoly power in product markets should also see faster inflation, reduced output, and an increase in the unemployment rate consistent with stable inflation, i.e., the nonaccelerating inflation rate of unemployment, or NAIRU. Decreased worker power, conversely, should see slower inflation and a reduced NAIRU—and these seem more consistent with real-world macroeconomic evidence over recent decades. In short, rising monopoly power in product markets that has harmed U.S. households through excessive price growth seems unlikely to be a major channel through which concentration may be dragging on wage growth.
Product market concentration—dominant buyers squeezing suppliers. In traditional conceptions of the harms done by product market concentration, firms’ monopoly power is leveraged against consumers of their output, with prices being pushed above what would prevail in competitive markets. However, many real-world firms with substantial market share (Walmart and Amazon, for example) charge their own customers seemingly low prices while leveraging their market power instead against the firm’s own suppliers, coercing them into providing supplies at low prices. This in turn squeezes both profits and wages for the supplier firms.
Path-breaking research by Wilmers (2018) has identified and quantified the impact of these “dominant buyers.” He documents that dominant buyers have been able to squeeze profits and lower wages in their supplier chains, and their economic heft has grown over time. Using Securities and Exchange Commission filings of publicly owned companies to document the large increase in dominant buyers, Wilmers estimates that the share of nonfinance suppliers’ revenue obtained from dominant buyers increased from 5% in 1979 to 19% in 2014 overall and from 6% to 26% in manufacturing and logistics.50 The biggest increase in the role of dominant buyers came in manufacturing, wholesale and shipping, primary resource extraction, utilities, construction, and information and professional services. Over the course of the last four decades “the composition of these dominant buyers shifted toward large retailers [e.g., Walmart] and other intermediaries“ (Wilmers 2018, 221).
Wilmers argues that there was not only an increase in the role of dominant buyers but also an intensification of their wage impact:
egative wage effects have intensified since the early 2000s, and in several years in the 1980s, reliance on dominant buyers had negligible effects. During the period of wage stagnation and the restructuring of buyer-supplier relations, the wage effects of dominant buyer reliance turned increasingly negative. (Wilmers 2018, 229)
Wilmers estimates that the increase in dominant buyers lowered the growth of average annual earnings by 3.4 percentage points over the 1979 to 2014 period among publicly owned nonfinancial firms. The impact among low- and moderate-wage workers almost surely was larger than this.51
Deregulation of industries
Starting in the late 1970s, Congress deregulated various industries, including airlines, trucking, interstate busing, telecommunications, utilities, and railroads.52 In each of these industries, deregulation had a strong adverse impact on the wages and compensation of blue-collar workers. Fortin and Lemieux (1997) showed that 9% of the workforce in the 1980s was affected by industry deregulation and that in such industries there was a much larger erosion of middle-wage jobs.53 According to their estimates, deregulation explained about 7% of the rise in male wage inequality between 1979 and 1988, especially for those above a low-wage threshold. Card (1996) showed a 10% decline over 1980–1990 in the relative earnings of airline workers after deregulation. Deregulation weakened the ability of employers to pay high wages and in many sectors, most notably trucking, led to a steep erosion of unionization (Viscelli 2016). A New York Times (2018) editorial noted, for example, that “the 1.7 million heavy and tractor-trailer truck drivers in the United States earned an average of $44,500 last year…and far below the $55,500 (in 2017 dollars) earned in 1979, despite drivers working longer hours.”
The aggregate impact of the policy choices generating wage suppression
This section draws on the earlier assessments of the factors generating wage suppression to account for the divergence between the growth of net productivity and median hourly compensation over the 1979–2017 period and the suppression of the growth of the 10th percentile wage and the wage gap in the bottom half (i.e., the 50/10 wage gap). We start by looking at the relationship between our analysis and that of other contributions to understanding wage inequality and, specifically, how our analysis complements and points in the same direction as other recent research that has focused attention on worker power.
Relation to other literature
Our analysis builds on what Stansbury and Summers (2020) referred to as a “long history of progressive institutionalist work exemplified by Freeman and Medoff (1984), Levy and Temin (2007), and Bivens, Mishel, and Schmitt (2018).”
An important recent marker in this tradition was the keynote address by former chairman of the Council of Economic Advisers and Princeton economist Alan Krueger (Krueger 2017) to the Federal Reserve Board Jackson Hole conference. Krueger said that certain economic models “give employers some discretion over wage setting” and, in a footnote, said, “Notice that I don’t call these features ‘imperfections.’ They are the way the labor market works. The assumption of perfect competition is the deviation from the norm of ‘imperfection’ as far as the labor market is concerned.”
Krueger’s speech reflects a shift away from the conventional labor market view that has been accepted by both liberal and conservative economists for decades: that competitive labor markets are the same as any other market and are characterized by equally empowered employers and employees. What is emerging, however, is an appreciation that labor is a distinct type of commodity and that unequal bargaining power is an inherent characteristic of the employer-employee relationship. This change of perspective has a profound impact on the analysis of labor market dynamics and which labor policies and economic policies in general are required to rebalance power in the labor market and thus obtain robust wage growth and better-quality jobs for the vast majority.
There has also been a growing acceptance that anemic U.S. wage growth can be explained by the “rigging of the system” against the typical worker. This framework was adopted by former President Trump, who picked up on themes earlier laid out by Senators Elizabeth Warren and Bernie Sanders.
That the economic system is rigged to create upward redistribution has been the theme of economists (e.g., Dean Baker, Josh Bivens, Jared Bernstein, Joseph Stiglitz, Lawrence Mishel, Heidi Shierholz, Elise Gould, and James K. Galbraith) and policymakers for some time, though articulations of how the system is rigged vary. President Trump, for instance, focused on immigration, trade treaties, and bureaucracy. Others focus on growing product market monopoly power affecting consumers. Some analyses focus on the need for more competition (Block and Harris 2021). The approach in this paper is to pinpoint and measure the impact of the factors that have empowered employers in the labor market to be able to suppress wage growth for the vast majority; these include maintaining excessive unemployment, weakening labor standards, diminishing unions and their economic and political power, leveraging monopoly power to lower labor costs through fissuring and subcontracting, and by adopting forced arbitration, noncompetes, and other contractual mechanisms to undercut worker options.
This paper returns to a mode of analysis, dominant in the 1990s but abandoned in recent literature, that focuses on empirically identifying the impact of specific causes of wage inequality and evaluating their contribution to explaining overall wage inequality trends.
Comparison to the new monopsony literature
The new monopsony literature reinforces our narrative in important ways and further highlights the need to identify the specific factors generating employer power over wages and ways this power has changed over time. A broad interpretation of employers’ “monopsony” power does not hinge on labor market concentration (i.e., the proverbial one-company town), but instead diagnoses labor markets as being affected by employers’ exercise of power that allows them to cut wages without fear of losing a large portion of their workforces—regardless whether the source of this power is market concentration or anything else.
A number of studies—including Webber (2015 and 2020); Dube, Giuliano, and Leonard (2019); Dube et al. (2020); Bassier, Dube, and Naidu (2020); Azar, Marinescu, and Steinbaum (2019); Langella and Manning (2020); Card et al. (2018); and the meta-analysis by Sokolova and Sorensen (2020)—show that employer power is ubiquitous in the modern U.S. labor market. These studies estimate the labor supply elasticities facing firms, i.e., the responsiveness of employees to exit following changes in wages offered by employers. For instance, Webber (2020, 18) notes:
The majority of firms (median labor supply elasticity=0.85) compete for workers in labor markets where the typical employee is highly unlikely to move in response to small or even modest changes in their wage. This gives these firms considerable latitude to pay lower wages without worrying about a mass exodus of employees.
The monopsony literature has identified a substantial amount of employer power such that employers are able to, as Bassier, Dube, and Naidu (2020) put it, “mark down” wages by anywhere from 20% to 50%. There is some evidence on the time trend of employer monopsony power; two studies have shown that employer power increased since the late 1990s (Webber 2020; Langella and Manning 2020), though Bassier, Dube, and Naidu (2020, Table 6) show stability over the 2003–2012 period. One consistent finding of these studies is that employers are able to exert more power over low-wage than other workers, affirming that employer power generates wage inequalities.
What these studies, which overwhelmingly focus on recent data, convincingly demonstrate is that employers wield power over U.S. wages. These studies also point to influences that seem to blunt the effect of employer power—like unionization, high-pressure labor markets, and high values of minimum wages. For example, Bassier, Dube, and Naidu (2020), examining the 2003–2012 period, find that monopsony power was greater in the 2007–2010 period of very high unemployment than in the preceding or subsequent years. Langella and Manning (2020) find monopsony power in the U.S. declining in recoveries (1996–2000 and 2002–2007) and increasing as unemployment escalates (2000–2002 and after 2008 but continuing through 2016).
What these studies suggest is that employer power is ubiquitous in labor markets and, absent institutions and policies that provide countervailing power, wages will be lower and wage growth suppressed. One way to interpret the review of evidence in the current paper is that employer power is the constant of modern labor markets, but what has changed over the past generation in the United States to generate anemic wage growth is the erosion of institutions and policies—high-pressure labor markets, unions, and binding minimum wages—that once provided countervailing power.
Naidu and Sojourner (2020) usefully place this shift into a broader context:
It is not clear that monopsony power has increased over time, but that is also not necessary to make monopsony an important force for explaining inequality…. It is clear that the scope that employers have to exercise the market power they do hold has increased over time, as argued by Erickson and Mitchell . In an economy without unions, without strong internal labor markets, and with low-cost worker performance monitoring, the forces that may have restrained employers from exercising the latent market power they held (collective bargaining agreements, implicit seniority rules, within-firm equity norms, and efficiency wages) have diminished. It may not be that monopsony has gone up, but it is certainly true that the countervailing forces have declined.
In this light, this paper’s analysis can be considered an examination of “what has changed” in the face of ongoing employer power in labor markets.
This new monopsony literature provides a top-down analysis, which has primarily focused on estimating the aggregate scale of employer power. Some of the recent contributions have started to identify the underlying factors, examining the role of unionization, high-pressure labor markets, and high values of minimum wages, in explaining an aggregate metric of monopsony power. In contrast, our study is a bottom-up analysis examining the impact of myriad specific factors and gauging their contribution to the productivity–median compensation divergence over the past four decades.
Explaining the divergence between productivity and median hourly compensation growth
In examining the corporate and government policy levers that have suppressed wages, our conclusion is that they can account for the vast majority of wage suppression. In the next section we find that these policies can account for the entirety of the fall in wages at the 10th percentile and the corresponding growth of the wage gap between low-wage workers and the median worker.
It can be difficult to assess causality and take interactions into account. But looking at the sum of the impact of the key factors supports the narrative that intentional policy decisions (either of commission or omission) have generated wage suppression. Analysts may differ on the assessment of particular factors, but our hope is that this compilation inspires further efforts, including ones for which we do not have sufficient empirical work to even make guesses.
How much needs to be explained? Above we estimated that by 2017 rising inequality and the erosion of labor’s share of income had lowered compensation of median workers by roughly 43% relative to net productivity growth. Table 3 summarizes the estimated impact on median hourly compensation of the factors that have driven rising inequality and the decline in labor’s share of income. The first panel details the productivity and compensation trends. Between 1979 and 2017 net productivity (economywide productivity net of depreciation) grew 56.0% while median hourly compensation (wages and benefits) grew 13.0%, leaving a 43.0% divergence. If we used hourly compensation of production workers (82% of payroll employment) as the pay measure rather than the median wage, the divergence would be even greater. Benefits are included in these analyses using the ratio of compensation to wages from the National Income and Product Accounts to convert wages to compensation. By deflating both net productivity and the pay measures by the CPI-U-RS index, we have stripped out the influence of differing deflators (for productivity and compensation) from our calculation of the divergence, leaving only the changes in labor’s share of income and changes in compensation inequality as drivers of the divergence (see Bivens and Mishel 2015).
The impact of specific factors on the growth of the median wage is detailed in the second panel and discussed next. For purposes of the analysis we equate the impacts on median wages, identified above, with that on median hourly compensation: this is not a consequential decision since the 13.0% growth of median hourly compensation over the 1979–2017 period just slightly exceeded the 12.2% growth of median hourly wages.54
The share of the various factors in explaining the overall divergence of net productivity and real hourly compensation is presented in Table 4 and illustrated in Figure I (examining growth, in percent, of factors) and Figure J (examining growth, in dollars, of factors).
Austerity macroeconomic policy (excessive unemployment)
The impact of excessive unemployment caused by contractionary macroeconomic policy, promulgated to control inflation, (suppressing labor costs in the name of controlling inflation) reduced wages for the median worker by 10.0% between 1979 and 2017. Adjusting for the “flattening” of the Phillips curve since 2008, as we do here, lessens the impact of higher unemployment on wage growth; without this adjustment the impact would have been 12.2%. These contractionary policies caused unemployment to remain 0.8 percentage points above even a conservative estimate of full employment (the NAIRU)—5.5%—between 1979 and 2017, a sharp contrast from the 0.51 percentage points that unemployment remained below the NAIRU in the prior 30 years. If the unemployment rate had been held lower, say to 5% on average, then median wages would have been about 18.3% higher by 2017.
Of course, a 5.5% target for full employment is a modest goal, and if policymakers had achieved a reasonable target of 4.5% the impact of excessive unemployment would be double the 10% presented in Table 3.
Erosion of collective bargaining
The erosion of collective bargaining had an adverse impact by lowering the wages of non-college-educated workers, particularly men, and has also lowered the wages and benefits of nonunion workers in sectors where collective bargaining had previously set wage patterns. Fortin, Lemieux, and Lloyd (2021) estimated that eroded unionization (including spillovers) explains 37.3% of the growth of the 90/50 wage gap (which rose 0.33 log points) among men over the 1979–2017 period, equivalent to a 0.32 percentage point annual decline and a 12% (log point) decline in wages over the entire period for the median male earner. Union coverage fell less for women (due to less unionization among women in 1979), so union erosion explains only 13% of the growth of the 90/50 wage gap (which rose 0.28 log points) among women, equivalent to a 0.10 percentage point annual decline and a 3.6% (log point) decline in wages over the entire period for the median female earner.
We relied on an unpublished analysis of the Fortin, Lemieux, and Lloyd (2021) model to pinpoint at 7.9% the impact of deunionization on the median wage of all workers (men and women combined) for the 1979–2017 period:
Deunionization raised the log 90/50 wage gap by 7.7 log points, almost entirely by reducing the median hourly wage by 7.6 log points, or by 7.9% (0.2 percent annually). The impact on men is larger, with deunionization lowering the male median wage by 10.9 log points, or 11.6% (0.29 percent annually). Deunionization therefore explains 33.1% of the 23.2 log point growth of the 90/50 wage gap over the 1979–2017 period.
Above we noted that Mishel, Rhinehart, and Windham (2020) show that automation and globalization can explain less than a fifth of the erosion in private-sector collective bargaining; the lion’s share has been due to changes in corporate practices enabled by lax legal protections and changing rules.
Globalization on capital’s terms
Bivens (2013) found that, by 2013, trade flows with low-wage nations were likely reducing wages for workers without a four-year college degree by roughly 5.6%. For a non-college-degreed worker making the median hourly wage and working full time, full year, this translates to about $2,000 annually. This estimate is nearly identical to what Autor, Dorn, and Hanson (2013) find in a regression-based investigation of the wage impacts of imports from low-wage countries.
Policy decisions have amplified globalization’s downward wage pressure. Trade agreements, for instance, have been the result of corporate capture that has engaged in selective and regressive protectionism that has severely restricted the policy space of our trading partners.
Impact of the top three factors
As summarized in Table 4 and Figure I, together these three factors alone—excessive unemployment, eroded collective bargaining, and corporate-driven globalization—can account for a 23.5% decline in the median wage from 1979 to 2017 and for 54.7% of the divergence between net productivity and median hourly compensation. Figure J shows that excessive unemployment, eroded collective bargaining, and corporate-driven globalization lowered the growth of median hourly compensation by $5.45: absent these factors median hourly compensation would have risen to $28.59 rather than to $23.59.
Weaker labor standards
The failure to update the value of the federal minimum wage is a premier example of policy action shaping the wage structure and undermining the wages of the bottom third of earners (heavily women and minorities), or 46 million workers. The minimum wage’s impact probably does not extend to the median, so we express that as zero in Table 3. The impact on the 10th percentile wage is considered below.
The erosion of other labor standards likely had an impact throughout the wage structure. Overtime protections for salaried workers declined precipitously and nicked median workers’ wages by 0.3%, while growing misclassification of workers as independent contractors lowered the median wage by 1.0%. Other practices and policies, like lax protections against wage theft, the increased presence of undocumented workers and guestworkers, and more extensive racial discrimination have likely lowered wages, but we are not able to provide an empirical assessment.
Employer-imposed contract restrictions
Employers have increasingly required employees to relinquish various rights when they accept employment, or even after they are already employed, through agreements regarding noncompetition and forced arbitration. Employers within franchise chains have also colluded against employees through anti-poaching agreements, which limit workers’ employment options. The effort to quantify the impact of these policies is still in the beginning stages. We estimate that noncompete agreements have reduced the median wage by 2.25%, but we have not been able to derive good estimates of the impact of forced arbitration (now covering more than half of nonunion employees) nor of anti-poaching agreements among franchisers.
Changes in corporate structure
Changes in corporate structure—from deregulation to fissuring to rising market concentration—likely pushed down wages by at least 5% by 2017. A speculative gauge of the impact of a shift of 15 percentage points of employment into fissured workplaces where wages are 15% less would imply an overall decline of wages of 2.25% and probably an even larger decline at the median. Wilmers’ (2018) estimated that the increase in dominant buyers lowered annual earnings by 3.4% over the 1979–2014 period among workers in publicly owned nonfinancial firms; the impact presumably fell disproportionately on low- and moderate-wage workers. Industry deregulation in airlines, trucking, interstate busing, telecommunications, utilities, and railroads permanently lowered wages for blue-collar workers in the affected industries. Fortin and Lemieux (1997) estimated that 9% of the workforce in the 1980s was affected by industry deregulation, and this explains about 7% of the rise in male wage inequality between 1979 and 1988. Increased product market concentration’s direct impact on prices and profits may not have added to wage suppression, though the leverage of monopoly enables fissuring and the dominant buyer’s ability to squeeze wages and profits in supplier chains.
There is likely to be some double counting when aggregating the fissuring and dominant buyer factors, but it is also likely that the unassessed components of corporate structures exerted at least as much downward wage pressure to offset it.
Automation/skill-biased technological change
As detailed earlier and in Appendix A, automation and skill-biased technological change are prima facie implausible explanations of the wage suppression or wage inequality experienced at least since 1995. It is notable that productivity and investments in capital, software, and information equipment—the footprints of automation—have all decelerated, at least since 2005. Moreover, the rate of change of occupational employment patterns has been historically slow. Indirect or deduced measures of automation-driven relative demand for skills (measured in terms of a college education) have also grown remarkably slower since the mid-1990s (Autor, Goldin, and Katz 2020; Autor 2017). In addition, occupational job polarization has not been present since the late 1990s (Autor 2010; Autor 2015; Mishel, Shierholz, and Schmitt 2013; and others). Given this deceleration of the salient indicators of automation and automation’s impact on key labor market metrics (relative demand for college education, occupational polarization), we assign no impact in Table 3 to automation or skills gaps in driving the productivity–pay divergence for the 1995–2017 period. Our discussion above did not cover the 1979–1995 period, so we do not assign any impact one way or another to automation and skills gaps then. We remain skeptical that there was any impact, though, following the analysis in Mishel, Bernstein, and Schmitt (1997a) and Card and DiNardo (2002).
Suppressed wage growth at the 10th percentile and growth in the 50/10 wage gap
We can also draw on our analyses of the various factors to explain the trend in the wage gap in the bottom half—between the median and the 10th-percentile earner—and the disappointing wage growth at the bottom. Recall that wages at the bottom fared similarly to those in the middle from about 1987 onward, and for low-wage workers wages plummeted in the 1979–1987 period, especially among women. The 50/10 wage gap grew only in the 1979–1987 period. Two factors, the lowering of the inflation-adjusted value of the federal minimum wage and excessive unemployment, can readily explain these trends.
Contribution of the eroded minimum wage
The failure to maintain the value of the minimum wage since 1979 greatly shaped the wage gap in the bottom half and the level of wages at the 10th percentile; this was discussed above and presented in Table 2, based on analysis of the Fortin, Lemieux, and Lloyd (2021) model (which includes spillover effects). Table 5 draws on these results and shows that the fall in the minimum wage lowered the 10th percentile wage by 16.7 percentage points between 1979 and 2017, far more than the actual 2.1% decline of the 10th percentile wage. Almost the entire growth—15.0 percentage points—of the 50/10 wage gap can be explained by a lower minimum wage (impact of 13.8 percentage points); absent that the 50/10 wage gap would have shrunk modestly (by 4.7 log points). It was primarily the lowering of the real value of the minimum wage in the 1979–1987 period that drove the growth of the 50/10 wage gap and the lowering of 10th percentile wages, especially among women.
These estimates of the minimum wage’s impact on low-wage earners would be even greater if the counterfactual were maintaining the threshold relative to the median either as it was in 1979 or at the historic peak value in 1968. For instance, the ratio of the minimum wage relative to the median wage of all full-time, year-round workers fell from 52.8% in 1968 to 45.7% in 1979 and to 33.3% in 2017 (Cooper 2019, Figure C). Thus, the minimum wage in 2017 would have to increase by 37% to reach the 1979 level or by 59% to reach its level of 1968. In contrast, if the standard is the real value of the minimum wage, in 2017 it would have needed to be increased by 26% to attain its 1979 level. The minimum wage’s threshold could be targeted at a much higher level if not for the dramatic shortfall of the growth in the median wage relative to net productivity—the 43% shortfall highlighted in this paper.
Contribution of excessive unemployment
Excessive unemployment had a somewhat larger impact on low-wage than middle-wage workers. Had unemployment averaged 5.5% rather than the 6.3% that prevailed over the 1979–2017 period, the wages of the 10th percentile worker would have been 11.6% higher and the 50/10 wage gap would have been 2.7 percentage points lower (Table 4). As discussed above, these estimates take into account the “flattening” of the Phillips curve post-2008. We would note that the impact of higher unemployment would be double what is presented here if we assumed a baseline for full employment of 5.0%.
Summing up the factors
In all, the policy-driven factors delineated in Tables 3, 4, and 5 explain a vast share of the divergence between productivity and median hourly compensation and changes in the wage gap in the bottom half.
The best-measured impacts, those for excessive unemployment, eroded collective bargaining, and corporate-shaped globalization, can account for 23.5 percentage points (or 55% of the total) of the 43% productivity–median compensation divergence. The harder-to-measure impacts of other factors (lowering of the overtime threshold for salaried workers, misclassification, noncompete agreements, and changes in corporate structures like fissuring) can collectively account for another 9.2% of the erosion of the median wage and explain another 21.4% of the divergence. These sum up to explaining about three-fourths (76.1%) of the divergence (Table 4 and Figure I). This is an understated conclusion since there are many additional policy factors that we have not been able to empirically assess: wage theft, guestworker programs, racial discrimination, industry deregulation, exploitable immigrants, forced arbitration, and anti-poaching agreements.
Excessive unemployment and the erosion of the minimum wage more than fully explain the (limited) growth of the wage gap in the bottom half and the substantial shortfall in the growth of the 10th percentile wage (which fell modestly even though net productivity rose by more than half). Other factors such as exploitable immigrants with limited legal rights, increased wage theft, and employee misclassification also depressed wages at the bottom.
In short, without all of these policy-driven changes in the U.S. economy, the bulk of the gap between typical workers’ pay and economywide productivity would not have occurred, and wages at the 10th percentile would have risen instead of fallen. Limited access to courts, collective bargaining, and employment and the inability to rely on government labor standards have systematically weakened the options that workers have to improve their wages, hours, and working conditions.
There are reasons to believe that the impact of these factors is larger than the sum of their individual effects. One way of understanding what has happened is to gauge all the ways that an individual workers’ options to obtain better employment conditions or to affect their current employment have been increasingly foreclosed—limiting both exit and voice. When workers want to improve their conditions of work, they have increasingly limited options to organize a union, rely on adequate and enforceable government standards (e.g., the minimum wage, safety and health, overtime, anti-discrimination, correct classification), or make employers accountable through litigation. Exit is more limited because of anti-poaching agreements, noncompetes, and generally higher unemployment, and the downward pressure on their wages is intensified by globalization, fissuring, and dominant buyer power. Increasingly, resistance is futile.
The lessons here are simple. Wage growth has been greatly directed by policy decisions and is a political variable. It responds—robustly—to big policy changes. But for decades these policy decisions have gone in the wrong direction. Policymakers can deliver prosperity to the vast majority of U.S. workers based on faster wage growth. Whether workers obtain a fair share of the economy’s gains in the future will depend not so much on abstract forces beyond their control but on demanding that their political representatives restore bargaining power to workers, individually and collectively.
Acknowledgments
We gratefully acknowledge the assistance of people who provided information or commented on particular issues: Eileen Appelbaum, Danny Blanchflower, David Cooper, Daniel Costa, Nick Hanauer, Thomas Lemieux, Mike Lipsitz, Celine McNicholas, Suresh Naidu, Heidi Shierholz, John Schmitt, Andrew Sharpe, Anna Stansbury, Evan Starr, Marshall Steinbaum, Thea Lee, David Weil, Nathan Wilmers, and Ben Zipperer. Melat Kassa provided essential, excellent research assistance. We also are appreciative of the funding of the Economic Policy Institute’s Unequal Bargaining Power initiative by the Nick and Leslie Hanauer Foundation, the William & Flora Hewlett Foundation, and the Bernard and Anne Spitzer Charitable Trust.
Appendix A: The failure of automation and skill gaps to explain wage suppression or wage inequality
That U.S. workers have “skills deficits,” that is, lack the skills necessary to deal with technological change, including primarily automation, has been the predominant explanation offered by economists, pundits, policymakers, and the media to explain sluggish wage growth and inequality in the United States, at least until recently. This is the skill-biased technological change hypothesis, which points to the increased use of computer equipment in the workplace and the onset of the information age.
This narrative is sometimes presented as explaining the wage gaps between “skilled” and ‘‘unskilled” (meaning those without a college degree) earners and the disappointing wage growth for the vast majority. This appendix will show that the skills deficit/automation claim has always been a weak explanation for the trends since 1979, and, since the mid-1990s, all indications are that there is no basis at all for considering automation as a significant factor in wage suppression or the growth of wage inequality. For this reason, center-left economists have increasingly stopped highlighting these factors in discussions of the wage problems we face, though the narrative lingers among the punditry.
The conventional wisdom on automation and wage inequality
The general view of the last 30 years is that inequality and wage stagnation are the result of technological change in the workplace, meaning automation, and globalization driven by either technological advances or the political decisions of U.S. trading partners (China’s decision to join the world trading system, for example). These trends were seen as not only inevitable but desirable, in that the harm to workers is the byproduct of forces one would neither want to nor could change. The only appropriate remedy is to adapt, primarily by upgrading workers’ skills and education and perhaps by providing a more adequate safety net.
We examined in the body of the paper the impact of globalization for wage trends and drew two conclusions: Globalization played a nontrivial role in lowering the wages of non-college-educated workers, and this downward pressure has been strengthened by policy decisions creating selective and regressive shaping of the global rules. This appendix focuses on the automation/skills deficit dimension.
The automation narrative in the 1990s (the Clinton years)
In the 1990s center-left economists settled on skill deficits as the dominant explanation for growing wage inequality. As noted by President Clinton’s Council of Economic Advisers (1995):
The sluggish growth of incomes is due to dramatic changes in technology and in global competition that have affected industrialized economies around the world, reducing the relative demand for workers with less education and training…. ost economists believe that a shift in the demand for labor in favor of more highly skilled, more highly educated workers has played a key role. Intensifying global competition is also cited as a factor in putting downward pressure on the wages of less educated workers. However, a number of studies have found that the easily measured direct effects of trade on the wage distribution were small….
An array of economists adopted the automation narrative in the 1990s. Conservatives drew on the work of Kevin Murphy, Gary Becker, and others to conclude that skills deficits explained wage gaps, pointing to higher returns to both education and other, unobservable (meaning not captured by specific variables in survey data) skills. The center-left drew on the work of Katz and Murphy (1992) and, later, an important book by Goldin and Katz (2008), The Race Between Education and Technology. While conservatives have produced little new empirical work on wage inequality in the last 20 years or so, the center-left has focused, until very recently, on developing a newer version of skill-biased technological change centered on the polarization of occupational employment patterns (Autor, Katz, and Kearney 2006; Autor 2010; Acemoglu and Autor 2011; Kearney, Hershbein, and Boddy 2015).
The automation narrative in the 2010s (the Obama years)
This narrative was the dominant one offered by the Obama administration, and President Obama (USA Today 2018) was still offering it in September 2018:
This change has happened fast, faster than any time in human history. And it created a new economy that has unleashed incredible prosperity. But it’s also upended people’s lives in profound ways. For those with unique skills or access to technology and capital, a global market has meant unprecedented wealth. For those not so lucky, for the factory worker, for the office worker, or even middle managers, those same forces may have wiped out your job, or at least put you in no position to ask for a raise. As wages slowed and inequality accelerated, those at the top of the economic pyramid have been able to influence government to skew things even more in their direction: cutting taxes on the wealthiest Americans, unwinding regulations and weakening worker protections, shrinking the safety net. So you have come of age during a time of growing inequality, of fracturing of economic opportunity.
In this story, rapid technological change has led to substantial growth overall and for those at the very top—the ones with “unique skills” and “access to capital”—while those without unique skills and access to capital experience diminished demand and are unable to push for higher pay.
Similarly, a leading conservative labor economist and chairman of the George W. Bush Council of Economic Advisers from 2006 to 2009, Ed Lazear, offered the automation story in the Wall Street Journal in 2019:
How are American workers doing? Neither the middle class nor the poor have fared well in recent decades—but don’t blame tax cuts, a too-low minimum wage or the greed of the 1%. In rich countries around the world, the top half of the income distribution has been pulling away from the bottom half. Productivity growth among high-wage workers, driven by technological change, is the reason…. The likely explanation is that changes in trade and technology have raised the productivity of highly trained, highly educated workers relative to the less skilled. Wages tend to move with productivity, so that if differences in worker productivity grow, wage differences will also grow. (Lazear 2019)
The skills deficit story sounds logical, but it’s not true. It fails to explain wage patterns over the last four decades, and it is a prima facie implausible explanation for at least the last 20 or more years (since 1995 or 1999). Contrary to President Obama’s contention, technological change (or at least automation) has not been especially rapid in the last dozen years or so (there’s actually been a substantial deceleration). Further, the contention that there has been a shift in the demand for labor in favor of more highly skilled, highly educated workers was not true in the late 1990s and has happened far more slowly in the 2000s than in earlier periods.
Automation: A flawed explanation
There have been two versions of the automation narrative, one based on education wage differentials, used to explain the trend in 1980s, and one based on “polarization” in occupational employment, used to explain the 1990s and beyond. Both versions were recently offered by economist David Autor as being among four explanations of wage inequality (Greenhouse 2020). Autor was asked, “espite productivity gains of around 75% since the 1970s, the average American worker saw their wages increased by only 20% since then. There are numerous theories as to what has caused this…. How do you think this happened?” He responded:
There’s no single answer to that question. I would say there are four really important forces. One of them is educational attainment—the rate of growth of educational attainment in the United States actually slowed in the early 1980s. So the rate at which people were completing college, but the demand was growing for college-educated workers. And that led to a lot of rising inequality, just because the wages of the more educated rose relative to others….
A second force is the direction of technological change, which has increased the value of abstract reasoning of creativity, of expertise, of judgment, and devalued a lot of skilled work that people did that followed well-understood rules and procedures. So that would be many clerical jobs, phone answering jobs, calculating, accounting, bookkeeping, copying and filing, but also many production jobs, which often involved skilled, repetitive tasks. But increasingly once we understand the rule book for that type of work, it’s feasible to encode it in software and have it executed by machines or by computers. [Autor mentioned two other forces: “trade pressure” and institutional changes that eroded worker protections.]
This section will briefly review the failures of both versions of the automation narrative to explain the key wage patterns identified in the paper. Our discussion focuses on automation and not “technology” or “technological change,” since the latter terms imply a more general dynamic than one in which the implementation of new technologies in workplaces substitutes software and equipment for labor.
The education narrative
The automation story based on educational differentials sees wage inequality as being driven by increasing education wage gaps. The reasoning is that workplace automation has had a “skill bias” in recent decades, meaning that automation has largely just reduced the demand for a subset of workers—those largely without four-year college degrees. In most discussions skill is equated with what people obtain with four-year college degrees. If the supply of college-educated workers keeps up with the demand for college graduates driven by ongoing automation, then the wage premium for having a college degree will be flat and there will be no increase in wage inequality. If supply fails to keep up with automation-driven relative demand—leading to “skill deficits”—then the relative price of college graduates will rise and drive up wage inequality. Some have argued (as mentioned earlier) that the supply of college graduates faltered around 1980 and failed to keep up with growing demand from ongoing automation.
But for automation to cause a change in wage patterns, technology/automation has to outrace skills.55 It is not enough for automation to be occurring in workplaces or to continue in the same manner as before. Automation, after all, has been a force in workplaces for over 200 years, while education levels have also grown rapidly. Moreover, it is possible for automation to be a large and ongoing force in shaping the pattern of jobs/occupations (rising white-collar and declining blue-collar employment shares) without it generating wage inequality. For instance, automation was ongoing in the 1950s and 1960s when real median wages rose and wage inequality did not increase.
For a hypothesis to have resonance it should connect the major observations within its purview, and the theory that skill-biased technological change explains growing wage inequality fails across many dimensions.56
Top 1% wage growth. The leading research promoting education wage differentials as the driver of overall wage inequality (Katz and Murphy 1992, Goldin and Katz 2008) does not address the redistribution to the very top. Some might attempt to explain this as increased returns to the skills of executives and professionals in finance corresponding to the rise in the college wage premium. But there is no persuasive evidence to support a skill explanation for rising top 1% wages and income or, specifically, the superlative executive compensation growth and expansion in the financial sector that lays behind it (Bivens and Mishel 2013).
“The more you learn the more you earn.” The education story, at least as applied to the 1980s in Katz and Murphy (1992), offers to explain both the rising 90/50 and 50/10 wage gaps as reflecting the rising relative wage differentials between every level of education: college over some college, some college over high school, high school over less-than-high-school. Such an explanation, however, cannot explain why automation did not generate rising education wage differentials between dropouts, high school graduates, and associate college graduates after the 1980s. The flat or declining 50/10 wage gap in the 30 years after 1987 is inconsistent with the skills-gap narrative, since middle-wage workers who have more education than low-wage workers have not reaped a growing advantage since then. Acemoglu and Autor (2012) identified this as a major failure of the education narrative in their review of Goldin and Katz (2008). Mishel, Bernstein, and Schmitt (1997a) made that same point years earlier. (The changed behavior of the 50/10 wage gap in the 1990s—stable or flat rather than growing, as in the 1980s—has been cited by proponents of the occupational employment polarization story as a motivation for adopting this new framework; see Mishel, Shierholz, and Schmitt 2013 for the history.)
The sharp deceleration in automation-driven relative demand for college graduates in the mid-1990s. The college wage premium flattened in the early and mid-1990s. Several studies, all by proponents of the automation explanation, found that the impact of automation on the relative demand for college graduates substantially declined after the mid-1990s relative to earlier decades. Autor (2017) updated the Katz and Murphy (1992) model and showed that the automation-driven relative demand for college graduates decelerated by a third in the early to mid-1990s. Goldin and Katz (2007, Table 1) also showed a large deceleration in 1990–2005 relative to earlier decades going back to 1950, noting “a slowdown in demand growth beginning in the early 1990s” (p. 6).
Autor, Goldin, and Katz (2020), updating the Goldin and Katz (2008) metrics from The Race Between Education and Technology, confirmed the dramatic deceleration of automation’s impact:
he model’s results…divulge a puzzling slowdown in the trend demand growth for college equivalents starting in the early 1990s. Rapid and disruptive technological change from computerization, robots, and artificial intelligence is not to be found though the impact of these technologies may not be well captured by this two-factor setup.
Their results (based on Autor Goldin, and Katz 2020, Table A2) show a deceleration in growth of relative demand for college graduates in the 1999–2017 period relative to earlier periods: a 45.8% deceleration relative to the 1979–1999 period and a 41.8% deceleration relative to the longer 1959–1999 period. The period since 1999, therefore, has been one featuring a historically small impact of automation on (relative) demand for college graduates.
If automation’s impact has been far less in the last 25 years than in earlier decades, then it cannot explain the ongoing strong or even faster growth of wage inequality in the top half, illustrated by the growth of the 95/50 and 90/50 wage gaps.
It is ironic that just as the education narrative was becoming dominant in the mid-1990s the actual automation-driven relative demand for college graduates became markedly slower, negating the story that automation’s impact was accelerating and causing inequality.
Growing within-group wage inequality. The rise of education wage differentials is, at best, only a partial explanation of rising wage inequality because roughly 60% of the increase is due to greater inequality within education groups (Mishel et al. 2012, Table 4.20; Autor, Goldin, and Katz 2020). Autor, Goldin, and Katz (2020) acknowledge that growing within-group wage inequality is a challenge to the automation narrative.57
Stagnation of wages for college graduates. The story that automation-induced unmet demand for college graduates is lifting the wages of those with more education while punishing the wages of those with less is belied by the actual labor market experience of college graduates. For one, the inflation-adjusted wages of college graduates did not rise between 2000 and 2014, making the “lifting of the most educated” story not very convincing. The widespread use of unpaid internships for college students and graduates provides further evidence that employers do not have “unmet needs.” There is also ample evidence that the wages of entry-level college graduates slumped in the 2000s (Gould 2020) and that many young college graduates filled jobs that did not require a college degree (Abel and Dietz 2014). The median annual wage of recent college graduates, according to the New York Federal Reserve Board, rose by only 1% from 2000 to 2019, hardly a sign of winning in a race between education and technology/automation.
The slow growth of the college wage premium since 1995 or 2000. This fact makes the education wage-gap narrative a prima facie implausible explanation for the growing wage gap in the top half. While the college wage premium grew minimally since 1995 and especially since 2000, the 95/50 wage gap continued to grow strongly. The log 95/50 wage gap rose 0.76 points per year in 1979–2000 and rose even faster, by 1.00 log points per year, over 2000–2019 (see Appendix Figure A). In sharp contrast, the key education wage gap, the college–high school wage premium, grew far more slowly in the latter 2000–2019 period—hardly growing at all, just 0.13 log points per year, 87% slower than in the 1979–2000 period.
As noted above, the growth of the wage gap in the top half, illustrated by the 95/50 or 90/50 gap, is a key wage pattern that needs to be explained, as it was the only source of growing wage inequality other than that of the top 1% in the last three decades. These data show that any explanation of wage inequality based on education wage gaps is implausible for the period since 2000 (and probably since the mid-1990s). That is, it is implausible that a sharply decelerating growth of the college wage premium can help explain an accelerated growth of the 95/50 wage gap since 2000.
The slowdown of college completion. The education wage-gap narrative sometimes focuses on the slower growth of college completion post-1979 as the cause of wage inequality. This makes sense within the conventional framework that ignores the role of other factors—globalization, weaker unions, lower minimum wages, and so on—besides supply and automation-driven relative demand. Nevertheless, the slowdown of college completion cannot explain wage inequality since the early to mid-1990s, the era of slight growth in the college wage premium. After all, slow college completion is said to increase wage inequality as the relative supply of graduates falls short of relative demand. The growth of the relative supply of college graduates, according to Autor, Goldin, and Katz (2020, Table 3), was very slow in the most recent two decades (1999–2017), yet the college wage premium barely grew.
The framework put forth by Katz and Murphy (1992) and by Goldin and Katz in The Race Between Education and Technology (2008) relies on competitive labor markets driven solely by relative supply of education and automation-driven relative demand for education. The notion that the relative demand for education (as a proxy for automation) can be deduced from education wage premiums and supply trends presumes that factors other than automation (unions, globalization, minimum wages, corporate structure changes, and others) have no impact. The evidence presented in this paper indicates otherwise. Simply put, the college–high school wage premium goes up and down for lots of reasons besides automation and supply factors, and we cannot readily deduce automation’s impact from data on wages and education supply.
There have been many critiques of the skills deficit/education wage-gap narrative in the past, and the analyses have stood the test of time; these include Mishel and Bernstein 1994; Mishel, Bernstein, and Schmitt 1997a, 1997b; Mishel and Bernstein 1998; Howell and Wieler 1998; Galbraith 1998; Howell 2001; Card and DiNardo 2002; Mishel, Shierholz, and Schmitt 2013; and Howell and Kalleberg 2019.
The job polarization automation narrative
A new automation-causes-wage-inequality narrative emerged around 2005 to replace or supplement the education wage-gap narrative and to overcome one of the latter’s key weaknesses—the inability to explain why the 50/10 wage gap grew in the 1980s but flattened or declined in the 1990s. The job polarization story claims that the nature of automation changed starting in the 1990s such that automation replaced middle-wage occupations/jobs more than jobs in low-wage and high-wage occupations. This is demonstrated by mapping the changes in occupational employment patterns by wage level. That is, this story relies heavily on the expansion of low-wage occupations characterized by routine manual tasks, the expansion of high-wage occupations requiring abstract, nonroutine tasks, and a corresponding shrinkage of occupations in the “middle,” which perform routine manual tasks.
Autor, Katz, and Kearney (2006) articulated this narrative:
hese models also imply a puzzling deceleration in relative demand growth for college workers in the early 1990s, also visible in a recent “polarization” of skill demands in which employment has expanded in high-wage and low-wage work at the expense of middle-wage jobs. These patterns are potentially reconciled by a modified version of the skill-biased technical change hypothesis that emphasizes the role of information technology in complementing abstract (high-education) tasks and substituting for routine (middle-education) tasks.
This occupational employment polarization narrative was introduced into the policy world in a Center for American Progress/Hamilton Project paper by David Autor (2010) and articulated as the necessary replacement for the education narrative in Acemoglu and Autor (2012).
But the job or occupational polarization story fails to explain key trends and wage patterns:
Growth in top 1% wages. The job polarization narrative, as with the education wage-gap narrative, fails to address the superlative wage growth of the top 1% and top 0.1%, a major dynamic driving wage inequality.
Lack of evidence of job polarization since 1999 or in the 2000s. This was demonstrated in Mishel, Shierholz, and Schmitt (2013) and Beaudry, Green, and Sand (2013, 2014) and further confirmed in Hunt and Nunn (2019). The key chart in Autor (2010, Figure 1) showed there was no job polarization in the 1999–2007 period, but that finding was not mentioned in the text. Autor’s paper (2015, 149–50) for the Kansas City Federal Reserve Board’s annual Jackson Hole conference acknowledged the lack of polarization in the post-1999 period through 2012, the latest data available at that time:
Although the polarization hypothesis can explain some key features of the U.S. and cross-national data, reality invariably proves more complicated than the theory anticipates. The clearest evidence for this general dictum is the unexplained deceleration of employment growth in abstract task-intensive occupations after 2000, which is discussed by Beaudry, Green, and Sand (2013, 2014) and Mishel, Shierholz, and Schmitt (2013)…. The final empirical regularity highlighted by Chart 7 is that growth of high-skill, high-wage occupations (those associated with abstract work) decelerated markedly in the 2000s, with no relative growth in the top two deciles of the occupational skill distribution during 1999 through 2007, and only a modest recovery between 2007 and 2012. Stated plainly, the U-shaped growth of occupational employment came increasingly to resemble a downward ramp in the 2000s.
A “downward ramp” and the absence of the “U-shaped growth of occupational employment” are acknowledgments, though expressed in a not-very-straightforward manner, that job polarization was not present between 1999 and 2012.
Obviously, a narrative based on the changing composition of employment by occupation (expanding low-wage and high-wage occupations and shrinking middle-wage occupations) cannot be relevant to explaining post-1999 wage patterns if those occupational employment patterns have not been evident. In fact, the Autor (2014) data show that nearly all of the employment growth was in low-wage occupations, a pattern that does not readily explain why the wage gap between the top and the middle kept expanding and did so at an accelerated pace. For occupational employment patterns to explain top-half wage-gap growth would require finding a rapidly expanding need for high-wage workers able to carry out abstract, nonroutine tasks, a pattern not present since 1999.
Lack of a relationship between occupational employment patterns and wage inequality. Remarkably, the job polarization narrative relies on mapping occupational employment patterns to explain wage inequality but has never presented evidence that these occupational employment shifts affect wages. In fact, Mishel, Shierholz, and Schmitt (2013) show that changes in occupational employment shares (whether an occupation expands or contracts employment relative to other occupations) are not related to changes in relative wages by occupation (whether wages in that occupation rose or fell relative to wages in other occupations). That is, one would expect that occupations that expand (contract) would have rising (falling) wages relative to other occupations. Looking at the relation between changes in occupational employment shares and the corresponding relative wages of occupations, Mishel, Shierholz, and Schmitt (2013) found no relationship in each of the decades of the 1980s, 1990s, and 2000s. It is also worth noting that middle-wage occupations have shrunk and higher-wage occupations have expanded since the 1950s, but median wages and wage inequality have risen and fallen over this time with no apparent correspondence to job polarization trends.
If occupational employment patterns do not affect occupational relative wages, then they certainly bear no relationship to changes in wage inequality, since presumably the mechanism for automation to cause changes in wage gaps is for automation-induced changes in occupational employment patterns to alter the relative wages of occupations. The effort to track occupational employment patterns has no implications for understanding wage patterns.
Footprints of automation
The discussion so far has relied on economic analyses that derive the pace and skill bias of automation from patterns of occupational employment growth or from wage and education supply trends. It is worthwhile to examine other perhaps more direct footprints of automation to discern the pace of automation in recent years compared to earlier periods. These data are illustrated in Appendix Figure B, drawn from Mishel and Bivens (2017) and Mishel and Shierholz (2017).
Automation is what occurs as new technologies are incorporated along with new capital equipment or software to replace human labor in the workplace. Labor productivity and capital investment are both measures of automation in that they necessarily accompany the substitution of capital for labor. Thus, if there were a recent surge of robots or automation, we would expect to see the footprints in trends in productivity, capital investment, and software investment. The trends shown in the figure suggest that automation has been far slower since 2002 than in the three earlier periods: the early postwar years from 1973 to 1973; from 1973 to 1995; and over the high-tech boom years of 1995–2002. There is certainly no evidence of automation having accelerated. These data affirm the findings above that automation, given its slow pace in recent years, is unlikely to have been a major factor driving wage stagnation or wage inequality in the last two decades.
Automation (along with shifts in consumer demand and trade) would be expected to be a major factor in why employment in some occupations expands and employment in other occupations declines. Therefore, we can also examine the pace of change in the occupational composition of employment to deduce trends in automation.
Using the data in Atkinson and Wu (2017), Mishel and Bivens (2017) computed a metric to examine the pace of occupational employment shifts in each decade. Specifically, Mishel and Bivens examined the shares of total employment for each of the 250 occupations in the data for the beginning and end years of each decade and computed the changes in these shares. The sum of the occupational share gains will automatically be equal to the occupational share losses, so the metric of change in each decade is half the sum of the absolute change in employment shares. This metric adjusts for differences in the rate of employment growth in each decade and the absolute employment size of individual occupations. This metric of shifts in occupational employment measures the shares of total employment exchanged between occupations that gain and occupations that lose employment shares each decade.
Mishel and Bivens found that occupational employment changes were “fairly uniform over the 1940–1980 period and far more rapid than for any period since 1980. The period since 2000 has seen the lowest rate of change—half the rate of change of the 1940–1980 period.” These findings indicate that the pace of occupational employment shifts was extremely slow in the 2000s, affirming the deceleration found in the slower growth in productivity, software, and capital investments identified in Appendix Figure B.
Appendix B: The intentionality of macroeconomic policies
There is a growing recognition that unemployment was kept excessively high for the purpose of inflation control over long periods after 1979. Could this have been simply a technocratic mistake, an instance of policymakers underestimating the sacrifice that would be required to keep inflation in check? We think this proposition lets policymakers off the hook too easily.
First, it was completely predictable who would bear the brunt of a contractionary macroeconomic shock, and Fed policymakers, charged with maintaining high employment as well as stable prices, were obligated to construct some portfolio of policies designed to cushion the shock.
Second, macroeconomic policymakers and particularly the Federal Reserve consistently overshot their own conservative estimates of the NAIRU—the nonaccelerating inflation rate of unemployment—during most of the 1979–1995 period. Rather than aiming for stable inflation after the 1970s episode of accelerating inflation, they sought to reduce inflationary expectations to a very small number, and they were willing to tolerate the extended periods of unemployment this required.
Finally, if going the severe contractionary route was a technocratic mistake, it was a foolish one. Keeping unemployment rates above the “natural rate” is an expensive way to reduce inflation, especially since evidence that inflation rates like those experienced in the United States in the 1970s are deeply damaging is very hard to find. In the U.S. postwar experience, there is no consistent relationship between inflation rates and aggregate growth. But large distributional shifts can occur with unanticipated bursts of inflation. Inflation does indeed reduce the real value of wealth stocks, but it also reduces the real value of liabilities. In essence, it causes a redistribution from net creditors to net debtors. So, for example, Americans who bought a home with a fixed-interest-rate mortgage in the late 1960s or early 1970s saw a windfall wealth gain as inflation eroded the real burden of their mortgage obligation. Inflation hawks tend to emphasize particularly sympathetic economic actors who might be hurt by this—retirees living on fixed incomes, for example. Of course, even by the 1970s most retirees’ incomes mainly comprised Social Security benefits, which were largely shielded from price increases.
Against these uncertain aggregate benefits, policymakers should weigh the extremely large and regressive costs of recessions engineered largely to break inflationary expectations. The recessions of the early 1980s and 1990s were both caused in large part by interest rate hikes undertaken by the Federal Reserve to reduce inflation. The cumulative output loss of the two early 1980s recessions approached 80% of one year’s gross domestic product (GDP) at the time, while the early 1990s recession exacted a cumulative cost of nearly one-third of one year’s GDP.
Were these costs necessary for reducing the 1970s inflation? While the 1970s inflation was the first in post-1900 U.S. history to not to be associated with a war effort, its cause was not mysterious: It was the combination of oil price shocks caused by political unrest in the Middle East and the global slowdown in productivity growth. The real price of oil tripled in 1973 (the Yom Kippur War), declined after 1975, and doubled again in 1979 (the Iranian Revolution). These exogenous oil shocks were amplified by wage-price spirals, as both firms and workers tried to raise the nominal prices under their control (product prices and wages, respectively) to avoid bearing the full brunt of adjusting to higher input costs, all without realizing that the economy’s underlying capacity to deliver income growth (productivity) had slowed markedly.
Implicit in this analysis is a view that inflation is at least in part an outcome not just of over-accommodative macroeconomic policy (the conservative view), but of distributional conflict between capital and labor. When bargaining power is more equal, exogenous price shocks take longer to propagate through the economy and cause higher and more persistent inflation. After an exogenous price shock, firms raise their price level to preserve profit margins, at the expense of real (inflation-adjusted) wages. Workers who have some degree of bargaining power can respond by demanding higher nominal wages to claw back the lost ground. Firms then pass on the higher wage costs into higher prices and so on. The longer this process goes on, the steeper and more persistent is the inflation. Conversely, if firms are able to pass on higher prices in response to the initial cost shock and workers lack the bargaining power to demand higher nominal wages in response, then the shock is muted and leads to lower and less persistent inflation.
What made the oil price shocks especially effective in generating wage-price spirals in the 1970s were the atypically strong perceptions held by American workers about their own bargaining power, as well as expectations of real wage growth fostered by decades of rapid and equal economic growth.
Coming into the 1970s, American workers had experienced wage growth on par with productivity growth for most of the past three decades, and this productivity growth averaged 2% per year. They had also come off a decade from 1959 to 1969 when unemployment averaged 4.8% and reached a low of 3.5% in 1969. Further, key labor standards in the U.S. labor market were strong in historical terms. Private-sector unionization rates were 24.2% in 1973, more than twice as high as they are today. The inflation-adjusted value of the minimum wage reached its highest point ever in 1968 after three decades of rising (roughly) with economywide productivity.
An objection to an analysis putting the 1970s inflation at the feet of wage-price spirals has traditionally been that it implicitly blames workers for inflation’s rise, and seems to acknowledge the need for reducing workers’ bargaining power as an anti-inflation strategy. This line of thinking is unjustified and unfair. The root causes of the inflationary episode of the 1970s were two oil price shocks, and a wage-price spiral following such an exogenous shock requires, by definition, both wages (driven by workers’ desire to protect wages’ purchasing power) and prices (driven by firms’ desire to protect their profit margins) to rise. Blaming this spiral on the workers’ side alone is unfair, but typical in our framing of labor-capital conflicts. We’re more likely to hear about “labor militancy” rather than “capital militancy” when the subject is wage-price spirals, but this is probably because it is taken as given that capital will be militant and usually effective in protecting its share of income. Times must be truly remarkable when the economic context allows labor to push back and protect its gains.
Galbraith (1997) makes the obvious inference from this episode:
It would therefore be reasonable to approach anti-inflation policy in general as a matter, first and foremost, of designing circuit breakers for shock episodes, so as to reduce the cost of adjusting to a new pattern of relative prices and therefore the need to do it through the brute-force method of mass unemployment. Some simple steps, like coordinating the timing of wage bargains and providing the president with limited discretion over cost-of-living adjustments in Social Security, federal pensions and other payment streams might help a great deal….
In short, the fact that the 1970s inflation was tamed by the severe contractionary approach does not mean that the approach was most efficient way to tame this inflation, or that the benefits outweighed the costs imposed on the broader economy.
Notes
1. The Republican Party platform reads: “Our economy has become unnecessarily weak with stagnant wages. People living paycheck to paycheck are struggling, sacrificing, and suffering.” The Democratic platform reads: “But too many Americans have been left out and left behind. They are working longer hours with less security. Wages have barely budged and the racial wealth gap remains wide, while the cost of everything from childcare to a college education has continued to rise.”
2. The 44.6% growth is the growth of wages on average over the 1979–2019 period and represents what each group would have experienced absent changes in the distribution of wages.
3. This acceleration is reflected in the growth of the log 95/50 wage gap, which grew 0.75 log points annually from 1979 to 1995 and by 1.0 log points from 2000 to 2019, using the same data as in the figures.
4. This college–high school wage premium is the premium estimated using log hourly wages, and the controls are for gender, race and ethnicity, education, age, and geographic division. The premium is the coefficient on “college,” having a four-year degree but no further education, as the omitted category is “high school.” The sample is wage and salary workers ages 16 and older in the CPS-ORG data; the data are available at https://www.epi.org/data/#?subject=wagegap-coll.
5. See Table A2 in Autor, Goldin, and Katz 2020. The relative supply of college graduates grew 1.96 log points annually from 1999 to 2017, down from 2.28 log points annually from 1979 to 1999. This deceleration of supply should have led to a faster growth of the college wage premium.
6. The most recent version of this chart can be found at https://www.epi.org/productivity-pay-gap/.
7. In addition to these two factors, Bivens and Mishel also identified differential trends in the price deflators used to measure productivity and real median hourly compensation. Since our focus is on the inequality-generating factors–inequality within compensation or a shift toward labor’s share of income—we compute the divergence so as to exclude the impact of differing price deflators (using the CPI-U-Rs to deflate both productivity and median hourly compensation).
8. Restoring labor’s share to 82.4% means a 9.1% across-the-board increase (82.4/75.5 = 9.1%) in compensation); falling to 75.5% is an 8.4% cut ((75.5/82.4 – 1) = 8.4%).
9. This conclusion is based on regression-based estimates of the Black–white wage gap. Wages are adjusted into 2018 dollars using the CPI-U-RS. The regression-based gap is based on average wages and controls for gender, race and ethnicity, education, age, and geographic division. The log of the hourly wage is the dependent variable. See https://www.epi.org/data/#?subject=wagegap-bw.
10. See https://www.epi.org/data/#?subject=wage-education.
11. The range in each estimate brackets the regression results from using state-specific unemployment rates to predict wage growth, as Bivens and Zipperer (2018) did, and results from using national time-series data only. The lower state-specific results likely stem predominantly from smaller and noisier samples at the state level.
12. Estimates of the wage impact of unemployment on the median and 10th percentile wage are from Bivens and Zipperer 2018, Figure F. The impact of 1 percentage point higher unemployment lowers the median wage by 0.459 and 0.296 in the earlier and latter period and lowers the 10th percentile wage by 0.582 and 0.243 in the earlier and latter period.
13. See Bivens and Zipperer 2018 for a demonstration of how including the post-2008 period reduces the coefficient on unemployment in a wage Phillips curve, and Bivens 2019 for coefficient estimates for just the post-2007 period.
14. These data are the share with collective bargaining coverage for “1979,” calculated as an average of 1977–1980 shares from May CPS data.
15. This discussion draws heavily from Bivens et al. 2017.
16. Evidence for these effects can be found in Mishel et al. 2012: union impact and coverage by demographic groups (Table 4.33) and by education, occupation, and wage fifth (Table 4.37).
17. These estimates look at what wages would have been in 2013 had union density remained at its 1979 levels.
18. Fortin, Lemieux, and Lloyd (2021) find a 7.6 log point impact of deunionization on the median. This amount includes both direct and spillover impacts. Their estimate of the direct union impact on the 90/50 wage gap is 52.8% of the total union impact. Applying that share to 7.6 points yields a 4.0 log point estimate of a direct union effect on the median wage. Anna Stansbury provided a benchmark for comparisons to the Fortin, Lemieux, and Lloyd results based on her work with Summers (2020): “We estimate for the nonfinancial corporate sector a direct effect of union decline on labor rents for noncollege workers of 2.9 percent of compensation over 1984 to 2016.” The Fortin, Lemieux, and Lloyd estimates line up close to, even below, the Stansbury-Summers estimate if one adjusts the Stansbury-Summers results for the longer time period used by Fortin, Lemieux, and Lloyd, 1979–2017. There was a very steep decline in union membership from 1979 to 1984, comprising 40% of the total decline from 1979 to 2016. If one scales the Stansbury-Summers estimate to the total decline since 1979, their estimated impact would be 4.8% (2.9% × ), an even larger impact than Fortin, Lemieux, and Lloyd.
19. Western and Rosenfeld find that deunionization’s impact (direct and spillover) on wage inequality explained 33.9% of male wage inequality and 20.4% of women’s wage inequality. The comparable estimate for Fortin, Lemieux, and Lloyd (2021) is deunionization explaining 28.8% and 6.7%, respectively, of men’s and women’s wage inequality.
20. Farber et al. (2021, 33) note: “We show that a combination of low-skill composition, compression, and a large union income premium made mid-century unions a powerful force for equalizing the income distribution.” Specifically (p. 24): “During our long sample period, the union premium has remained between ten and twenty log points, with the less-educated receiving an especially large premium. Moreover, the negative effect of unions on residual income variance is large and also relatively stable over time. By contrast, selection into unions is not constant across time. In the Great Compression period, when unions were at their peak and inequality at its nadir, disadvantaged households were much more likely to be union members than either before or since.”
21. This conclusion leaves open, however, the question of how useful or good the status quo rules of the game governing globalization are, even aside from any downward pressure they may put on American workers’ wages. For example, these rules’ effects on the economic development possibilities of poorer countries or the ability of all countries to tax mobile capital are incredibly important issues in their own right. Saying that the downward wage pressure of the globalization status quo could be overcome with an aggressive domestic policy response does not imply that this status quo should be preserved.
22. This estimate is based on the impact of raising the minimum to $15 in 2025 and including the impact on those who received minimum wage increases at the state or local level since 2017. This estimate understates the share of earners affected since it ignores those in states that had a higher minimum than the federal threshold minimum wage in 2017 but did not increase it further since then.
23. This calculation refers to net productivity growth (output per hour taking depreciation into account). Average wage data are drawn from NIPA data, deflated by the CPI-U-RS.
24. Increase from July 2019 to October 2025, as per analysis in Cooper 2019.
25. This estimate assumes 0.5% real wage growth in the median worker’s wage from 2019 to 2025. One obtains similar results if one examines the real value of the minimum wage relative to the average hourly earnings of production/nonsupervisory workers.
26. See https://www.dol.gov/agencies/whd/minimum-wage/history.
27. The analysis provides estimates of the impact of the higher threshold on weekly hours (Table 21) and weekly wages (Table 22). These data allow a computation of the before and after hourly wages that are the basis for these estimates.
28. Those affected on the post-1979 erosion of the salary threshold include three groups. The first are those directly affected by the raising of the salary threshold as proposed by the Department of Labor, the 4.2 million receiving a 1% hourly wage boost. The second group are the broader group, the 8.9 million affected by the 2016 rule change. There was probably a smaller than 1% wage impact for this group, since it is generally more educationally downscale than those directly affected (see Shierholz 2019 analysis of the education composition of those enjoying new protections versus “strengthened protections” from the 2016 rule change). The remaining group are those who earned above the 2016 rule change and the salary threshold in 1979.
29. See Table 1 in Gould 2018 for the decile cutoffs in 2017.
30. Judged by the share of the workers covered in 1979, 39.8%, compared to those who would have been covered by the 2016 rule in 2015, 32.7% (Kimball and Mishel 2016).
31. This section draws heavily on Shierholz 2021.
32. Calculated as 0.68 * 0.1495 = 0.102.
33. “I was also struck by commentary from leaders at digital platforms in Silicon Valley, as well as our own discussions with executives, venture capital companies, and workers. Most indicated that they viewed an independent contractor status as the default option for employment” (Weil 2017).
34. For instance, a rise of 3.1 percentage points of the entire private nonagriculture workforce yields a 0.5% or 0.9% wage reduction if misclassified workers are paid, respectively, 15% or 30% less than regular W-2 workers. Similarly, a rise of 4.6 percentage points among the bottom two-thirds of the private nonagriculture workforce yields a 0.7% or 1.4% wage reduction if misclassified workers are paid, respectively, 15% or 30% less than regular W-2 workers.
35. This discussion borrows heavily from Costa 2019.
36. For additional discussion and context on OECD’s findings, see Costa and Martin 2019.
37. Also see the literature review in Ortega and Hsin 2018 for evidence of wage disparities between unauthorized and authorized workers.
38. Starr, Prescott, and Bishara (2020, 15) state: “The ability to enforce noncompetes should encourage greater noncompete use, more investment, and higher wages, but employers use noncompetes virtually as often in states where they are clearly unenforceable.” Starr, Prescott, and Bishara (2019) find “that noncompetes are associated with reductions in employee mobility and changes in the direction of that mobility (i.e., toward noncompetitors) in both states that do and do not enforce noncompetes…. e find that employees with noncompetes—even in states that do not enforce them—frequently point to their noncompete as an important reason for declining offers from competitors.”
39. BLS data on “median weekly earnings of full-time wage and salary workers by detailed occupation and sex” at https://www.bls.gov/cps/cpsaat39.pdf show weekly earnings for full-time workers in construction and installation, maintenance, and repair occupations at, respectively, 94% and 102% of U.S. weekly earnings. The noncompete ban estimates are in Figure 5 using fixed effects and controls. Mike Lipsitz kindly provided the exact estimates.
40. The incidence of noncompetes in construction occupations (12%) was a bit below the average (14%), while that for installation, maintenance, and repair occupations was above average (18%) (Figure 5, Starr, Prescott, and Bishara 2020).
41. As Starr (2019b) suggests, “it’s not clear if different establishments owned by separate franchises should be considered competing entities.”
42. Technology plays a role in that communications and other technologies better enable firms to monitor dispersed economic activity and monitor the fulfillment of standards. Key researchers in this field have noted the enabling role of technological changes. Weil (2014) wrote, “Information and communications technologies have enabled this hidden transformation of work.” Bernhardt et al. (2016) write: “New information and communications technologies (ICT) have facilitated outsourcing and the decentralization of producing goods and services because ICT lowers the costs of information processing and coordination of work across organizational boundaries, thereby reducing the cost advantages of internal production. ICT also enhances firms’ capabilities to monitor and enforce contracts with external suppliers, thereby reducing the relative advantages of hierarchy. ICT allows firms to achieve control over productive activities—the advantages of vertical integration—without assuming the risks of actual ownership or the inflexibility of bureaucracy.”
43. Self-employment or independent contracting has been stable for the last 25 years, contrary to the hype about how we are all becoming gig workers and freelancers. The Contingent Worker Survey (CWS) (BLS 2018), the gold standard of data tracking “alternative work arrangements,” found that in 2017 those who were independent contractors (and do not themselves have any employees) on their main job comprised about 7% of all employment, the same as in 1995 and 2005 (BLS 2018). Analysis of tax data through 2016 (Collins et al. 2019) showed that “consistent with the 2017 CWS results, we find no evidence that ‘traditional’ work arrangements are being supplanted by independent contract arrangements reported on 1099s.”
44. There was a modest growth in employment in “staffing firms” as the share of private payroll employment in “employment services” grew from 2.5% in 1995 to 2.9% in 2018 (see Bureau of Labor Statistics Current Employment Statistics (CES) Series CES0500000001 and CES6056130001). Staffing employment in 2018 was actually lower than what prevailed at the start of the last two business cycles in 2000 (3.5%) and 2007 (3.1%). However, the composition of staffing employment shifted as the presence increased greatly in manufacturing (Mishel 2018).
45. Franchising is a part of fissuring to the extent that the franchisee is not simply a retail outlet for the franchisor (“traditional franchising”) but actually “relies on the transfer of a complete business format and methods—including extensive business support (e.g., training of the franchisee) and ongoing monitoring from the franchisor,” called “business template franchising” (Kosová and Lafontaine 2012). Unfortunately, it is hard to track trends in franchising because there are no recent data beyond 2012 (yet), and the data for 2007 and 2012 are not necessarily comparable to what is available in the 1980s and 1990s. Business-format franchisees provided 5.5% and 5.3% of total private-sector employment, respectively, in 2007 and 2012 (this assumes that business-format franchising represents the same share of total franchising employment in 2012 as in 2007). We do not know how much business-format franchising has grown since 2012. We have some historical information on total franchising but not for business-format franchising. According to a discontinued Department of Commerce series of publications, Franchising and the Economy, the share of (all) franchising in private employment was 6.3% in 1978 and 7.9% in 1986, somewhat higher than the 6.8% and 6.5% employment shares in, respectively, 2007 and 2012. Given that traditional franchising has fallen since the late 1970s, we can assume that business-format franchising has increased since the late 1970s, though we do not know how much. (Lafontaine and Blair say that “the value of goods sold via outlets of business-format franchisors has increased from 2.3% to 3.5% of total GDP” between 1972 and 1986, but we could not locate in the Department of Commerce data they cite any reference to business-format franchising. If Lafontaine and Blair are correct, then business-format franchising in the 2007–2012 period was on the same scale as in the 1972–1986 period.) In sum, we know that the type of franchising associated with fissuring represented 5% or so of total private employment in the most recent data available (for 2012) and did not necessarily significantly grow in the prior decades. This type of fissured franchising may have grown since 2012, however.
46. Analysis of the Census Bureau’s Longitudinal Business Database.
47. Weil bases this estimate on an analysis undertaken for investors by A/B Bernstein.
48. Stansbury and Summers (2020, 27–28) argue: “In addition, while a fall in worker rent-sharing power should not have any implication for firms’ underlying markups (which are determined by their product market power), it does have implications for measured markups. This is because measures of aggregate markups used in recent literature depend on firms’ costs, including firms’ labor costs—even if the labor costs partly represent rents accruing to labor as well as the true marginal cost of production. This implies that markups, as they have been measured in recent papers, cannot be used to distinguish between a story of rising product market power and a story of falling worker power: a rise in measured markups could reflect a fall in worker rent-sharing power just as much as it could reflect a rise in true markups and firms’ monopoly power.”
49. Measurement of labor’s share described in Bivens 2019 and the data are available at the Nominal Wage Tracker: https://www.epi.org/nominal-wage-tracker/.
50. Personal communications with Wilmers. Data based on Figure 1 of Wilmers 2018.
51. Based on personal communications and Wilmers 2018 (p. 230): “rowing buyer power from 1979 to 2014 accounts for around 10 percent of the [35 percentage point] decline in earnings growth relative to the 1955 to 1978 trend.”
52. This discussion borrows heavily from Mishel, Schmitt, and Shierholz 2014.
53. “The percentage of male workers in the upper middle of the distribution, with hourly wages between $7.50 and $12.50 in 1979 dollars, fell from 52 percent to 38 percent in deregulated industries, whereas it fell only from 33 percent to 26 percent in other industries” (Fortin and Lemieux 1997, 85).
54. The ratio of compensation to wages, reflecting the scale of nonwage benefits, rose from 1.220 in 1979 to just 1.229 in 2017. See Bivens and Mishel 2015 for details on the data construction.
55. Mishel and Bernstein (1994) referred to this as the need to show “acceleration of technology/automation.”
56. The term “college graduate” in this discussion is explicitly restricted to those with a four-year bachelor’s degree and excludes those with “some college” or an associate degree and those with an advanced degree beyond a bachelor’s. Some discussions lump the college and advanced degree returns or supply together. That can be misleading when the evidence is used to suggest we increase the number of college graduates if, in fact, the evidence may suggest we need more post-college graduates.
57. Some researchers have asserted, without any empirical backup, that within-group inequality reflects the returns to unobservable (not captured by any metric in our regular data) skills. That is, of course, the only way to preserve the skill-biased technological change story without having to look beyond pure supply-and-demand factors. It is not, however, persuasive without further evidence or even some conjecture about what patterns we would expect returns to unobserved skills to display.
References
Abel, Jaison R., and Richard Deitz. 2014. “Are the Job Prospects of Recent College Graduates Improving?” Liberty Street Economics (Federal Reserve Bank of New York blog), September 4.
Acemoglu, Daron, and David Autor. 2011. “Skills, Tasks and Technologies: Implications for Employment and Earnings.” In Handbook of Labor Economics, edited by Orley Ashenfelter and David Card, 4, part B: 1043–171. Elsevier.
Acemoglu, Daron, and David Autor. 2012. “What Does Human Capital Do? A Review of Goldin and Katz’s The Race between Education and Technology.” Journal of Economic Literature 50, no. 2: 426–63.
Apgar, Lauren A. 2015. “Authorized Status, Limited Returns: The Labor Market Outcomes of Temporary Mexican Workers.” Economic Policy Institute.
Appel, Sam, and Carol Zabin. 2019. “Truck Driver Misclassification: Climate, Labor and Environmental Justice Impacts.” UC Berkeley Labor Center.
Appelbaum, Eileen. 2017. “Domestic Outsourcing, Rent Seeking, and Increasing Inequality.” Review of Radical Political Economics 49, no. 4: 513–28.
Appelbaum, Eileen, and Rose Batt. 2014. Private Equity at Work: When Wall Street Manages Main Street. Russell Sage Foundation.
Atkinson, Robert D., and John Wu. 2017. “False Alarmism: Technological Disruption and the U.S. Labor Market, 1850–2015.” Information Technology & Innovation Foundation.
Autor, David. 2010. “The Polarization of Job Opportunities in the U.S. Labor Market: Implications for Employment and Earnings.” Center for American Progress and Brookings Institution: The Hamilton Project.
Autor, David. 2014. “Polanyi’s Paradox and the Shape of Employment Growth.” Working Paper 17040. National Bureau of Economic Research. https://doi.org/10.3386/w20485.
Autor, David. 2015. “Polanyi’s Paradox and the Shape of Employment Growth.” Reevaluating Labor Market Dynamics (Federal Reserve Bank of Kansas City, Economic Policy Proceedings), 129–77.
Autor, David. 2016. “Will Automation Take Away All Our Jobs?” TEDxCambridge.
Autor, David. 2017. “How Long Has This Been Going On? A Discussion of ‘Recent Flattening in the Higher Education Wage Premium: Polarization, Skill Downgrading, or Both?’ by Robert G. Valletta.” Massachusetts Institute of Technology.
Autor, David H., David Dorn, and Gordon H. Hanson. 2013. “The China Syndrome: Local Labor Market Effects of Import Competition in the United States.” American Economic Review 103, no. 6, 2121–68.
Autor, David, David Dorn, Lawrence F. Katz, Christina Patterson, and John Van Reenen. 2017a. “Concentrating on the Fall of the Labor Share.” American Economic Review: Papers & Proceedings 107, no. 5: 180–85.
Autor, David, David Dorn, Lawrence F. Katz, Christina Patterson, and John Van Reenen. 2017b. “The Fall of the Labor Share and the Rise of Superstar Firms.” Working Paper. Massachusetts Institute of Technology.
Autor, David, Claudia Goldin, and Lawrence F. Katz. 2020. “Extending the Race Between Education and Technology.” AEA Papers and Proceedings 110: 347–51.
Autor, David H., Lawrence F. Katz, and Melissa S. Kearney. 2006. “The Polarization of the U.S. Labor Market.” American Economic Review 96, no. 2: 189–94.
Autor, David H., Lawrence F. Katz, and Melissa S. Kearney. 2008. “Trends in U.S. Wage Inequality: Revising the Revisionists.” Review of Economics and Statistics 90, no. 2: 300–23.
Autor, David, Alan Manning, and Christopher Smith. 2010. “The Contribution of the Minimum Wage to U.S. Wage Inequality over Three Decades: A Reassessment.” Massachusetts Institute of Technology Working Paper.
Autor, David, Alan Manning, and Christopher Smith. 2016. “The Contribution of the Minimum Wage to U.S. Wage Inequality over Three Decades: A Reassessment.” American Economic Journal: Applied Economics 8, no. 1: 58–99.
Azar, José, Ioana Elena Marinescu, and Marshall Steinbaum. 2017. “Labor Market Concentration.” National Bureau of Economic Research Working Paper no. 24147. https://doi.org/10.3386/w24147.
Azar, José, Ioana Marinescu, and Marshall Steinbaum. 2019. “Measuring Labor Market Power Two Ways.” AEA Papers and Proceedings 109.
Balasubramanian, Natarajan, Jin Woo Chang, Mariko Sakakibara, Jagadeesh Sivadasan, and Evan Starr. 2020. “Locked In? The Enforceability of Covenants Not to Compete and the Careers of High-Tech Workers.” Journal of Human Resources no. 1218-9931R1.
Barkai, Simcha. 2020. “Declining Labor and Capital Shares.” Journal of Finance 75, no. 5: 2421–63.
Bassier, Ihsaan, Arindrajit Dube, and Suresh Naidu. 2020. “Monopsony in Movers: The Elasticity of Labor Supply to Firm Wage Policies.” Working Paper 27755. National Bureau of Economic Research.
Batt, Rosemary, Virginia Doellgast, and Hyunji Kwon. 2006. “Service Management and Employment Systems in U.S. and Indian Call Centers.” In Brookings Trade Forum 2005: Offshoring White-Collar Work—The Issues and Implications, edited by Susan M. Collins and Lael Brainard. Brookings Institution.
Batt, Rosemary, David Holman, and Ursula Holtgrewe. 2009. “The Globalization of Service Work: Comparative Institutional Perspectives on Call Centers.” Industrial & Labor Relations Review 62, no. 4: 453–88.
Batt, Rosemary, and Hiro Nohara. 2009. “How Institutions and Business Strategies Affect Wages: A Cross-National Study of Call Centers.” Industrial & Labor Relations Review 62, no. 4: 533–52.
Beaudry, Paul, David A. Green, and Benjamin M. Sand. 2013. “The Great Reversal in the Demand for Skill and Cognitive Tasks.” Working Paper 18901. National Bureau of Economic Research.
Beaudry, Paul, David A. Green and Benjamin M. Sand. 2014. “The Declining Fortunes of the Young Since 2000.” Papers and Proceedings of the 126th Annual Meeting of the American Economic Association 104, no. 5: 381–6.
Benmelech, Efraim, Nittai Bergman, and Hyunseob Kim. 2018. “Strong Employers and Weak Employees: How Does Employer Concentration Affect Wages?” Working Paper 24307. National Bureau of Economic Research.
Bensman, David. 2009. Stuck on the Low Road: Deregulation Turned Truck Driving from a Good Job to a Bad One. American Prospect, September.
Bergen, Mark, and Josh Eidelson. 2018. “Inside Google’s Shadow Workforce.” Bloomberg News, July 25.
Berlinski, Samuel. 2008. “Wages and Contracting Out: Does the Law of One Price Hold?” British Journal of Industrial Relations 46, no. 1: 59–75.
Bernhardt, Annette, Rosemary Batt, Susan Houseman, and Eileen Appelbaum. 2016. “Domestic Outsourcing in the United States: A Research Agenda to Assess Trends and Effects on Job Quality.” Working Paper 16-253. Upjohn Institute.
Bernhardt, Annette, Ruth Milkman, Nik Theodore, Douglas Heckathorn, Mirabai Auer, James DeFilippis, Ana Luz González, Victor Narro, Jason Perelshteyn, Diana Polson, and Michael Spiller. 2009. Broken Laws, Unprotected Workers: Violations of Employment and Labor Laws in America’s Cities. Center for Urban Economic Development, National Employment Law Project, and UCLA Institute for Research on Labor and Employment.
Bivens, Josh. 2010. Failure by Design: The Story Behind America’s Broken Economy. Ithaca, N.Y.: Cornell Univ. Press.
Bivens, Josh. 2013. “Using Standard Models to Benchmark the Costs of Globalization for American Workers Without a College Degree.” Economic Policy Institute.
Bivens, Josh. 2017a. Adding Insult to Injury: How Bad Policy Decisions Have Amplified Globalization’s Costs for American Workers. Economic Policy Institute.
Bivens, Josh. 2017b. “President Trump’s Alternative Facts Have Foreigners and Bureaucrats, Not the Top 1 Percent, Reaping the Gains from Economic Growth.” Working Economics (Economic Policy Institute blog), January 24.
Bivens, Josh. 2018. “The Fed Shouldn’t Give Up on Restoring Labor’s Share of Income—and Measure It Correctly.” Working Economics (Economic Policy Institute blog), January 30.
Bivens, Josh. 2019. “Predicting Wage Growth with Measures of Labor Market Slack: It’s Complicated.” Working Economics (Economic Policy Institute blog), March 19.
Bivens, Josh, Lora Engdahl, Elise Gould, Teresa Kroeger, Celine McNicholas, Lawrence Mishel, Zane Mokhiber, Heidi Shierholz, Marni von Wilpert, Valerie Wilson, and Ben Zipperer. 2017. How Today’s Unions Help Working People: Giving Workers the Power to Improve Their Jobs and Unrig the Economy. Economic Policy Institute.
Bivens, Josh, Elise Gould, Lawrence Mishel, and Heidi Shierholz. 2014. Raising America’s Pay: Why It’s Our Central Economic Policy Challenge. Economic Policy Institute, June 4.
Bivens, Josh, and Lawrence Mishel. 2013. “The Pay of Corporate Executives and Financial Professionals as Evidence of Rents in Top 1 Percent Incomes.” Journal of Economic Perspectives 27, no. 3: 57–78.
Bivens, Josh, and Lawrence Mishel. 2015. “Understanding the Historic Divergence Between Productivity and a Typical Worker’s Pay: Why It Matters and Why It’s Real.” Economic Policy Institute.
Bivens, Josh, Lawrence Mishel, and John Schmitt. 2018. It’s Not Just Monopoly and Monopsony: How Market Power Has Affected American Wages. Economic Policy Institute.
Bivens, Josh, and Ben Zipperer. 2018. The Importance of Locking in Full Employment for the Long Haul. Economic Policy Institute.
Blanchard, Olivier, and Dani Rodrik, eds. 2021. Combating Inequality: Rethinking Government’s Role. MIT Press.
Block, Sharon, and Benjamin H. Harris, eds. 2021. Inequality and the Labor Market: The Case for Greater Competition. Brookings Institution Press.
Bloom, Nicholas, Faith Guvenen, Benjamin Smith, Jae Song, and Till von Wachter. 2018. “Is the Large Firm Wage Premium Dead or Merely Resting?” AEA Papers and Proceedings 108, no. 1: 317–22.
Bronfenbrenner, Kate. 2009. No Holds Barred: The Intensification of Employer Opposition to Organizing. Economic Policy Institute and the American Rights at Work Education Fund.
Bureau of Labor Statistics (BLS). 2018. “Contingent and Alternative Employment Arrangements, May 2017” (press release). June 7.
Callaci, Brian. 2019. “Fissuring in Flight: Consolidation and Outsourcing in the U.S. Domestic Airline Industry, 1997–2018.” Unpublished.
Callaway, Brantly, and William J. Collins. 2017. “Unions, Workers, and Wages at the Peak of the American Labor Movement.” Working Paper 23516. National Bureau of Economic Research.
Card, David. 1991. “The Effect of Unions on the Distribution of Wages: Redistribution or Relabeling?” Working Paper 287. National Bureau of Economic Research.
Card, David. 1996. “The Effect of Unions on the Structure of Wages: A Longitudinal Analysis.” Econometrica 64, no. 4: 957–79.
Card, David, Ana Rute Cardoso, Joerg Heining, and Patrick Kline. 2018. “Firms and Labor Market Inequality: Evidence and Some Theory.” Journal of Labor Economics 36, no. S1: 13–70.
Card, David, and John DiNardo. 2002. “Skill-Biased Technological Change and Rising Wage Inequality: Some Problems and Puzzles.” Journal of Labor Economics 20, no. 4: 733–83.
Carré, Françoise. 2015. (In)dependent Contractor Misclassification. Economic Policy Institute.
Census Bureau. 2020. “Legacy BDS Firm Characteristics Data Tables 1977–2014” [data table], Longitudinal Business Database . Accessed February 2020.
Collins, Brett, Andrew Garin, Emilie Jackson, Dmitri Koustas, and Mark Paynek. 2019. “Is Gig Work Replacing Traditional Employment? Evidence from Two Decades of Tax Returns.” Internal Revenue Service.
Colvin, Alexander J.S. 2018. The Growing Use of Mandatory Arbitration: Access to the Courts Is Now Barred for More Than 60 Million American Workers. Economic Policy Institute.
Colvin, Alexander J.S., and Heidi Shierholz. 2019. Noncompete Agreements: Ubiquitous, Harmful to Wages and to Competition, and Part of a Growing Trend of Employers Requiring Workers to Sign Away Their Rights. Economic Policy Institute.
Cooper, David. 2019. Raising the Federal Minimum Wage to $15 by 2025 Would Lift Wages for Over 33 Million Workers (fact sheet). Economic Policy Institute, July 17.
Cooper, David, Elise Gould, and Ben Zipperer. 2019. Low-Wage Workers Are Suffering from a Decline in the Real Value of the Federal Minimum Wage. Economic Policy Institute.
Cooper, David, and Teresa Kroeger. 2017. Employers Steal Billions from Workers’ Paychecks Each Year: Survey Data Show Millions of Workers Are Paid Less Than the Minimum Wage, at Significant Cost to Taxpayers and State Economies. Economic Policy Institute.
Costa, Daniel. 2019. Employers Increase Their Profits and Put Downward Pressure on Wages and Labor Standards by Exploiting Migrant Workers. Economic Policy Institute.
Costa, Daniel and Ron Hira. 2020. “EPI Comments on USCIS Preference Allocation System for H-1B Visas by Prevailing Wage Level.” Public comments, U.S. Citizenship and Immigration Services, Department of Homeland Security, Modification of Registration Requirement for Petitioners Seeking to File Cap-Subject H-1B Petitions, Notice of proposed rulemaking, CIS Docket No. 2674-20, DHS Docket No. USCIS-2020-001, RIN: 1615-AC61, December 2.
Costa, Daniel, and Philip Martin. 2019. “OECD Highlights Temporary Labor Migration: Almost as Many Guestworkers as Permanent Immigrants.” Working Economics (Economic Policy Institute blog), December 4.
Costa, Daniel, and Jennifer Rosenbaum. 2017. Temporary Foreign Workers by the Numbers: New Estimates by Visa Classification. Economic Policy Institute.
Council of Economic Advisers. 1995. Economic Report of the President (1995). U.S. Government Printing Office.
Daly, Mary, and Bart Hobijin. 2014. “Downward Nominal Wage Rigidities Bend the Phillips Curve.” Journal of Money, Credit and Banking 46, no. 52.
De Loecker, Jan, Jan Eeckhout, and Gabriel Unger. 2020. “The Rise of Market Power and the Macroeconomic Implications.” Quarterly Journal of Economics 135, no. 2: 561–644. https://doi.org/10.1093/qje/qjz041.
Denice, Patrick, and Jake Rosenfeld. 2018. “Unions and Nonunion Pay in the United States, 1977–2015.” Sociological Science 5: 541–61.
Department of Commerce. Various years. “Franchising and the Economy.”
Department of Labor. No date. History of Changes to the Minimum Wage Law.
Department of Labor (Wage and Hour Division). 2016. Defining and Delimiting the Exemptions for Executive, Administrative, Professional, Outside Sales and Computer Employees, 81 Fed. Reg. 32391–32552 (May 23).
Deutsch, Rachel, Kate Hamaji, Elizabeth Nicolas, Celine McNicholas, Margaret Poydock, and Heidi Shierholz. 2019. Unchecked Corporate Power: Forced Arbitration, the Enforcement Crisis, and How Workers Are Fighting Back. Center for Popular Democracy and Economic Policy Institute.
DiNardo, John, Nicole M. Fortin, and Thomas Lemieux. 1996. “Labor Market Institutions and the Distribution of Wages.” Econometrica 64, no. 5: 1001–44.
Dube, Arindrajit, Laura Giuliano, and Jonathan Leonard. 2019. “Fairness and Frictions: Impact of Unequal Raises on Quit Behavior.” American Economic Review 109, no. 2: 620–63.
Dube, Arindrajit, Jeff Jacobs, Suresh Naidu, and Siddharth Suri. 2020. “Monopsony in Online Labor Markets.” American Economic Review: Insights 2, no. 1: 33–46.
Dube, Arandajit, and Ethan Kaplan. 2010. “Does Outsourcing Reduce Wages in the Low-Wage Service Occupations? Evidence from Janitors and Guards.” Industrial and Labor Relations Review 63, no. 2: 287–306.
Economic Policy Institute. 2012. “Minimum-Wage Impact on 50/10 Wage Gap, 1979–2009” . The State of Working America. Washington, D.C.: Economic Policy Institute.
Economic Policy Institute. 2019a. “Productivity–Pay Gap.” Last updated July 2019.
Economic Policy Institute. 2019b. “Black–White Wage Gap.” State of Working America Data Library.
Economic Policy Institute. 2019c. State of Working America Data Library, “College Wage Premium.” State of Working America Data Library.
Economic Policy Institute. Various dates. “Wages.” State of Working America Data Library.
Eisenbrey, Ross, and Lawrence Mishel. 2015. “The New Overtime Salary Threshold Would Directly Benefit 13.5 Million Workers: How EPI’s Estimates Differ from the Department of Labor’s.” Economic Policy Institute.
Eisenbrey, Ross, and Lawrence Mishel. 2016. “Explaining the Differences Between EPI and DOL Estimates of Workers Affected by the New Overtime Salary Threshold.” Working Economics (Economic Policy Institute blog), May 20.
Erickson, Christopher L., and Daniel J.B. Mitchell. 2008. “Monopsony as a Metaphor for the Emerging Post-Union Labour Market.” International Labour Review 146, no. 3–4 (January): 163–87. https://doi.org/10.1111/j.1564-913X.2007.00012.x.
Farber, Henry S., Daniel Herbst, Ilyana Kuziemko, and Suresh Naidu. 2021. “Unions and Inequality over the Twentieth Century: New Evidence from Survey Data.” Working Paper 24587. May 2018, revised April 2021. National Bureau of Economic Research.
Farhi, Emmanuel, and François Gourio. 2018. “Accounting for Macro-Finance Trends: Market Power, Intangibles, and Risk Premia.” Brookings Papers on Economic Activity (Fall): 147–250.
Federal Reserve Bank of New York. 2020. The Labor Market for Recent College Graduates (interactive web feature). Last updated February 12, 2020.
Fortin, Nicole M., and Thomas Lemieux. 1997. “Institutional Changes and Rising Wage Inequality: Is There a Linkage?” Journal of Economic Perspectives 11, no. 2: 75–96.
Fortin, Nicole M., Thomas Lemieux, and Neil Lloyd. 2021. “Labor Market Institutions and the Distribution of Wages: The Role of Spillover Effects.” Working Paper 28375. National Bureau of Economic Research.
Freeman, Richard. 1991. “How Much Has De-Unionization Contributed to the Rise in Male Wage Inequality?” Working Paper 3826. National Bureau of Economic Research.
Freeman, Richard B., and James L. Medoff. 1984. What Do Unions Do? Basic Books.
Galbraith, James. 1997. “Time to Ditch the NAIRU.” Journal of Economic Perspectives 11, no. 1: 93–108.
Galbraith, James K. 1998. Created Unequal: The Crisis in American Pay. Free Press.
Goldin, Claudia, and Lawrence F. Katz. 2007. “The Race Between Education and Technology: The Evolution of U.S. Educational Wage Differentials, 1890 to 2005.” Working Paper 12984. National Bureau of Economic Research.
Goldin, Claudia, and Lawrence F. Katz. 2008. The Race Between Education and Technology. Harvard Univ. Press.
Goldschmidt, Deborah, and Johannes Schmieder. 2017. “The Rise of Domestic Outsourcing and the Evolution of the German Wage Structure.” Quarterly Journal of Economics 132, no. 3: 1165–217.
Goos, Maarten, Alan Manning, and Anna Salomons. 2014. “Explaining Job Polarization: Routine-Biased Technological Change and Offshoring.” American Economic Review 104, no. 8: 2509–26.
Gould, Elise. 2018. The State of American Wages 2017: Wages Have Finally Recovered from the Blow of the Great Recession but Are Still Growing Too Slowly and Unequally. Economic Policy Institute.
Gould, Elise. 2020. State of Working America Wages 2019: A Story of Slow, Uneven, and Unequal Wage Growth over the Last 40 Years. Economic Policy Institute.
Greene, Jay. 2021. “Amazon Shortchanged Drivers $61.7 Million in Tips. Now It Has Settled with the FTC to Pay Up.” Washington Post, February 2.
Greenhouse, Steven. 2020. “02: The Future of Work.” The World as You’ll Know It (podcast transcript), 32:38.
Greenwald, Daniel L., Martin Lettau, and Sydney C. Ludvigson. 2019. “How the Wealth Was Won: Factors Shares as Market Fundamentals.” Working Paper 25769. National Bureau of Economic Research.
Groshen, Erica L., and Harry J. Holzer. 2019. “Improving Employment and Earnings in Twenty-First Century Labor Markets.” Russell Sage Foundation Journal of the Social Sciences 5, no. 5.
Grullon, Gustavo, Yelena Larkin, and Roni Michaely. 2015. “Are U.S. Industries Becoming Concentrated?” Swiss Finance Institute Research Paper 19-41, forthcoming in Review of Finance, posted online May 31, 2015.
Hacker, Jacob S., and Paul Pierson. 2011. Winner-Take-All Politics: How Washington Made the Rich Richer—and Turned Its Back on the Middle Class. Simon & Schuster.
Hacker, Jacob S., and Paul Pierson. 2020. Let Them Eat Tweets: How the Right Rules in an Age of Extreme Inequality. Liveright Publishing.
Hooper, Peter, Frederic S. Mishkin, and Amir Sufi. 2019. “Prospects for Inflation in a High Pressure Economy: Is the Phillips Curve Dead or Is It Just Hibernating?” Working Paper 25792. National Bureau of Economic Research.
Howell, David R. 2001. “The Skills Myth.” American Prospect, December 19, 2001.
Howell, David R., and Arne L. Kalleberg. 2019. “Declining Job Quality in the United States: Explanations and Evidence.” Russell Sage Foundation Journal of the Social Sciences 5, no. 4: 1–53.
Howell, David R., and Susan S. Wieler. 1998. “Skill-Biased Demand Shifts and Wage Collapse in the United States: A Critical Perspective.” Eastern Economic Journal 24, no. 3: 343–66.
Hunt, Jennifer, and Ryan Nunn. 2019. “Is Employment Polarization Informative About Wage Inequality and Is Employment Really Polarizing?” Working Paper 26064. National Bureau of Economic Research.
Johnson, Matthew S., Kurt Lavetti, and Michael Lipsitz. 2020. “The Labor Market Effects of Legal Restrictions on Worker Mobility.” Federal Trade Commission, Bureau of Economics.
Katz, Lawrence, and Alan Krueger. 1999. “The High-Pressure Labor Market of the 1990s.” Brookings Papers on Economic Activity 1.
Katz, Lawrence F., and Kevin M. Murphy. 1992. “Changes in Relative Wages, 1963–87: Supply and Demand Factors.” Quarterly Journal of Economics 107 (February): 35–78.
Kearney, Melissa S., Brad Hershbein, and David Boddy. 2015. “The Future of Work in the Age of the Machine.” Brookings Institution: Hamilton Project.
Kimball, Will, and Lawrence Mishel. 2016. Nearly One-Third of Salaried Workers Will Be Guaranteed Overtime Under the New Rule, but That Falls Short of the Half Covered in the Mid-1970s. Economic Snapshot. Economic Policy Institute, June.
Kochan, Thomas A., and Will Kimball. 2019. “Unions, Worker Voice, and Management Practices: Implications for a High-Productivity, High-Wage Economy.” Russell Sage Foundation Journal of the Social Sciences 5, no. 5.
Kochan, Thomas A., Will Kimball, Duanyi Yang, and Erin L. Kelly. 2018. “Worker Voice in America: Is There a Gap Between What Workers Expect and What They Get?” ILR Review 72, no. 1: 3–38. https://doi.org/10.1177/0019793918806250.
Kopczuk, Wojciech, Emmanuel Saez, and Jae Song. 2007. “Uncovering the American Dream: Inequality and Mobility in Social Security Earnings Data Since 1937.” National Bureau of Economic Research Working Paper no. 13345, August 2007.
Kosová, Renáta, and Francine Lafontaine. 2012. “Much Ado About Chains: A Research Agenda.” International Journal of Industrial Organization 30: 303–8.
Krogstad, Jens Manuel, Jeffrey Passel, and D’vera Cohn. 2019. “5 Facts About Illegal Immigration in the U.S.” Pew Research Center.
Krueger, Alan B. 2017. “The Rigged Labor Market.” Milken Institute Review, April 28.
Krueger, Alan B. 2018. “Reflections on Dwindling Worker Bargaining Power and Monetary Policy.” Luncheon Address at the Jackson Hole Economic Symposium, August 24.
Krueger, Alan B., and Orley Ashenfelter. 2018. “Theory and Evidence on Employer Collusion in the Franchise Sector.” Working Paper 24831. National Bureau of Economic Research.
Lafontaine, Francine, and Roger D. Blair. 2009. “The Evolution of Franchising and Franchise Contracts: Evidence from the United States.” Entrepreneurial Business Law Journal 3, no. 2: 381–434.
Langella, Monica, and Alan Manning. 2020. “The Measure of Monopsony.” Video, 56:28. Marshall Lecture, Annual Congress of the European Economic Association.
Lazear, Edward P. 2019. “Mind the Productivity Gap to Reduce Inequality: It Isn’t Only an American Problem, but the U.S. Has Lessons to Learn from Other Wealthy Countries.” Wall Street Journal, May 6.
Lettieri, John W. 2020. A Better Bargain: How Noncompete Reform Can Benefit Workers and Boost Economic Dynamism. American Enterprise Institute.
Levy, Frank, and Peter Temin. 2007. “Inequality and Institutions in 20th Century America.” Working Paper 13106. National Bureau of Economic Research.
Lipsitz, Michael, and Evan Starr. 2020. “Low-Wage Workers and the Enforceability of Non-Compete Agreements.” Forthcoming in Management Science. Online version October 20, 2020.
Lipsky, David B. 2007. “Conflict Resolution and the Transformation of the Social Contract.” Labor and Employment Relations Association Presidential Address, January.
Locke, Mandy, and Franco Ordonez. 2014. “Taxpayers and Workers Gouged by Labor-Law Dodge.” McClatchy Washington Bureau, September 4.
Lopez, German. 2019. “I Was Skeptical of Unions. Then I Joined One.” Vox, August 19.
Maestas, Nicole, Kathleen J. Mullen, David Powell, Till von Wachter, and Jeffrey B. Wenger. 2017. Working Conditions in the United States: Results of the 2015 American Working Conditions Survey. RAND Corporation.
Manduca, Robert. 2018. “Income Inequality and the Persistence of Racial Economic Disparities.” Sociological Science 5: 182–205.
McAdams, John M. 2019. “Non-Compete Agreements: A Review of the Literature.” Federal Trade Commission, Bureau of Economics. http://dx.doi.org/10.2139/ssrn.3513639.
McNicholas, Celine, Zane Mokhiber, and Adam Chaikof. 2017. Two Billion Dollars in Stolen Wages Were Recovered for Workers in 2015 and 2016—and That’s Just a Drop in the Bucket. Economic Policy Institute.
McNicholas, Celine, Margaret Poydock, Julia Wolfe, Ben Zipperer, Gordon Lafer, and Lola Loustaunau. 2019. Unlawful: U.S. Employers Are Charged with Violating Federal Law in 41.5% of All Union Election Campaigns. Economic Policy Institute.
Mishel, Lawrence. 2014. “Low-Wage Workers Have Far More Education Than They Did in 1968, Yet They Make Far Less.” Economic Snapshot. Economic Policy Institute, January 23.
Mishel, Lawrence. 2018. Yes, Manufacturing Still Provides a Pay Advantage, but Staffing Firm Outsourcing Is Eroding It. Economic Policy Institute, March.
Mishel, Lawrence. 2019. “Private Sector Union Density Dynamics, 1951–2017.” Presentation at Columbia University, September 12.
Mishel, Lawrence, and Jared Bernstein. 1994. “Is the Technology Black Box Empty? An Empirical Examination of the Impact of Technology on Wage Inequality and the Employment Structure.” Technical Paper. Economic Policy Institute.
Mishel, Lawrence, and Jared Bernstein. 1998. “Technology and the Wage Structure: Has Technology’s Impact Accelerated Since the 1970s?” Research in Labor Economics 17: 305–56.
Mishel, Lawrence, Jared Bernstein, and John Schmitt. 1997a. The State of Working America 1996–1997. An Economic Policy Institute book. M.E. Sharpe.
Mishel, Lawrence, Jared Bernstein, and John Schmitt. 1997b. “Did Technology Have Any Effect on the Growth of Wage Inequality in the 1980s and 1990s?” Economic Policy Institute.
Mishel, Lawrence, and Josh Bivens. 2013. The Pay of Corporate Executives and Financial Professions as Evidence of Rents in Top 1 Percent Incomes. Economic Policy Institute.
Mishel, Lawrence, and Josh Bivens. 2017. “The Zombie Robot Argument Lurches On: There Is No Evidence That Automation Leads to Joblessness or Inequality.” Economic Policy Institute.
Mishel, Lawrence, Josh Bivens, Elise Gould, and Heidi Shierholz. 2012. The State of Working America, 12th Edition. An Economic Policy Institute book. Cornell Univ. Press.
Mishel, Lawrence, and Jori Kandra. 2020. “Wages for the Top 1% Skyrocketed 160% Since 1979 While the Share of Wages for the Bottom 90% Shrunk: Time to Remake Wage Pattern with Economic Policies That Generate Robust Wage-Growth for Vast Majority.” Working Economics (Economic Policy Institute blog), December.
Mishel, Lawrence, and Melat Kassa. 2019. “Top 1.0 Percent of Earners See Wages Up 157.8% Since 1979.” Working Economics (Economic Policy Institute blog), December 18.
Mishel, Lawrence, Lynn Rhinehart, and Lane Windham. 2020. “Explaining the Erosion of Private-Sector Unions: How Corporate Practices and Legal Changes Have Undercut the Ability of Workers to Organize and Bargain.” Economic Policy Institute.
Mishel, Lawrence, John Schmitt, and Heidi Shierholz. 2014. “Wage Inequality: A Story of Policy Choices.” SAGE Journals, August 4.
Mishel, Lawrence, and Heidi Shierholz. 2017. “Robots, or Automation, Are Not the Problem: Too Little Worker Power Is.” Economic Policy Institute.
Mishel, Lawrence, Heidi Shierholz, and John Schmitt. 2013. “Don’t Blame the Robots: Assessing the Job Polarization Explanation of Growing Wage Inequality.” Economic Policy Institute.
Mishel, Lawrence, and Julia Wolfe. 2018. “Top 1.0 Percent Reaches Highest Wages Ever—Up 157 Percent Since 1979.” Working Economics (Economic Policy Institute blog), October 18.
Mitchell, Daniel J.B., and C L. Erickson. 2005. “Not Yet Dead at the Fed: Unions, Worker Bargaining, and Economy-Wide Wage Determination.” Industrial Relations, 44, no. 3: 565–606.
New York Times Editorial Board. 2018. “The Trouble with Trucking.” New York Times, August 11.
Naidu, Suresh, Eric A. Posner, and E. Glen Weyl. 2018. “Antitrust Remedies for Labor Market Power.” Coase-Sandor Working Paper Series in Law and Economics, no. 850.
Naidu, Suresh, and Aaron Sojourner. 2020. Employer Power and Employee Skills: Understanding Workforce Training Programs in the Context of Labor Market Power. Roosevelt Institute, December.
Organisation for Economic Co-operation and Development (OECD). 2019a. International Migration Outlook 2019.
Organisation for Economic Co-operation and Development (OECD). 2019b. Negotiating Our Way Up: Collective Bargaining in a Changing World of Work.
Ormiston, Russell, Dale Belman, and Mark Erlich. 2020. An Empirical Methodology to Estimate the Incidence and Costs of Payroll Fraud in the Construction Industry. National Alliance for Fair Contracting.
Ortega, Francesc, and Amy Hsin. 2018. “Occupational Barriers and the Labor Market Penalty from Lack of Legal Status.” IZA Institute of Labor Economics No. 11680.
Pierce, Brooks. 1999. “Compensation Inequality.” Working Paper 323. Department of Labor, Bureau of Labor Statistics.
Piketty, Thomas, and Emmanuel Saez. 2003. “Income Inequality in the United States, 1913–1998.” Quarterly Journal of Economics 117, no. 1. (Longer updated version published in Top Incomes over the Twentieth Century, A.B. Atkinson and T. Piketty, eds., Oxford Univ. Press, 2007; tables and figures updated to 2017 in Excel format, March 2019.)
Posner, Eric A., Glen Weyl, and Suresh Naidu. 2018. “Antitrust Remedies for Labor Market Power.” Harvard Law Review 132, no. 2: 535–601.
Prescott, J.J., Norman D. Bishara, and Evan Starr. 2016. “Understanding Noncompetition Agreements: The 2014 Noncompete Survey Project.” Michigan State Law Review, no. 2: 369–464.
Rinz, Kevin. 2018. “Labor Market Concentration, Earnings Inequality, and Earnings Mobility.” Working Paper 2018-10. U.S. Center for Administrative Records Research and Applications, Census Bureau.
Rosenfeld, Jake. 2014. What Unions No Longer Do. Harvard Univ. Press.
Rosenfeld, Jake. 2021. You’re Paid What You’re Worth and Other Myths of the Modern Economy. Belknap Press.
Rosenfeld, Jake, Patrick Denice, and Jennifer Laird. 2016. Union Decline Lowers Wages of Nonunion Workers: The Overlooked Reason Why Wages Are Stuck and Inequality Is Growing. Economic Policy Institute.
Schmitt, John, and Alexandra Mitukiewicz. 2012. “Politics Matter: Changes in Unionization Rates in Rich Countries, 1960–2010.” Industrial Relations Journal 43, no. 3: 260–80.
Shambaugh, Jay, Ryan Nunn, Patrick Liu, and Greg Nantz. 2017. Thirteen Facts About Wage Growth. Economic Facts. Brookings Institution: Hamilton Project.
Shierholz, Heidi. 2019. “More Than Eight Million Workers Will Be Left Behind by the Trump Overtime Rule: Workers Would Receive $1.4 Billion Less Than Under the 2016 Rule.” Working Economics (Economic Policy Institute blog), September 25.
Shierholz, Heidi. 2021. “The Importance of Enforcement in Designing Effective Labor Market Tools.” In Combating Inequality: Rethinking Government’s Role, edited by Olivier Blanchard and Dani Rodrik. MIT Press.
Smith, Matt, Jennifer Gollan, and Adithya Sambamurthy. 2014. “Job Brokers Steal Wages, Entrap Indian Tech Workers in U.S.” Reveal News, October 27.
Sokolova, Anna, and Todd Sorensen. 2020. “Monopsony in Labor Markets: A Meta-Analysis.” Washington Center for Equitable Growth.
Staiger, Douglas, James H. Stock, and Mark W. Watson. 1997. “The NAIRU, Unemployment and Monetary Policy.” Journal of Economic Perspectives 11, no. 1: 33–49.
Stansbury, Anna M., and Lawrence H. Summers. 2020. “Declining Worker Power and American Economic Performance.” Brooking Papers on Economic Activity: BPEA Conference Drafts.
Starr, Evan. 2019a. “Consider This: Training, Wages, and the Enforceability of Covenants Not to Compete.” ILR Review 72, no. 4: 783–817. https://doi.org/10.1177/0019793919826060.
Starr, Evan. 2019b. The Use, Abuse, and Enforceability of Non-Compete and No-Poach Agreements: A Brief Review of the Theory, Evidence, and Recent Reform Efforts. Economic Innovation Group.
Starr, Evan. 2020. Non-Competes in the Workplace: Examining Antitrust and Consumer Protections Issues. (Testimony to the Federal Trade Commission). Federal Trade Commission: Panel 2. January 9.
Starr, Evan, J.J. Prescott, and Norman D. Bishara. 2019. “The Behavioral Effects of (Unenforceable) Contracts.” Forthcoming in Journal of Law, Economics, and Organization, online version September 18, 2020.
Starr, Evan, J.J. Prescott, and Norman D. Bishara. 2020. “Noncompete Agreements in the U.S. Labor Force.” Forthcoming in Journal of Law and Economics, online version May 7, 2020.
Stiglitz, Joseph E. 2012. The Price of Inequality: How Today’s Divided Society Endangers Our Future. W. W. Norton.
Stiglitz, Joseph E. 2021. “Fostering More-Competitive Labor Markets.” In Inequality and the Labor Market: The Case for Greater Competition, edited by Sharon Block and Benjamin Harris. Brookings Institution Press.
Stockman, Farah. 2013. “Teacher Trafficking: The Strange Saga of Filipino Workers, American Schools, and H-1B Visas.” Boston Globe, June 12.
Stone, Katherine V.W., and Alexander J.S. Colvin. 2015. The Arbitration Epidemic: Mandatory Arbitration Deprives Workers and Consumers of Their Rights. Economic Policy Institute.
Stuyven, Dann. 2018. “Superstar Firms, Super Profits, and Shrinking Wage Shares.” U.S. Economics Analyst, Goldman Sachs Economics Research Note, February 4 (not publicly available).
Summers, Lawrence. 2015. “The Future of Work in the Age of the Machine: A Hamilton Project Policy Forum.” Brookings Institution: Hamilton Project, February 19.
Uber Technologies (Uber). 2019. “Form S-1 Registration Statement, United States Securities and Exchange Commission.” April 11.
USA Today. 2018. “Read Transcript of Former President Obama’s Speech, Blasting President Trump.” September 7.
USA Today Editorial Board. 2017. “Rigged System Rips Off Port Truckers: Modern-Day Indentured Servitude Thrives in Southern California.” June 20.
U.S. Government Accountability Office (U.S. GAO). 1989. “Tax Administration: Information Returns Can Be Used to Identify Employers Who Misclassify Workers.” GAO/GGD-89-107.
U.S. Government Accountability Office (U.S. GAO). 2009. “Employee Misclassification: Improved Coordination, Outreach, and Targeting Could Better Ensure Detection and Prevention.”
Valletta, Robert G. 2017. “Recent Flattening in the Higher Education Wage Premium: Polarization, Skill Downgrading, or Both?” In Education, Skills, and Technical Change: Implications for Future U.S. GDP Growth. National Bureau of Economic Research.
Viscelli, Steve. 2016. The Big Rig: Trucking and the Decline of the American Dream. Univ. of California Press.
Webber, Douglas A. 2015. “Firm Market Power and the Earnings Distribution” Labour Economics 35: 123–134.
Webber, Douglas A. 2018. “Employment Adjustment Over the Business Cycle: The Impact of Competition in the Labor Market.” IZA Discussion Papers 11887, Institute of Labor Economics (IZA).
Webber, Douglas A. 2020. “Labor Market Competition and Employment Adjustment over the Business Cycle.” Journal of Human Resources 56, no. 2.
Weil, David. 2014. The Fissured Workplace: Why Work Became So Bad for So Many and What Can Be Done About It. Harvard Univ. Press.
Weil, David. 2017. “Lots of Employees Get Misclassified as Contractors. Here’s Why It Matters.” Harvard Business Review, July 5.
Weil, David. 2019. “ The Present and Future of Work in the Fissured Workplace Context.” Russell Sage Foundation Journal of the Social Sciences 5, no. 5.
Western, Bruce, and Jake Rosenfeld. 2011. “Unions, Norms, and the Rise in U.S. Wage Inequality.” American Sociological Review 76, no. 4: 513–37.
Wilmers, Nathan. 2018. “Wage Stagnation and Buyer Power: How Buyer-Supplier Relations Affect U.S. Workers’ Wages, 1978 to 2014.” American Sociological Review, 1–28. https://doi.org/10.1177/0003122418762441.
Wilson, Valerie. 2015. The Impact of Full Employment on African American Employment and Wages. Full Employment Project at the Center on Budget and Policy Priorities.
Wilson, Valerie. 2020. “Racism and the Economy: Focus on Employment.” Working Economics (Economic Policy Institute blog), November 21.
Wilson, Valerie, and William M. Rodgers III. 2016. Black–White Wage Gaps Expand with Rising Wage Inequality. Economic Policy Institute.
Windham, Lane. 2017. Knocking on Labor’s Door: Union Organizing in the 1970s and the Roots of a New Economic Divide. Univ. of North Carolina Press.
Woodman, Spencer. 2015. “Exclusive: Amazon Makes Even Temporary Warehouse Workers Sign 18-Month Non-Competes.” The Verge, March 26.
Lawrence Mishel is a distinguished fellow at EPI after serving as president from 2002–2017. Mishel first joined EPI in 1987 as research director. In the more than three decades he has been with EPI, Mishel has helped build it into the nation’s premier research organization focused on U.S. living standards and labor markets.
Mishel has co-authored all 12 editions of The State of Working America, a book that former U.S. Labor Secretary Robert Reich says “remains unrivaled as the most-trusted source for a comprehensive understanding of how working Americans and their families are faring in today’s economy.” The State of Working America has been an invaluable resource in newsrooms, classrooms, and halls of power since 1988.
Mishel’s primary research interests include labor markets and education. He has written extensively on wage and job quality trends in the United States. He co-edited a research volume on emerging labor market institutions for the National Bureau of Economic Research. His 1988 research on manufacturing data led the U.S. Commerce Department to revise the way it measures U.S. manufacturing output. This new measure helped accurately document the long decline in U.S. manufacturing, a trend that is now widely understood.
Mishel leads EPI’s education research program. He has written extensively on charter schools, teacher pay, and high school graduation rates. His research with Joydeep Roy has shown that high school graduation rates are significantly higher than the rates that are often cited by education analysts. This work has enabled policymakers to more accurately assess the state of U.S. public education.
Mishel has testified before Congress on the importance of promoting policies that reduce inequality, generate jobs, improve the lives of American workers and their families, and strengthen the middle class. He also serves frequently as a commentator in print, broadcast, and online media.
Prior to joining EPI, Mishel held a number of research roles, including a fellowship at the U.S. Department of Labor. He also served as a faculty member at Cornell University’s School of Industrial and Labor Relations. Mishel also served as an economist for several unions, including the Auto Workers, Steelworkers, AFSCME, and the Industrial Union Department, AFL-CIO. Mishel holds a Ph.D. in economics from the University of Wisconsin at Madison. Originally from Philadelphia, he has four children and two grandsons and lives with his wife and his dog, Bella, in Washington, D.C.
Education
Ph.D., Economics, University of Wisconsin at Madison
M.A., Economics, American University
B.S., Pennsylvania State University
Josh Bivens is the director of research at the Economic Policy Institute (EPI). His areas of research include macroeconomics, fiscal and monetary policy, the economics of globalization, social insurance, and public investment. He frequently appears as an economics expert on news shows, including the Public Broadcasting Service’s “NewsHour,” the “Melissa Harris-Perry” show on MSNBC, WAMU’s “The Diane Rehm Show,” American Public Media’s “Marketplace,” and programs of the BBC.
As a leading policy analyst, Bivens regularly testifies before the U.S. Congress on fiscal and monetary policy, the economic impact of regulations, and other issues. He has also provided analyses for the annual meeting of Project LINK of the United Nations and the Trade Union Advisory Committee (TUAC) of the Organization of Economic Cooperation and Development (OECD).
Bivens is the author of Failure by Design: The Story behind America’s Broken Economy (EPI and Cornell University Press) and Everybody Wins Except for Most of Us: What Economics Really Teaches About Globalization (EPI). He is the co-author of The State of Working America, 12th Edition (EPI and Cornell University Press) and a co-editor of Good Jobs, Bad Jobs, No Jobs: Labor Markets and Informal Work in Egypt, El Salvador, India, Russia and South Africa (EPI).
His academic articles have appeared in the International Review of Applied Economics, the Journal of Economic Issues and the Journal of Economic Perspectives. Bivens has also provided peer-reviewed articles to several edited collections, including The Handbook of the Political Economy of Financial Crises (Oxford University Press), Public Economics in the United States: How the Federal Government Analyzes and Influences the Economy (ABC-CLIO), and Restoring Shared Prosperity: A Policy Agenda from Leading Keynesian Economists (AFL-CIO and the Macroeconomic Policy Institute).
Prior to becoming director of research, Bivens was a research economist at EPI. Before coming to EPI, he was an assistant professor of economics at Roosevelt University and provided consulting services to Oxfam America. He has a Ph.D. in economics from the New School for Social Research and a bachelor’s degree from the University of Maryland at College Park.
Education
Ph.D., Economics, New School for Social Research
B.A., Economics, University of Maryland at College Park
Join with the Economic Policy Institute to build an economy that works for everyone
We need your help in order to continue our work on behalf of hard-working Americans. Our donors value our high-quality research, reputation for truth-telling, and practical policy solutions. Your tax-deductible gift to EPI makes you an important partner in providing this critical public service.
Spread the word